
|
|||||
|
 | |
| |
| |
| |
| |
| |
|
Gene: TIMP3 |
Gene summary for TIMP3 |
| Gene information | Species | Human | Gene symbol | TIMP3 | Gene ID | 7078 |
| Gene name | TIMP metallopeptidase inhibitor 3 | |
| Gene Alias | HSMRK222 | |
| Cytomap | 22q12.3 | |
| Gene Type | protein-coding | GO ID | GO:0000165 | UniProtAcc | P35625 |
Top |
Malignant transformation analysis |
| Identification of the aberrant gene expression in precancerous and cancerous lesions by comparing the gene expression of stem-like cells in diseased tissues with normal stem cells |
| Entrez ID | Symbol | Replicates | Species | Organ | Tissue | Adj P-value | Log2FC | Malignancy |
| 7078 | TIMP3 | GSM4909281 | Human | Breast | IDC | 2.27e-14 | 3.62e-01 | 0.21 |
| 7078 | TIMP3 | GSM4909302 | Human | Breast | IDC | 2.10e-03 | 2.94e-01 | 0.1545 |
| 7078 | TIMP3 | GSM4909308 | Human | Breast | IDC | 3.40e-18 | 5.56e-01 | 0.158 |
| 7078 | TIMP3 | GSM4909319 | Human | Breast | IDC | 2.55e-15 | 6.24e-01 | 0.1563 |
| 7078 | TIMP3 | GSM4909320 | Human | Breast | IDC | 2.02e-05 | 6.89e-01 | 0.1575 |
| 7078 | TIMP3 | NCCBC2 | Human | Breast | DCIS | 1.08e-02 | 7.31e-01 | 0.1554 |
| 7078 | TIMP3 | LZE2T | Human | Esophagus | ESCC | 3.79e-02 | 2.14e-01 | 0.082 |
| 7078 | TIMP3 | LZE4T | Human | Esophagus | ESCC | 1.00e-03 | -3.50e-01 | 0.0811 |
| 7078 | TIMP3 | P2T-E | Human | Esophagus | ESCC | 2.07e-09 | 5.22e-01 | 0.1177 |
| 7078 | TIMP3 | P4T-E | Human | Esophagus | ESCC | 9.93e-41 | 2.08e+00 | 0.1323 |
| 7078 | TIMP3 | P5T-E | Human | Esophagus | ESCC | 3.15e-52 | 1.89e+00 | 0.1327 |
| 7078 | TIMP3 | P8T-E | Human | Esophagus | ESCC | 5.44e-03 | 5.38e-01 | 0.0889 |
| 7078 | TIMP3 | P10T-E | Human | Esophagus | ESCC | 4.64e-48 | 2.01e+00 | 0.116 |
| 7078 | TIMP3 | P11T-E | Human | Esophagus | ESCC | 9.78e-34 | 2.94e+00 | 0.1426 |
| 7078 | TIMP3 | P12T-E | Human | Esophagus | ESCC | 1.98e-12 | 5.50e-01 | 0.1122 |
| 7078 | TIMP3 | P16T-E | Human | Esophagus | ESCC | 1.54e-05 | 3.17e-01 | 0.1153 |
| 7078 | TIMP3 | P17T-E | Human | Esophagus | ESCC | 1.56e-02 | 9.55e-01 | 0.1278 |
| 7078 | TIMP3 | P19T-E | Human | Esophagus | ESCC | 6.17e-08 | 1.61e+00 | 0.1662 |
| 7078 | TIMP3 | P21T-E | Human | Esophagus | ESCC | 1.23e-28 | 1.34e+00 | 0.1617 |
| 7078 | TIMP3 | P22T-E | Human | Esophagus | ESCC | 5.20e-35 | 1.57e+00 | 0.1236 |
| Page: 1 2 3 4 5 6 7 |
| Tissue | Expression Dynamics | Abbreviation |
| Breast | 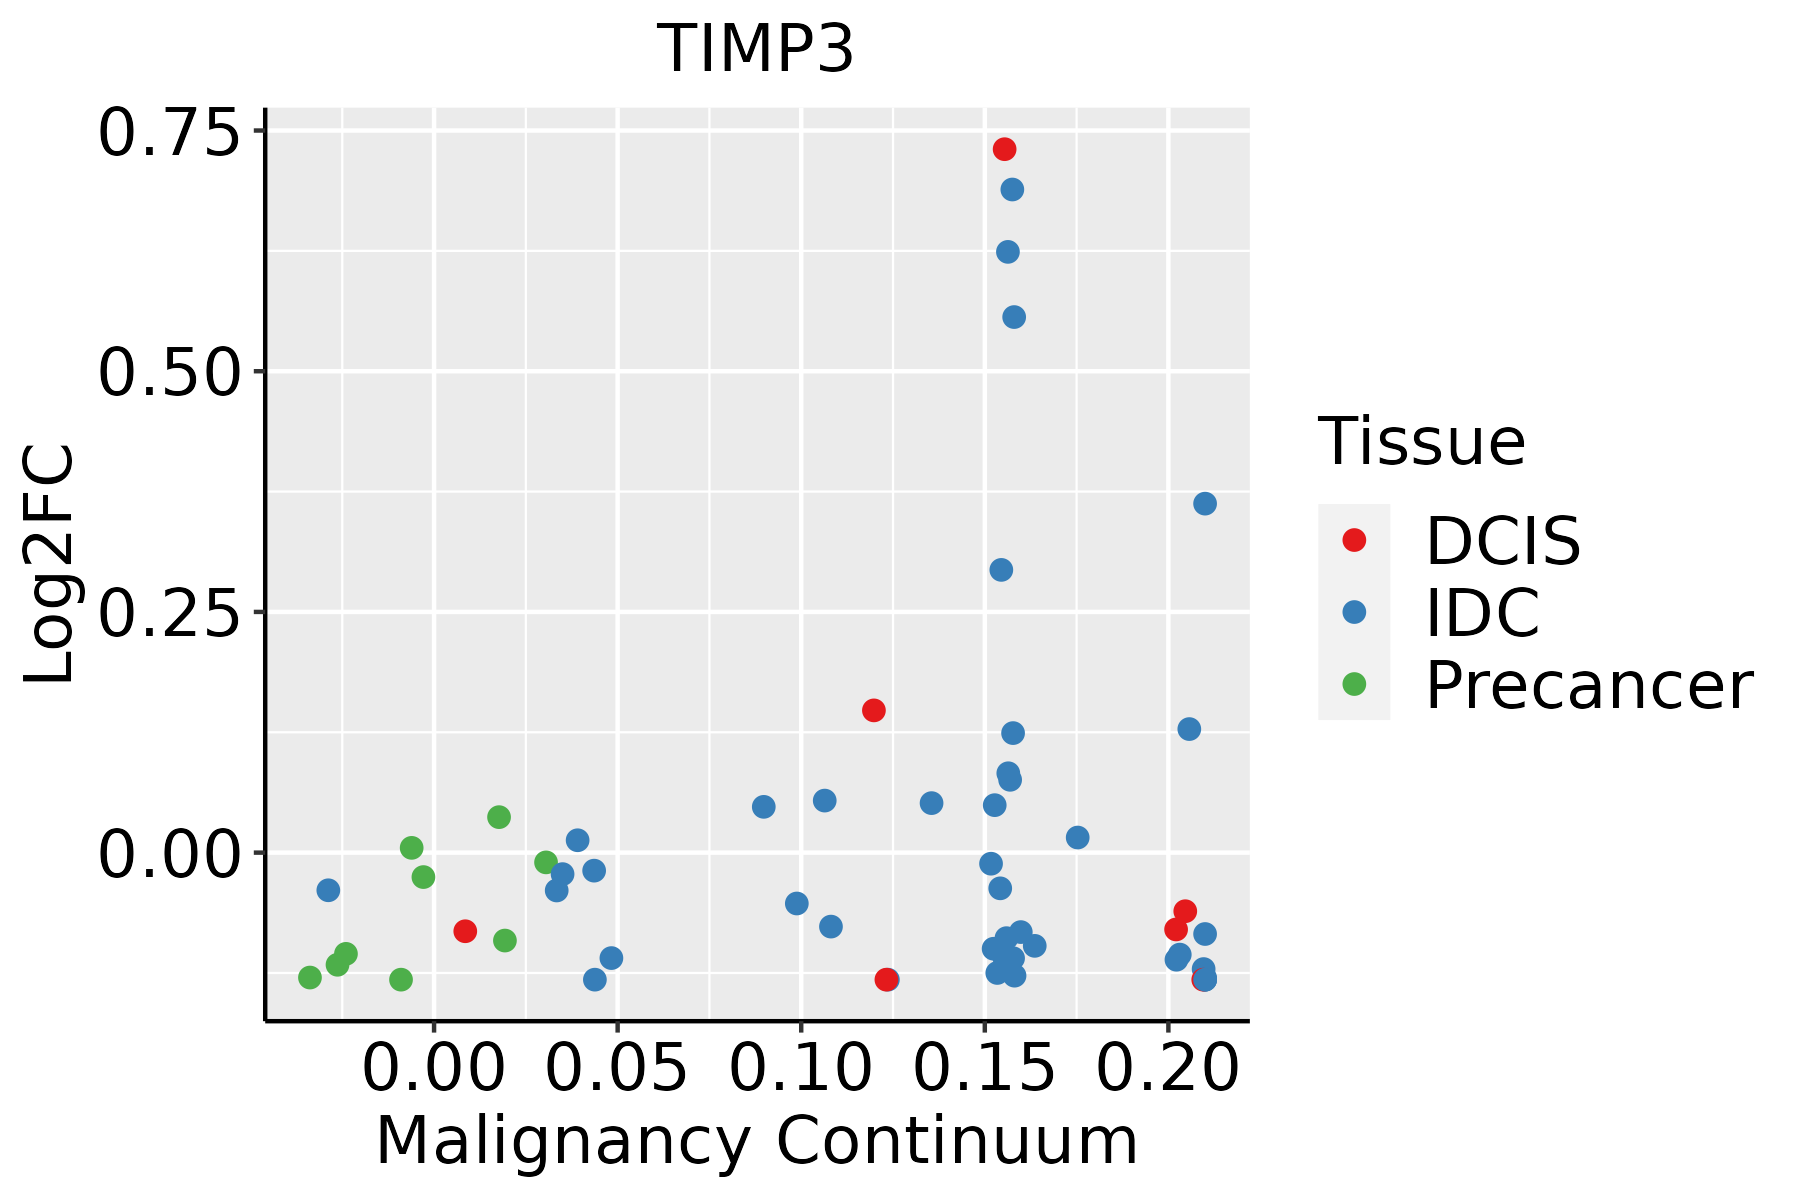 | IDC: Invasive ductal carcinoma |
| DCIS: Ductal carcinoma in situ | ||
| Precancer(BRCA1-mut): Precancerous lesion from BRCA1 mutation carriers | ||
| Esophagus | 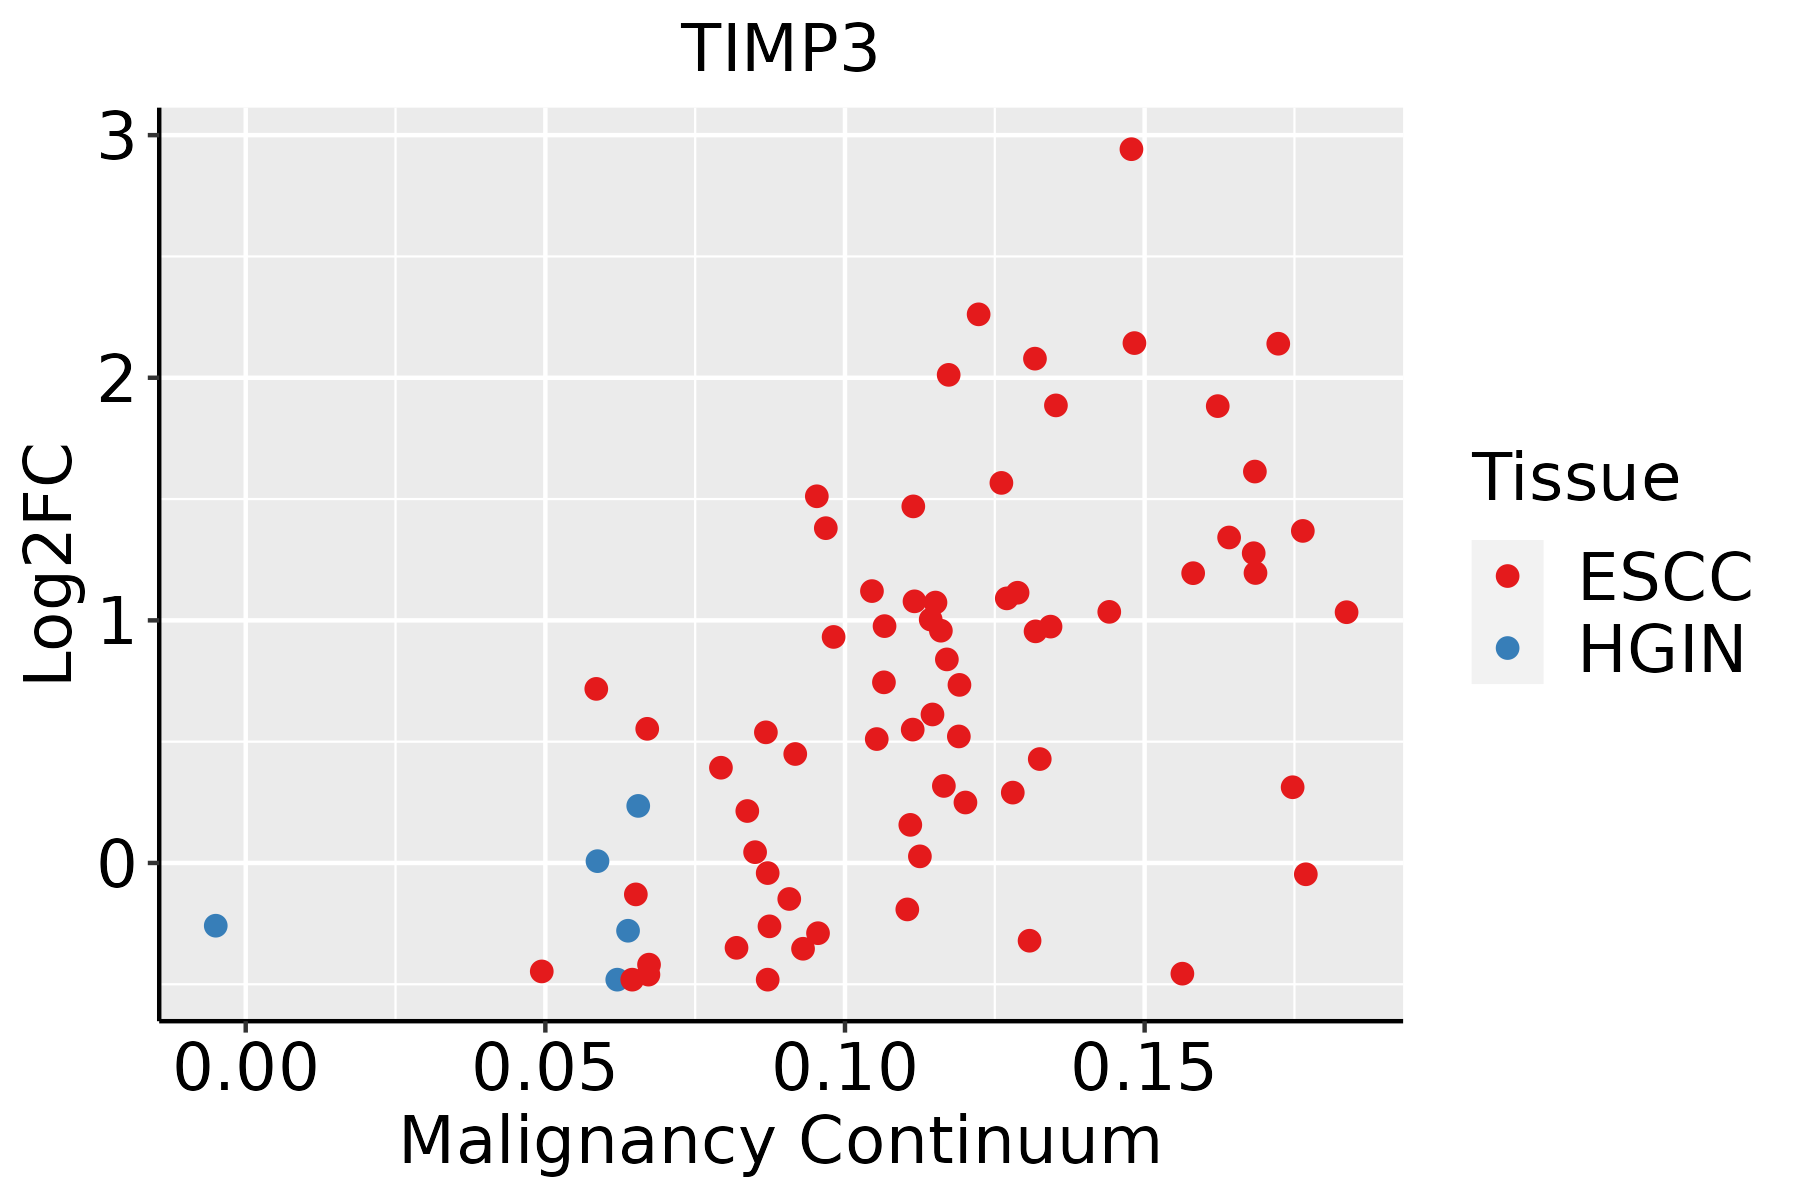 | ESCC: Esophageal squamous cell carcinoma |
| HGIN: High-grade intraepithelial neoplasias | ||
| LGIN: Low-grade intraepithelial neoplasias | ||
| Liver | 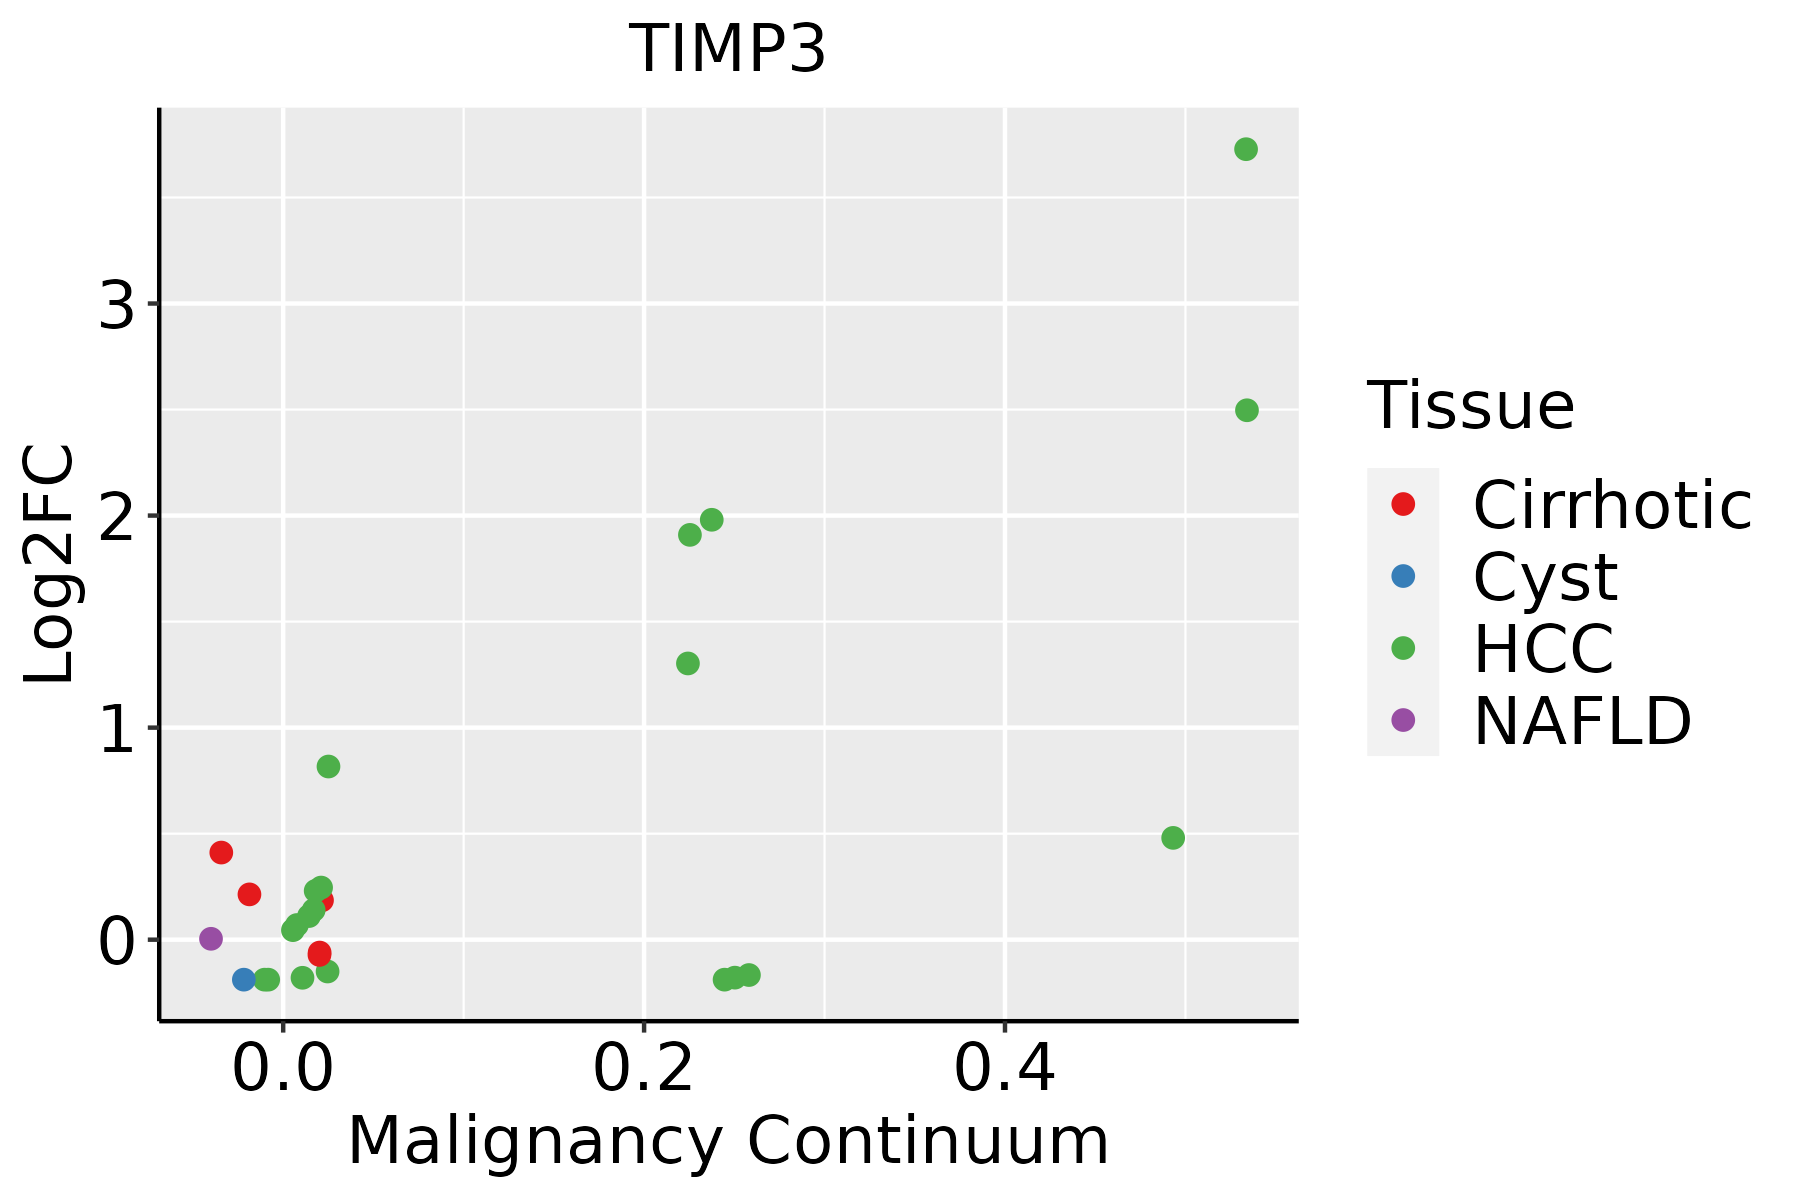 | HCC: Hepatocellular carcinoma |
| NAFLD: Non-alcoholic fatty liver disease | ||
| Lung | 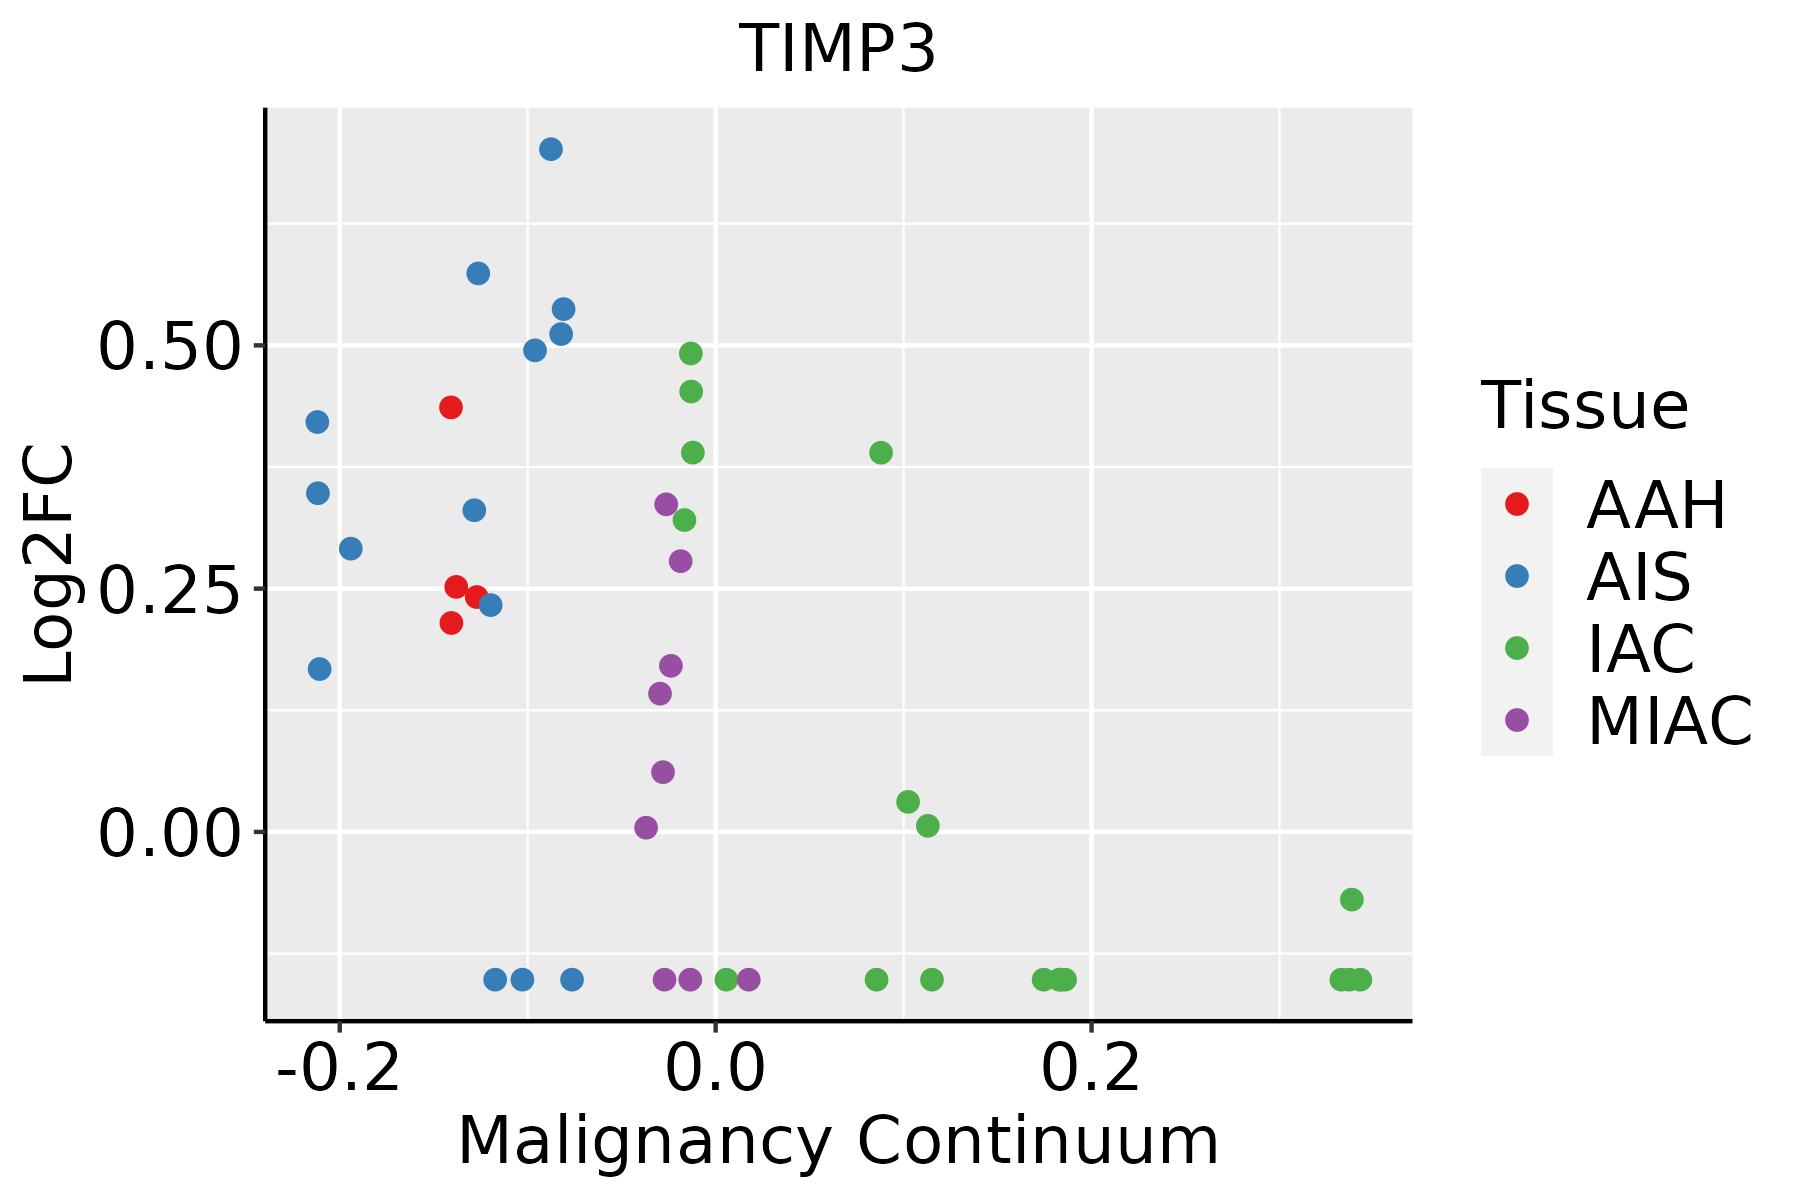 | AAH: Atypical adenomatous hyperplasia |
| AIS: Adenocarcinoma in situ | ||
| IAC: Invasive lung adenocarcinoma | ||
| MIA: Minimally invasive adenocarcinoma | ||
| Oral Cavity | 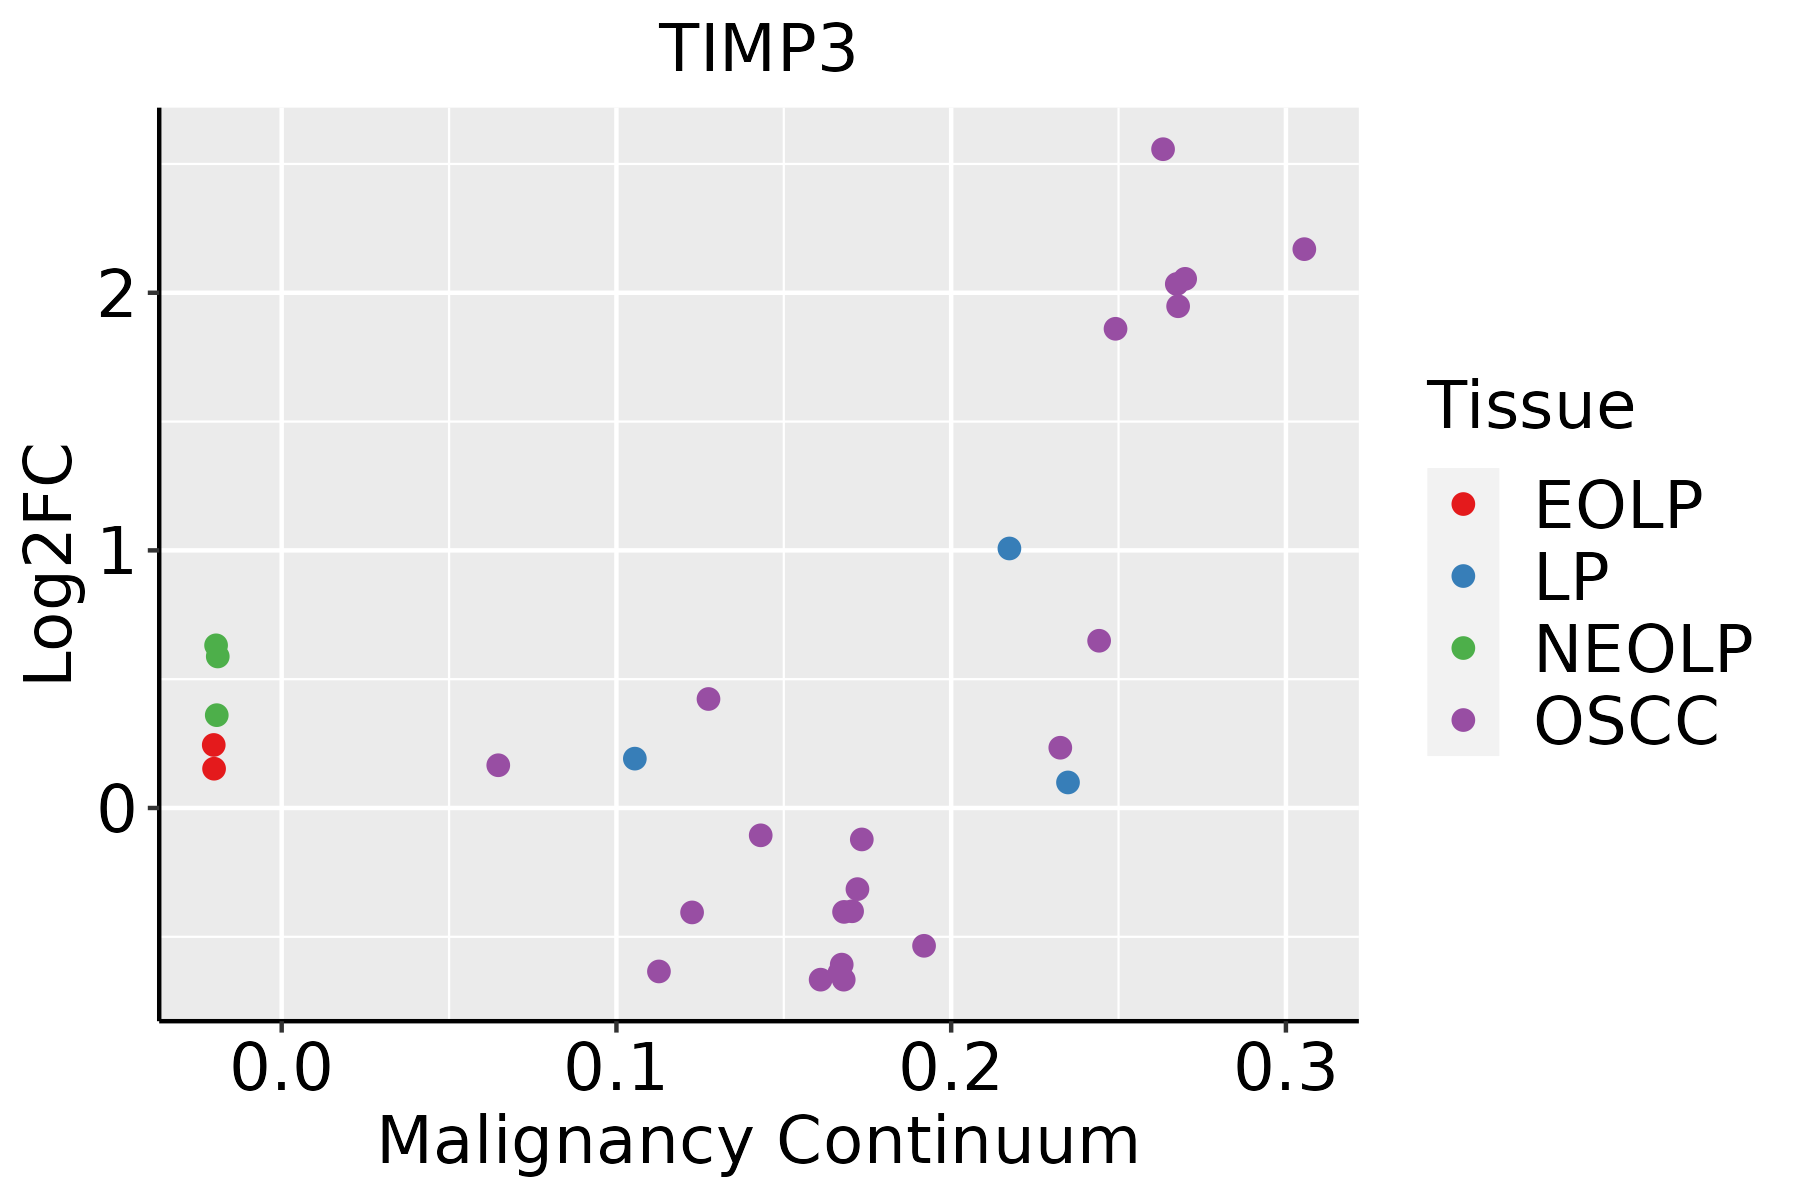 | EOLP: Erosive Oral lichen planus |
| LP: leukoplakia | ||
| NEOLP: Non-erosive oral lichen planus | ||
| OSCC: Oral squamous cell carcinoma | ||
| Prostate |  | BPH: Benign Prostatic Hyperplasia |
| Skin | 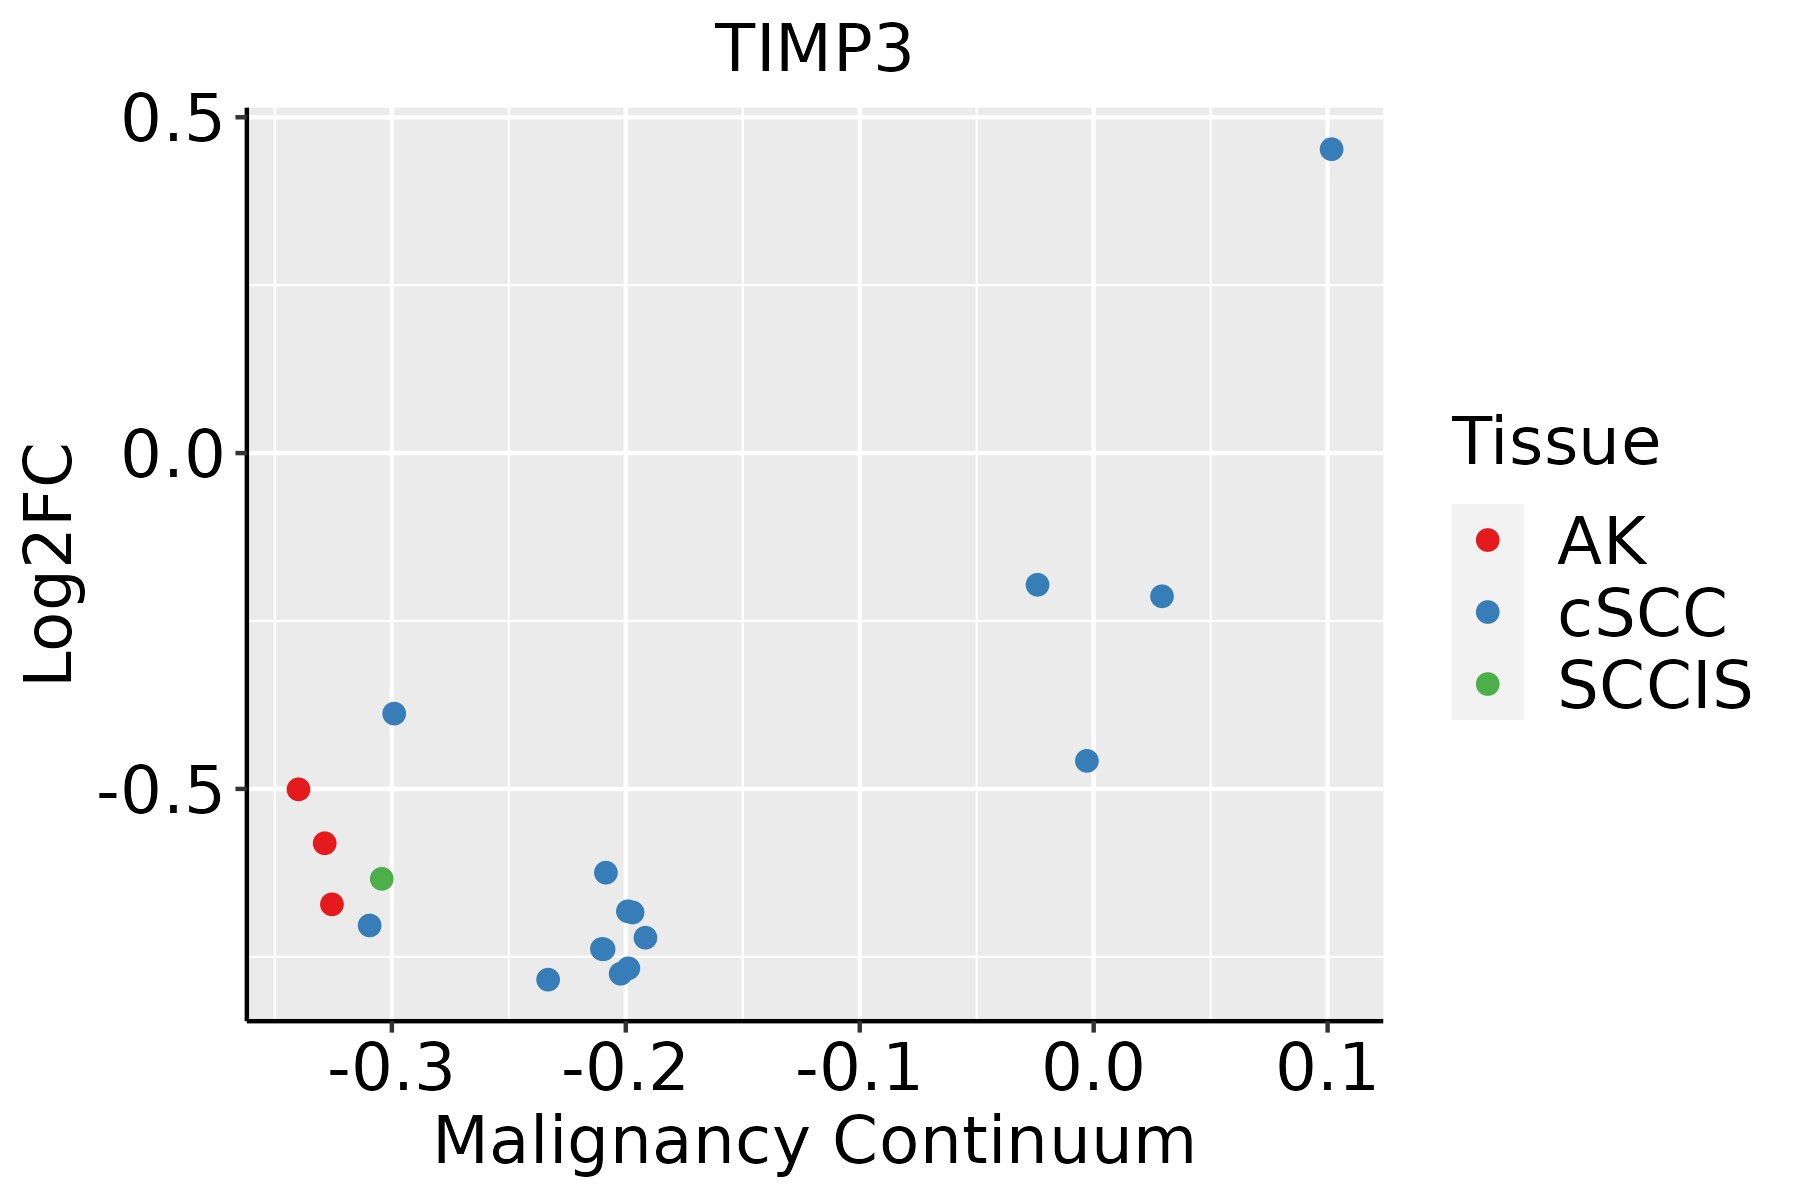 | AK: Actinic keratosis |
| cSCC: Cutaneous squamous cell carcinoma | ||
| SCCIS:squamous cell carcinoma in situ | ||
| Thyroid |  | ATC: Anaplastic thyroid cancer |
| HT: Hashimoto's thyroiditis | ||
| PTC: Papillary thyroid cancer |
| ∗log2FC in expression of this searched gene in stem-like cells from each diseased tissue sample relative to stem-like cells in normal samples in each tissue plotted against the malignancy continuum. Samples are colored based on if they are from different disease stage. |
Top |
Malignant transformation related pathway analysis |
| Find out the enriched GO biological processes and KEGG pathways involved in transition from healthy to precancer to cancer |
| Tissue | Disease Stage | Enriched GO biological Processes |
| Colorectum | AD |  |
| Colorectum | SER |  |
| Colorectum | MSS |  |
| Colorectum | MSI-H |  |
| Colorectum | FAP |  |
| ∗Top 15 enriched GO BP terms are showed in the bar plot of each disease state in each tissue. Each row represents a significant GO biological process which is colored according to the -log10(p.adjust). |
| Page: 1 2 3 4 5 6 7 8 9 |
| GO ID | Tissue | Disease Stage | Description | Gene Ratio | Bg Ratio | pvalue | p.adjust | Count |
| GO:200123314 | Breast | IDC | regulation of apoptotic signaling pathway | 82/1434 | 356/18723 | 6.27e-20 | 5.93e-17 | 82 |
| GO:005254714 | Breast | IDC | regulation of peptidase activity | 96/1434 | 461/18723 | 7.58e-20 | 6.15e-17 | 96 |
| GO:005254814 | Breast | IDC | regulation of endopeptidase activity | 88/1434 | 432/18723 | 1.20e-17 | 4.85e-15 | 88 |
| GO:004586114 | Breast | IDC | negative regulation of proteolysis | 70/1434 | 351/18723 | 8.21e-14 | 2.22e-11 | 70 |
| GO:005134613 | Breast | IDC | negative regulation of hydrolase activity | 71/1434 | 379/18723 | 1.33e-12 | 2.90e-10 | 71 |
| GO:001046613 | Breast | IDC | negative regulation of peptidase activity | 56/1434 | 262/18723 | 1.39e-12 | 2.92e-10 | 56 |
| GO:001095112 | Breast | IDC | negative regulation of endopeptidase activity | 52/1434 | 252/18723 | 3.53e-11 | 5.57e-09 | 52 |
| GO:200123514 | Breast | IDC | positive regulation of apoptotic signaling pathway | 31/1434 | 126/18723 | 4.13e-09 | 3.35e-07 | 31 |
| GO:004217614 | Breast | IDC | regulation of protein catabolic process | 63/1434 | 391/18723 | 1.32e-08 | 9.61e-07 | 63 |
| GO:009719114 | Breast | IDC | extrinsic apoptotic signaling pathway | 42/1434 | 219/18723 | 2.56e-08 | 1.73e-06 | 42 |
| GO:200123614 | Breast | IDC | regulation of extrinsic apoptotic signaling pathway | 32/1434 | 151/18723 | 1.07e-07 | 6.26e-06 | 32 |
| GO:20012385 | Breast | IDC | positive regulation of extrinsic apoptotic signaling pathway | 12/1434 | 48/18723 | 2.03e-04 | 3.32e-03 | 12 |
| GO:003133014 | Breast | IDC | negative regulation of cellular catabolic process | 37/1434 | 262/18723 | 2.20e-04 | 3.52e-03 | 37 |
| GO:00703713 | Breast | IDC | ERK1 and ERK2 cascade | 43/1434 | 330/18723 | 4.28e-04 | 5.84e-03 | 43 |
| GO:004217714 | Breast | IDC | negative regulation of protein catabolic process | 20/1434 | 121/18723 | 8.51e-04 | 9.92e-03 | 20 |
| GO:190204112 | Breast | IDC | regulation of extrinsic apoptotic signaling pathway via death domain receptors | 11/1434 | 49/18723 | 9.88e-04 | 1.11e-02 | 11 |
| GO:000989514 | Breast | IDC | negative regulation of catabolic process | 40/1434 | 320/18723 | 1.49e-03 | 1.50e-02 | 40 |
| GO:19020432 | Breast | IDC | positive regulation of extrinsic apoptotic signaling pathway via death domain receptors | 5/1434 | 13/18723 | 2.00e-03 | 1.90e-02 | 5 |
| GO:00703733 | Breast | IDC | negative regulation of ERK1 and ERK2 cascade | 14/1434 | 78/18723 | 2.21e-03 | 2.06e-02 | 14 |
| GO:00703722 | Breast | IDC | regulation of ERK1 and ERK2 cascade | 37/1434 | 309/18723 | 4.53e-03 | 3.49e-02 | 37 |
| Page: 1 2 3 4 5 6 7 8 9 10 11 12 13 14 15 16 17 18 |
| Pathway ID | Tissue | Disease Stage | Description | Gene Ratio | Bg Ratio | pvalue | p.adjust | qvalue | Count |
| hsa0520523 | Breast | IDC | Proteoglycans in cancer | 42/867 | 205/8465 | 7.69e-06 | 9.99e-05 | 7.48e-05 | 42 |
| hsa0520533 | Breast | IDC | Proteoglycans in cancer | 42/867 | 205/8465 | 7.69e-06 | 9.99e-05 | 7.48e-05 | 42 |
| hsa0520542 | Breast | DCIS | Proteoglycans in cancer | 39/846 | 205/8465 | 5.36e-05 | 5.58e-04 | 4.11e-04 | 39 |
| hsa0520552 | Breast | DCIS | Proteoglycans in cancer | 39/846 | 205/8465 | 5.36e-05 | 5.58e-04 | 4.11e-04 | 39 |
| hsa0520529 | Esophagus | ESCC | Proteoglycans in cancer | 138/4205 | 205/8465 | 1.79e-07 | 1.40e-06 | 7.15e-07 | 138 |
| hsa0520537 | Esophagus | ESCC | Proteoglycans in cancer | 138/4205 | 205/8465 | 1.79e-07 | 1.40e-06 | 7.15e-07 | 138 |
| hsa0520510 | Liver | Cirrhotic | Proteoglycans in cancer | 85/2530 | 205/8465 | 2.37e-04 | 1.58e-03 | 9.75e-04 | 85 |
| hsa0520511 | Liver | Cirrhotic | Proteoglycans in cancer | 85/2530 | 205/8465 | 2.37e-04 | 1.58e-03 | 9.75e-04 | 85 |
| hsa0520521 | Liver | HCC | Proteoglycans in cancer | 121/4020 | 205/8465 | 5.22e-04 | 2.18e-03 | 1.21e-03 | 121 |
| hsa0520531 | Liver | HCC | Proteoglycans in cancer | 121/4020 | 205/8465 | 5.22e-04 | 2.18e-03 | 1.21e-03 | 121 |
| hsa0520512 | Lung | IAC | Proteoglycans in cancer | 53/1053 | 205/8465 | 9.47e-08 | 6.16e-06 | 4.09e-06 | 53 |
| hsa0520513 | Lung | IAC | Proteoglycans in cancer | 53/1053 | 205/8465 | 9.47e-08 | 6.16e-06 | 4.09e-06 | 53 |
| hsa0520522 | Lung | AIS | Proteoglycans in cancer | 52/961 | 205/8465 | 1.16e-08 | 5.38e-07 | 3.44e-07 | 52 |
| hsa0520532 | Lung | AIS | Proteoglycans in cancer | 52/961 | 205/8465 | 1.16e-08 | 5.38e-07 | 3.44e-07 | 52 |
| hsa0520526 | Oral cavity | OSCC | Proteoglycans in cancer | 128/3704 | 205/8465 | 4.00e-08 | 3.12e-07 | 1.59e-07 | 128 |
| hsa05205111 | Oral cavity | OSCC | Proteoglycans in cancer | 128/3704 | 205/8465 | 4.00e-08 | 3.12e-07 | 1.59e-07 | 128 |
| hsa0520562 | Oral cavity | NEOLP | Proteoglycans in cancer | 56/1112 | 205/8465 | 3.49e-08 | 5.85e-07 | 3.68e-07 | 56 |
| hsa0520572 | Oral cavity | NEOLP | Proteoglycans in cancer | 56/1112 | 205/8465 | 3.49e-08 | 5.85e-07 | 3.68e-07 | 56 |
| hsa0520520 | Prostate | BPH | Proteoglycans in cancer | 72/1718 | 205/8465 | 4.16e-07 | 4.10e-06 | 2.54e-06 | 72 |
| hsa05205110 | Prostate | BPH | Proteoglycans in cancer | 72/1718 | 205/8465 | 4.16e-07 | 4.10e-06 | 2.54e-06 | 72 |
| Page: 1 2 |
Top |
Cell-cell communication analysis |
| Identification of potential cell-cell interactions between two cell types and their ligand-receptor pairs for different disease states |
| Ligand | Receptor | LRpair | Pathway | Tissue | Disease Stage |
| Page: 1 |
Top |
Single-cell gene regulatory network inference analysis |
| Find out the significant the regulons (TFs) and the target genes of each regulon across cell types for different disease states |
| TF | Cell Type | Tissue | Disease Stage | Target Gene | RSS | Regulon Activity |
| ∗The dot plots of a searched regulon are shown for all cell subpopulations in each disease state of each tissue based on the regulon specific score inferred using pySCENIC and by calculating the average expression. |
| Page: 1 |
Top |
Somatic mutation of malignant transformation related genes |
| Annotation of somatic variants for genes involved in malignant transformation |
| Hugo Symbol | Variant Class | Variant Classification | dbSNP RS | HGVSc | HGVSp | HGVSp Short | SWISSPROT | BIOTYPE | SIFT | PolyPhen | Tumor Sample Barcode | Tissue | Histology | Sex | Age | Stage | Therapy Types | Drugs | Outcome |
| TIMP3 | SNV | Missense_Mutation | novel | c.308T>C | p.Leu103Pro | p.L103P | P35625 | protein_coding | deleterious(0) | probably_damaging(0.999) | TCGA-A2-A3XY-01 | Breast | breast invasive carcinoma | Female | <65 | I/II | Chemotherapy | adriamycin | PD |
| TIMP3 | SNV | Missense_Mutation | c.504N>A | p.Met168Ile | p.M168I | P35625 | protein_coding | deleterious(0.02) | benign(0.041) | TCGA-A8-A09Z-01 | Breast | breast invasive carcinoma | Female | >=65 | I/II | Unknown | Unknown | SD | |
| TIMP3 | SNV | Missense_Mutation | c.441C>G | p.Ile147Met | p.I147M | P35625 | protein_coding | deleterious(0) | possibly_damaging(0.761) | TCGA-EA-A97N-01 | Cervix | cervical & endocervical cancer | Female | <65 | I/II | Unknown | Unknown | SD | |
| TIMP3 | SNV | Missense_Mutation | c.421C>A | p.Leu141Met | p.L141M | P35625 | protein_coding | tolerated(1) | probably_damaging(0.994) | TCGA-AA-3672-01 | Colorectum | colon adenocarcinoma | Female | >=65 | III/IV | Unknown | Unknown | SD | |
| TIMP3 | SNV | Missense_Mutation | novel | c.241N>C | p.Tyr81His | p.Y81H | P35625 | protein_coding | tolerated(0.3) | benign(0.015) | TCGA-AA-3950-01 | Colorectum | colon adenocarcinoma | Female | >=65 | I/II | Unknown | Unknown | SD |
| TIMP3 | SNV | Missense_Mutation | c.319N>T | p.Arg107Cys | p.R107C | P35625 | protein_coding | deleterious(0) | probably_damaging(0.996) | TCGA-AA-A010-01 | Colorectum | colon adenocarcinoma | Female | <65 | I/II | Chemotherapy | folinic | CR | |
| TIMP3 | SNV | Missense_Mutation | rs773990898 | c.517G>A | p.Gly173Ser | p.G173S | P35625 | protein_coding | tolerated(0.68) | probably_damaging(0.985) | TCGA-AY-6197-01 | Colorectum | colon adenocarcinoma | Male | <65 | I/II | Unknown | Unknown | SD |
| TIMP3 | SNV | Missense_Mutation | c.151N>A | p.Leu51Met | p.L51M | P35625 | protein_coding | tolerated(0.26) | possibly_damaging(0.769) | TCGA-AZ-6601-01 | Colorectum | colon adenocarcinoma | Male | >=65 | I/II | Unknown | Unknown | PD | |
| TIMP3 | SNV | Missense_Mutation | novel | c.313N>C | p.Thr105Pro | p.T105P | P35625 | protein_coding | deleterious(0) | probably_damaging(0.997) | TCGA-CA-6717-01 | Colorectum | colon adenocarcinoma | Male | <65 | I/II | Chemotherapy | oxaliplatin | CR |
| TIMP3 | SNV | Missense_Mutation | rs1804709 | c.628G>T | p.Asp210Tyr | p.D210Y | P35625 | protein_coding | deleterious(0) | probably_damaging(0.97) | TCGA-AG-A002-01 | Colorectum | rectum adenocarcinoma | Male | <65 | I/II | Unknown | Unknown | SD |
| Page: 1 2 3 4 5 |
Top |
Related drugs of malignant transformation related genes |
| Identification of chemicals and drugs interact with genes involved in malignant transfromation |
| (DGIdb 4.0) |
| Entrez ID | Symbol | Category | Interaction Types | Drug Claim Name | Drug Name | PMIDs |
| Page: 1 |

Copyright 2023-Present -The University of Texas Health Science Center at Houston |