
|
|||||
|
 | |
| |
| |
| |
| |
| |
|
Gene: TIMP2 |
Gene summary for TIMP2 |
| Gene information | Species | Human | Gene symbol | TIMP2 | Gene ID | 7077 |
| Gene name | TIMP metallopeptidase inhibitor 2 | |
| Gene Alias | CSC-21K | |
| Cytomap | 17q25.3 | |
| Gene Type | protein-coding | GO ID | GO:0000165 | UniProtAcc | A0A140VK57 |
Top |
Malignant transformation analysis |
| Identification of the aberrant gene expression in precancerous and cancerous lesions by comparing the gene expression of stem-like cells in diseased tissues with normal stem cells |
| Entrez ID | Symbol | Replicates | Species | Organ | Tissue | Adj P-value | Log2FC | Malignancy |
| 7077 | TIMP2 | AEH-subject1 | Human | Endometrium | AEH | 5.06e-04 | -2.91e-01 | -0.3059 |
| 7077 | TIMP2 | AEH-subject2 | Human | Endometrium | AEH | 1.38e-05 | -3.56e-01 | -0.2525 |
| 7077 | TIMP2 | AEH-subject3 | Human | Endometrium | AEH | 1.81e-18 | -4.79e-01 | -0.2576 |
| 7077 | TIMP2 | AEH-subject5 | Human | Endometrium | AEH | 9.25e-34 | -5.79e-01 | -0.2953 |
| 7077 | TIMP2 | EEC-subject1 | Human | Endometrium | EEC | 3.71e-15 | -4.64e-01 | -0.2682 |
| 7077 | TIMP2 | EEC-subject2 | Human | Endometrium | EEC | 1.75e-23 | -5.19e-01 | -0.2607 |
| 7077 | TIMP2 | EEC-subject3 | Human | Endometrium | EEC | 3.62e-26 | -4.85e-01 | -0.2525 |
| 7077 | TIMP2 | EEC-subject4 | Human | Endometrium | EEC | 4.19e-19 | -4.62e-01 | -0.2571 |
| 7077 | TIMP2 | EEC-subject5 | Human | Endometrium | EEC | 1.95e-03 | -2.80e-01 | -0.249 |
| 7077 | TIMP2 | GSM5276935 | Human | Endometrium | EEC | 2.03e-04 | -3.31e-01 | -0.123 |
| 7077 | TIMP2 | GSM6177620_NYU_UCEC1_lib1_lib1 | Human | Endometrium | EEC | 1.83e-21 | -5.80e-01 | -0.1869 |
| 7077 | TIMP2 | GSM6177620_NYU_UCEC1_lib2_lib2 | Human | Endometrium | EEC | 1.48e-15 | -5.35e-01 | -0.1875 |
| 7077 | TIMP2 | GSM6177620_NYU_UCEC1_lib3_lib3 | Human | Endometrium | EEC | 2.60e-23 | -5.56e-01 | -0.1883 |
| 7077 | TIMP2 | GSM6177621_NYU_UCEC2_lib1_lib1 | Human | Endometrium | EEC | 1.53e-10 | -1.56e-01 | -0.1934 |
| 7077 | TIMP2 | GSM6177622_NYU_UCEC3_lib1_lib1 | Human | Endometrium | EEC | 8.53e-30 | -3.78e-01 | -0.1917 |
| 7077 | TIMP2 | GSM6177622_NYU_UCEC3_lib2_lib2 | Human | Endometrium | EEC | 1.86e-24 | -5.06e-01 | -0.1916 |
| 7077 | TIMP2 | P2T-E | Human | Esophagus | ESCC | 7.14e-19 | 5.16e-02 | 0.1177 |
| 7077 | TIMP2 | P4T-E | Human | Esophagus | ESCC | 3.00e-03 | 7.68e-01 | 0.1323 |
| 7077 | TIMP2 | P9T-E | Human | Esophagus | ESCC | 8.33e-05 | 8.98e-01 | 0.1131 |
| 7077 | TIMP2 | P10T-E | Human | Esophagus | ESCC | 1.71e-02 | 3.02e-01 | 0.116 |
| Page: 1 2 3 4 5 |
| Tissue | Expression Dynamics | Abbreviation |
| Endometrium |  | AEH: Atypical endometrial hyperplasia |
| EEC: Endometrioid Cancer | ||
| Esophagus |  | ESCC: Esophageal squamous cell carcinoma |
| HGIN: High-grade intraepithelial neoplasias | ||
| LGIN: Low-grade intraepithelial neoplasias | ||
| Liver | 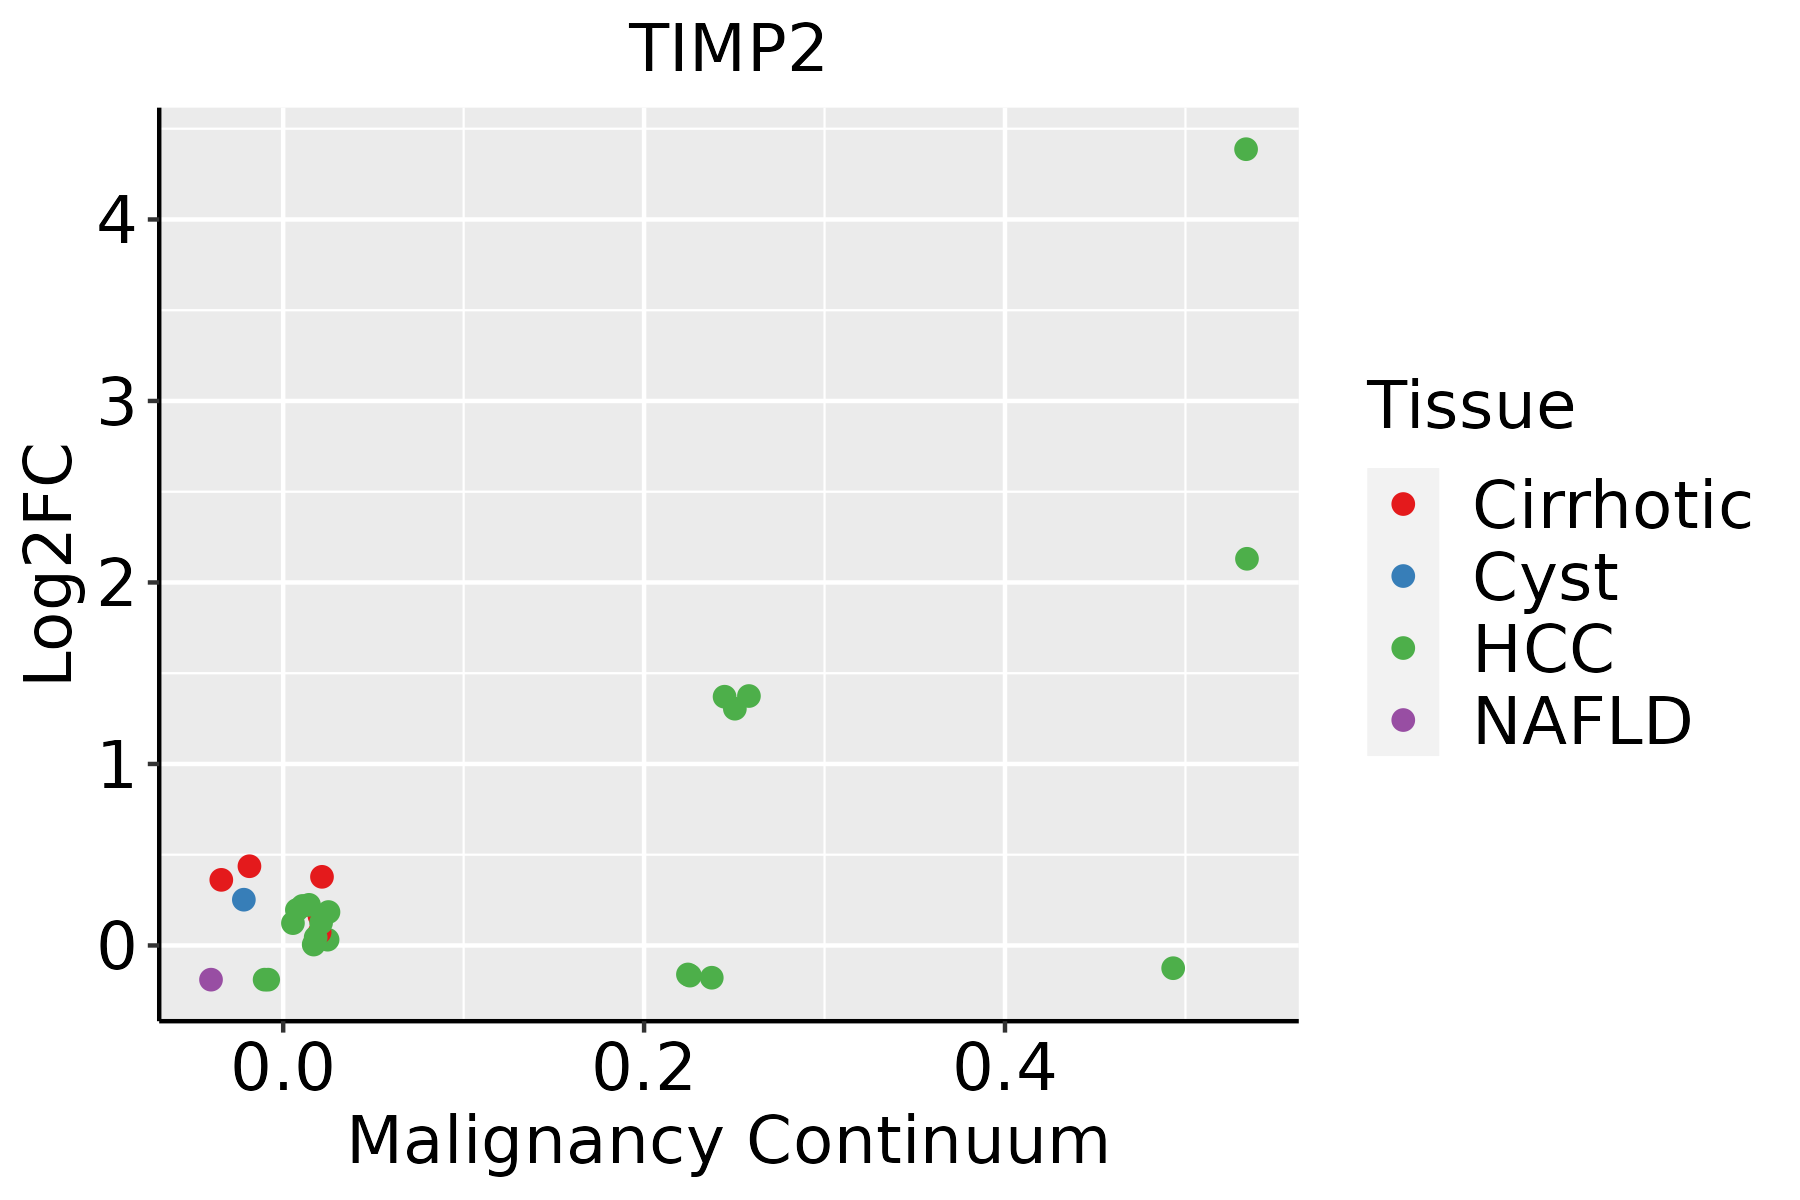 | HCC: Hepatocellular carcinoma |
| NAFLD: Non-alcoholic fatty liver disease | ||
| Skin | 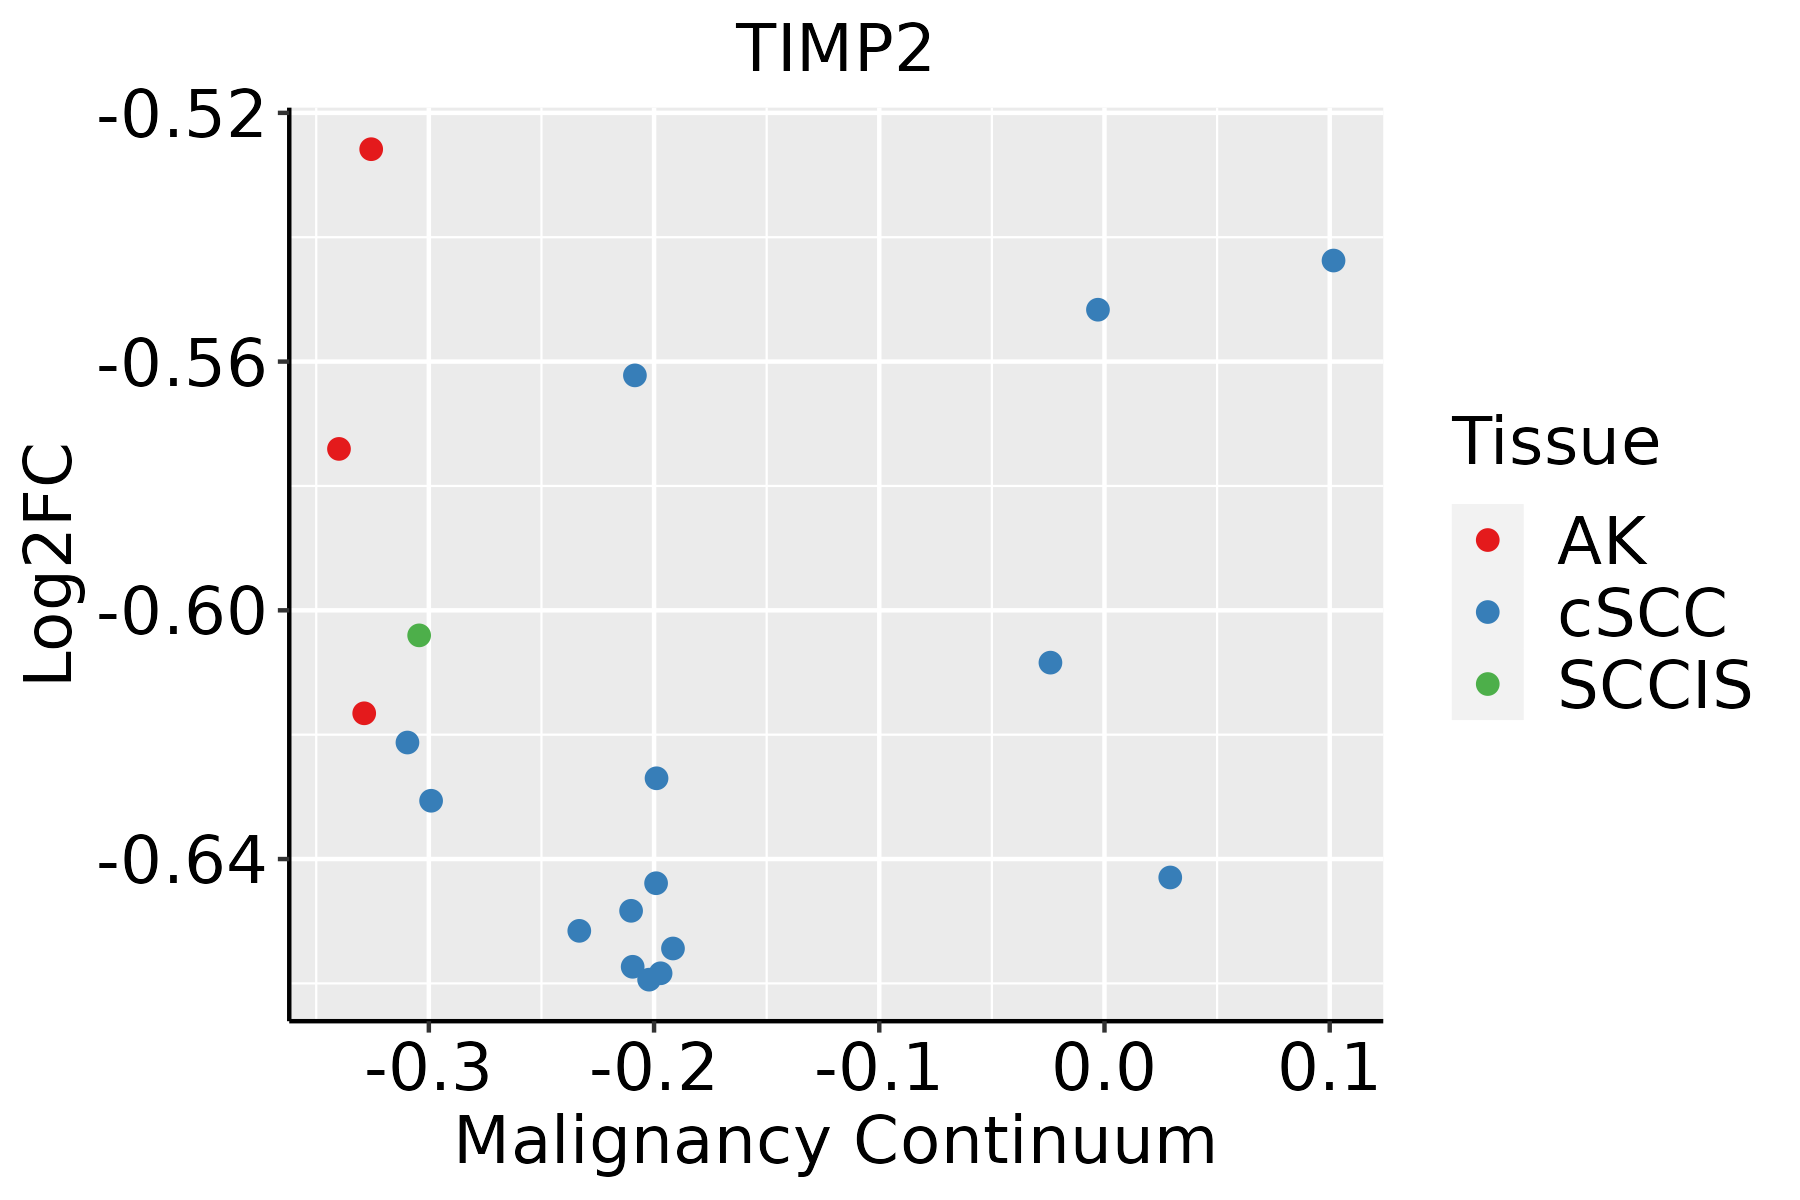 | AK: Actinic keratosis |
| cSCC: Cutaneous squamous cell carcinoma | ||
| SCCIS:squamous cell carcinoma in situ | ||
| Thyroid |  | ATC: Anaplastic thyroid cancer |
| HT: Hashimoto's thyroiditis | ||
| PTC: Papillary thyroid cancer |
| ∗log2FC in expression of this searched gene in stem-like cells from each diseased tissue sample relative to stem-like cells in normal samples in each tissue plotted against the malignancy continuum. Samples are colored based on if they are from different disease stage. |
Top |
Malignant transformation related pathway analysis |
| Find out the enriched GO biological processes and KEGG pathways involved in transition from healthy to precancer to cancer |
| Tissue | Disease Stage | Enriched GO biological Processes |
| Colorectum | AD |  |
| Colorectum | SER |  |
| Colorectum | MSS |  |
| Colorectum | MSI-H |  |
| Colorectum | FAP |  |
| ∗Top 15 enriched GO BP terms are showed in the bar plot of each disease state in each tissue. Each row represents a significant GO biological process which is colored according to the -log10(p.adjust). |
| Page: 1 2 3 4 5 6 7 8 9 |
| GO ID | Tissue | Disease Stage | Description | Gene Ratio | Bg Ratio | pvalue | p.adjust | Count |
| GO:004217616 | Endometrium | AEH | regulation of protein catabolic process | 100/2100 | 391/18723 | 9.58e-16 | 3.59e-13 | 100 |
| GO:004217715 | Endometrium | AEH | negative regulation of protein catabolic process | 34/2100 | 121/18723 | 2.67e-07 | 1.17e-05 | 34 |
| GO:005254716 | Endometrium | AEH | regulation of peptidase activity | 85/2100 | 461/18723 | 2.47e-06 | 7.11e-05 | 85 |
| GO:003133016 | Endometrium | AEH | negative regulation of cellular catabolic process | 53/2100 | 262/18723 | 1.40e-05 | 2.99e-04 | 53 |
| GO:00510567 | Endometrium | AEH | regulation of small GTPase mediated signal transduction | 59/2100 | 302/18723 | 1.43e-05 | 3.03e-04 | 59 |
| GO:00434105 | Endometrium | AEH | positive regulation of MAPK cascade | 84/2100 | 480/18723 | 2.19e-05 | 4.25e-04 | 84 |
| GO:00072657 | Endometrium | AEH | Ras protein signal transduction | 63/2100 | 337/18723 | 3.09e-05 | 5.66e-04 | 63 |
| GO:000989515 | Endometrium | AEH | negative regulation of catabolic process | 60/2100 | 320/18723 | 4.32e-05 | 7.28e-04 | 60 |
| GO:005254816 | Endometrium | AEH | regulation of endopeptidase activity | 76/2100 | 432/18723 | 4.42e-05 | 7.43e-04 | 76 |
| GO:004586116 | Endometrium | AEH | negative regulation of proteolysis | 63/2100 | 351/18723 | 1.07e-04 | 1.53e-03 | 63 |
| GO:005134610 | Endometrium | AEH | negative regulation of hydrolase activity | 65/2100 | 379/18723 | 3.18e-04 | 3.57e-03 | 65 |
| GO:000756810 | Endometrium | AEH | aging | 59/2100 | 339/18723 | 4.00e-04 | 4.28e-03 | 59 |
| GO:00465786 | Endometrium | AEH | regulation of Ras protein signal transduction | 36/2100 | 189/18723 | 1.01e-03 | 8.97e-03 | 36 |
| GO:000941010 | Endometrium | AEH | response to xenobiotic stimulus | 71/2100 | 462/18723 | 3.66e-03 | 2.50e-02 | 71 |
| GO:001046610 | Endometrium | AEH | negative regulation of peptidase activity | 43/2100 | 262/18723 | 6.78e-03 | 3.95e-02 | 43 |
| GO:004217617 | Endometrium | EEC | regulation of protein catabolic process | 103/2168 | 391/18723 | 3.54e-16 | 1.52e-13 | 103 |
| GO:004217716 | Endometrium | EEC | negative regulation of protein catabolic process | 35/2168 | 121/18723 | 1.79e-07 | 8.20e-06 | 35 |
| GO:005254717 | Endometrium | EEC | regulation of peptidase activity | 91/2168 | 461/18723 | 2.00e-07 | 8.93e-06 | 91 |
| GO:004586117 | Endometrium | EEC | negative regulation of proteolysis | 72/2168 | 351/18723 | 8.46e-07 | 2.98e-05 | 72 |
| GO:005254817 | Endometrium | EEC | regulation of endopeptidase activity | 82/2168 | 432/18723 | 3.96e-06 | 1.04e-04 | 82 |
| Page: 1 2 3 4 5 6 7 8 9 10 11 |
| Pathway ID | Tissue | Disease Stage | Description | Gene Ratio | Bg Ratio | pvalue | p.adjust | qvalue | Count |
| Page: 1 |
Top |
Cell-cell communication analysis |
| Identification of potential cell-cell interactions between two cell types and their ligand-receptor pairs for different disease states |
| Ligand | Receptor | LRpair | Pathway | Tissue | Disease Stage |
| Page: 1 |
Top |
Single-cell gene regulatory network inference analysis |
| Find out the significant the regulons (TFs) and the target genes of each regulon across cell types for different disease states |
| TF | Cell Type | Tissue | Disease Stage | Target Gene | RSS | Regulon Activity |
| ∗The dot plots of a searched regulon are shown for all cell subpopulations in each disease state of each tissue based on the regulon specific score inferred using pySCENIC and by calculating the average expression. |
| Page: 1 |
Top |
Somatic mutation of malignant transformation related genes |
| Annotation of somatic variants for genes involved in malignant transformation |
| Hugo Symbol | Variant Class | Variant Classification | dbSNP RS | HGVSc | HGVSp | HGVSp Short | SWISSPROT | BIOTYPE | SIFT | PolyPhen | Tumor Sample Barcode | Tissue | Histology | Sex | Age | Stage | Therapy Types | Drugs | Outcome |
| TIMP2 | SNV | Missense_Mutation | novel | c.146N>T | p.Ala49Val | p.A49V | P16035 | protein_coding | tolerated(1) | benign(0.007) | TCGA-2W-A8YY-01 | Cervix | cervical & endocervical cancer | Female | <65 | I/II | Chemotherapy | cisplatin | CR |
| TIMP2 | SNV | Missense_Mutation | rs368947971 | c.302C>T | p.Ser101Leu | p.S101L | P16035 | protein_coding | tolerated(0.17) | benign(0.194) | TCGA-IR-A3LH-01 | Cervix | cervical & endocervical cancer | Female | <65 | I/II | Chemotherapy | cisplatin | CR |
| TIMP2 | SNV | Missense_Mutation | c.506N>A | p.Pro169Gln | p.P169Q | P16035 | protein_coding | deleterious(0.04) | benign(0.149) | TCGA-VS-A950-01 | Cervix | cervical & endocervical cancer | Female | <65 | III/IV | Unknown | Unknown | SD | |
| TIMP2 | SNV | Missense_Mutation | rs201845164 | c.619G>A | p.Ala207Thr | p.A207T | P16035 | protein_coding | tolerated(0.49) | benign(0) | TCGA-AA-A01R-01 | Colorectum | colon adenocarcinoma | Male | <65 | III/IV | Chemotherapy | 5-fluorouracil | PD |
| TIMP2 | SNV | Missense_Mutation | c.620C>T | p.Ala207Val | p.A207V | P16035 | protein_coding | tolerated(0.61) | benign(0) | TCGA-DM-A1D4-01 | Colorectum | colon adenocarcinoma | Male | >=65 | I/II | Unknown | Unknown | PD | |
| TIMP2 | SNV | Missense_Mutation | novel | c.224N>C | p.Gln75Pro | p.Q75P | P16035 | protein_coding | deleterious(0.02) | probably_damaging(0.999) | TCGA-AG-A014-01 | Colorectum | rectum adenocarcinoma | Male | >=65 | I/II | Unknown | Unknown | SD |
| TIMP2 | deletion | Frame_Shift_Del | novel | c.630delC | p.Lys211SerfsTer34 | p.K211Sfs*34 | P16035 | protein_coding | TCGA-5M-AAT6-01 | Colorectum | colon adenocarcinoma | Female | <65 | III/IV | Unknown | Unknown | PD | ||
| TIMP2 | SNV | Missense_Mutation | novel | c.249N>T | p.Glu83Asp | p.E83D | P16035 | protein_coding | tolerated(1) | benign(0) | TCGA-A5-A0G1-01 | Endometrium | uterine corpus endometrioid carcinoma | Female | >=65 | I/II | Unknown | Unknown | SD |
| TIMP2 | SNV | Missense_Mutation | novel | c.347N>T | p.Ala116Val | p.A116V | P16035 | protein_coding | tolerated(1) | benign(0.009) | TCGA-A5-A0G2-01 | Endometrium | uterine corpus endometrioid carcinoma | Female | <65 | III/IV | Unknown | Unknown | SD |
| TIMP2 | SNV | Missense_Mutation | novel | c.216N>T | p.Glu72Asp | p.E72D | P16035 | protein_coding | tolerated(0.3) | benign(0) | TCGA-A5-A0G2-01 | Endometrium | uterine corpus endometrioid carcinoma | Female | <65 | III/IV | Unknown | Unknown | SD |
| Page: 1 2 3 |
Top |
Related drugs of malignant transformation related genes |
| Identification of chemicals and drugs interact with genes involved in malignant transfromation |
| (DGIdb 4.0) |
| Entrez ID | Symbol | Category | Interaction Types | Drug Claim Name | Drug Name | PMIDs |
| Page: 1 |

Copyright 2023-Present -The University of Texas Health Science Center at Houston |