
|
|||||
|
 | |
| |
| |
| |
| |
| |
|
Gene: TIMP1 |
Gene summary for TIMP1 |
| Gene information | Species | Human | Gene symbol | TIMP1 | Gene ID | 7076 |
| Gene name | TIMP metallopeptidase inhibitor 1 | |
| Gene Alias | CLGI | |
| Cytomap | Xp11.3 | |
| Gene Type | protein-coding | GO ID | GO:0000003 | UniProtAcc | P01033 |
Top |
Malignant transformation analysis |
| Identification of the aberrant gene expression in precancerous and cancerous lesions by comparing the gene expression of stem-like cells in diseased tissues with normal stem cells |
| Entrez ID | Symbol | Replicates | Species | Organ | Tissue | Adj P-value | Log2FC | Malignancy |
| 7076 | TIMP1 | GSM4909281 | Human | Breast | IDC | 3.37e-16 | -5.41e-01 | 0.21 |
| 7076 | TIMP1 | GSM4909285 | Human | Breast | IDC | 8.38e-23 | -6.29e-01 | 0.21 |
| 7076 | TIMP1 | GSM4909286 | Human | Breast | IDC | 5.56e-29 | -6.51e-01 | 0.1081 |
| 7076 | TIMP1 | GSM4909293 | Human | Breast | IDC | 2.45e-09 | -4.23e-01 | 0.1581 |
| 7076 | TIMP1 | GSM4909294 | Human | Breast | IDC | 3.09e-21 | -5.51e-01 | 0.2022 |
| 7076 | TIMP1 | GSM4909296 | Human | Breast | IDC | 1.33e-14 | -4.02e-01 | 0.1524 |
| 7076 | TIMP1 | GSM4909297 | Human | Breast | IDC | 1.12e-07 | -1.03e-01 | 0.1517 |
| 7076 | TIMP1 | GSM4909298 | Human | Breast | IDC | 9.63e-14 | -5.19e-01 | 0.1551 |
| 7076 | TIMP1 | GSM4909299 | Human | Breast | IDC | 1.49e-06 | 4.33e-01 | 0.035 |
| 7076 | TIMP1 | GSM4909301 | Human | Breast | IDC | 9.11e-10 | 4.64e-01 | 0.1577 |
| 7076 | TIMP1 | GSM4909302 | Human | Breast | IDC | 3.45e-13 | 5.24e-01 | 0.1545 |
| 7076 | TIMP1 | GSM4909304 | Human | Breast | IDC | 5.61e-09 | 4.15e-01 | 0.1636 |
| 7076 | TIMP1 | GSM4909306 | Human | Breast | IDC | 4.11e-09 | 4.74e-01 | 0.1564 |
| 7076 | TIMP1 | GSM4909307 | Human | Breast | IDC | 1.15e-11 | 4.99e-01 | 0.1569 |
| 7076 | TIMP1 | GSM4909308 | Human | Breast | IDC | 6.22e-48 | 8.64e-01 | 0.158 |
| 7076 | TIMP1 | GSM4909311 | Human | Breast | IDC | 6.82e-23 | -8.36e-02 | 0.1534 |
| 7076 | TIMP1 | GSM4909312 | Human | Breast | IDC | 1.45e-07 | 2.62e-01 | 0.1552 |
| 7076 | TIMP1 | GSM4909313 | Human | Breast | IDC | 7.37e-03 | 2.57e-01 | 0.0391 |
| 7076 | TIMP1 | GSM4909315 | Human | Breast | IDC | 3.02e-21 | -5.93e-01 | 0.21 |
| 7076 | TIMP1 | GSM4909316 | Human | Breast | IDC | 3.90e-11 | -6.70e-01 | 0.21 |
| Page: 1 2 3 4 5 6 7 8 9 10 11 12 13 14 15 |
| Tissue | Expression Dynamics | Abbreviation |
| Breast |  | IDC: Invasive ductal carcinoma |
| DCIS: Ductal carcinoma in situ | ||
| Precancer(BRCA1-mut): Precancerous lesion from BRCA1 mutation carriers | ||
| Cervix |  | CC: Cervix cancer |
| HSIL_HPV: HPV-infected high-grade squamous intraepithelial lesions | ||
| N_HPV: HPV-infected normal cervix | ||
| Colorectum (GSE201348) |  | FAP: Familial adenomatous polyposis |
| CRC: Colorectal cancer | ||
| Colorectum (HTA11) |  | AD: Adenomas |
| SER: Sessile serrated lesions | ||
| MSI-H: Microsatellite-high colorectal cancer | ||
| MSS: Microsatellite stable colorectal cancer | ||
| Endometrium | 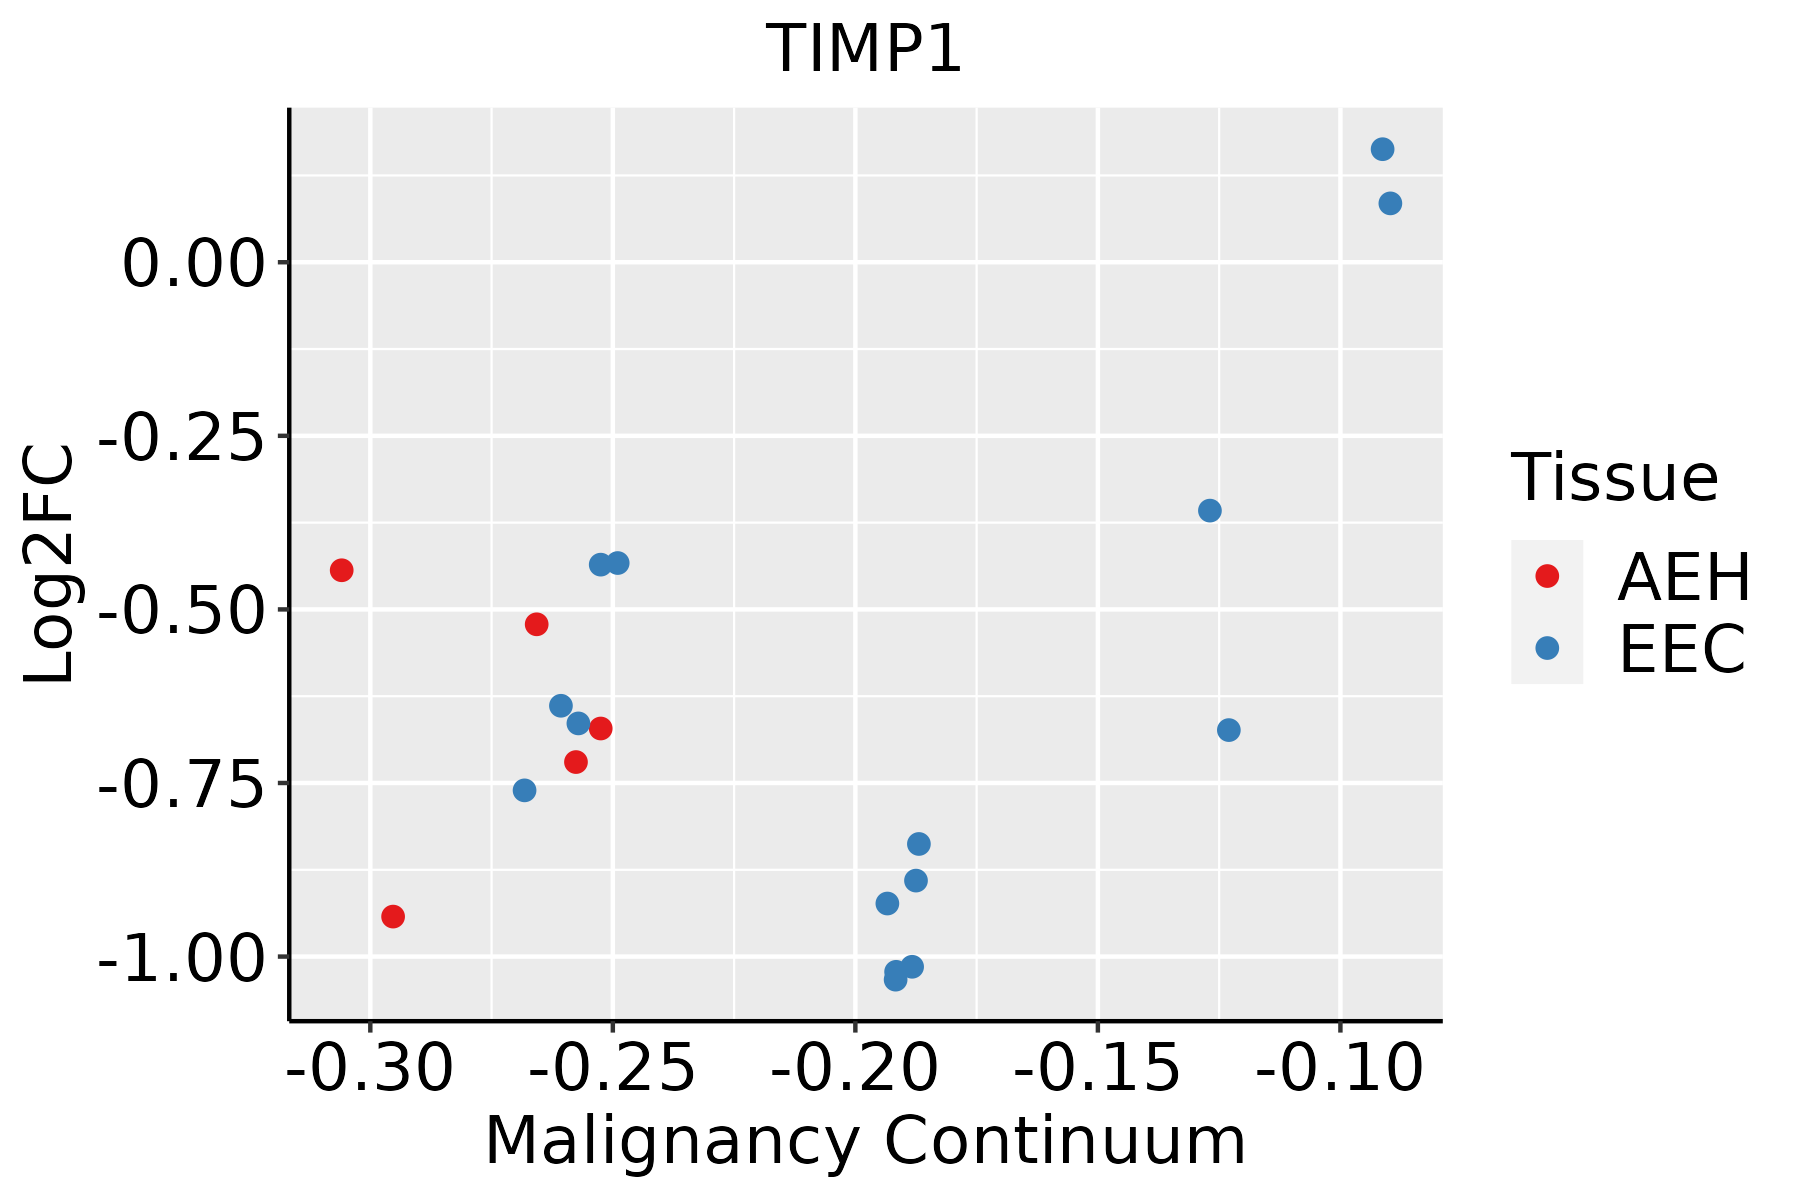 | AEH: Atypical endometrial hyperplasia |
| EEC: Endometrioid Cancer | ||
| Esophagus |  | ESCC: Esophageal squamous cell carcinoma |
| HGIN: High-grade intraepithelial neoplasias | ||
| LGIN: Low-grade intraepithelial neoplasias | ||
| GC | 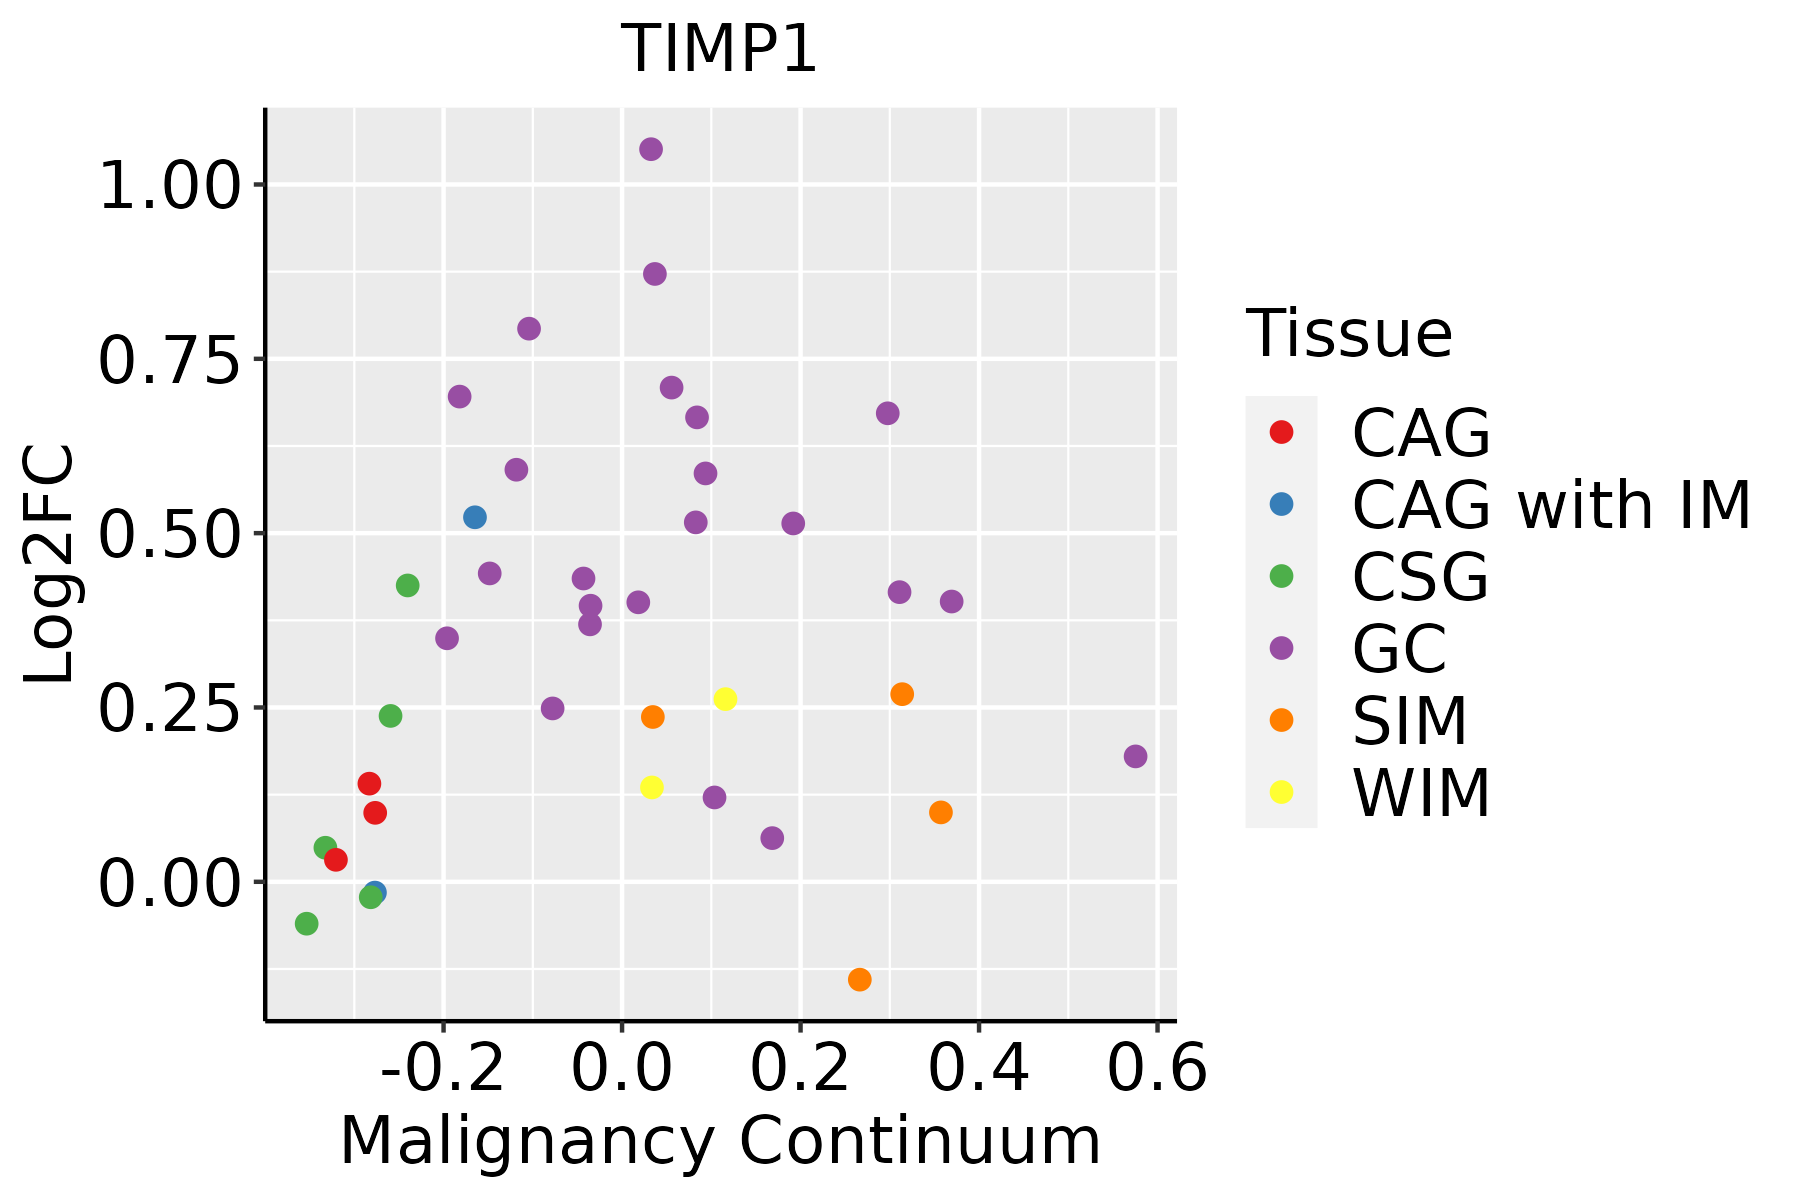 | CAG: Chronic atrophic gastritis |
| CAG with IM: Chronic atrophic gastritis with intestinal metaplasia | ||
| CSG: Chronic superficial gastritis | ||
| GC: Gastric cancer | ||
| SIM: Severe intestinal metaplasia | ||
| WIM: Wild intestinal metaplasia | ||
| Liver |  | HCC: Hepatocellular carcinoma |
| NAFLD: Non-alcoholic fatty liver disease | ||
| Lung |  | AAH: Atypical adenomatous hyperplasia |
| AIS: Adenocarcinoma in situ | ||
| IAC: Invasive lung adenocarcinoma | ||
| MIA: Minimally invasive adenocarcinoma | ||
| Oral Cavity |  | EOLP: Erosive Oral lichen planus |
| LP: leukoplakia | ||
| NEOLP: Non-erosive oral lichen planus | ||
| OSCC: Oral squamous cell carcinoma | ||
| Prostate |  | BPH: Benign Prostatic Hyperplasia |
| Skin | 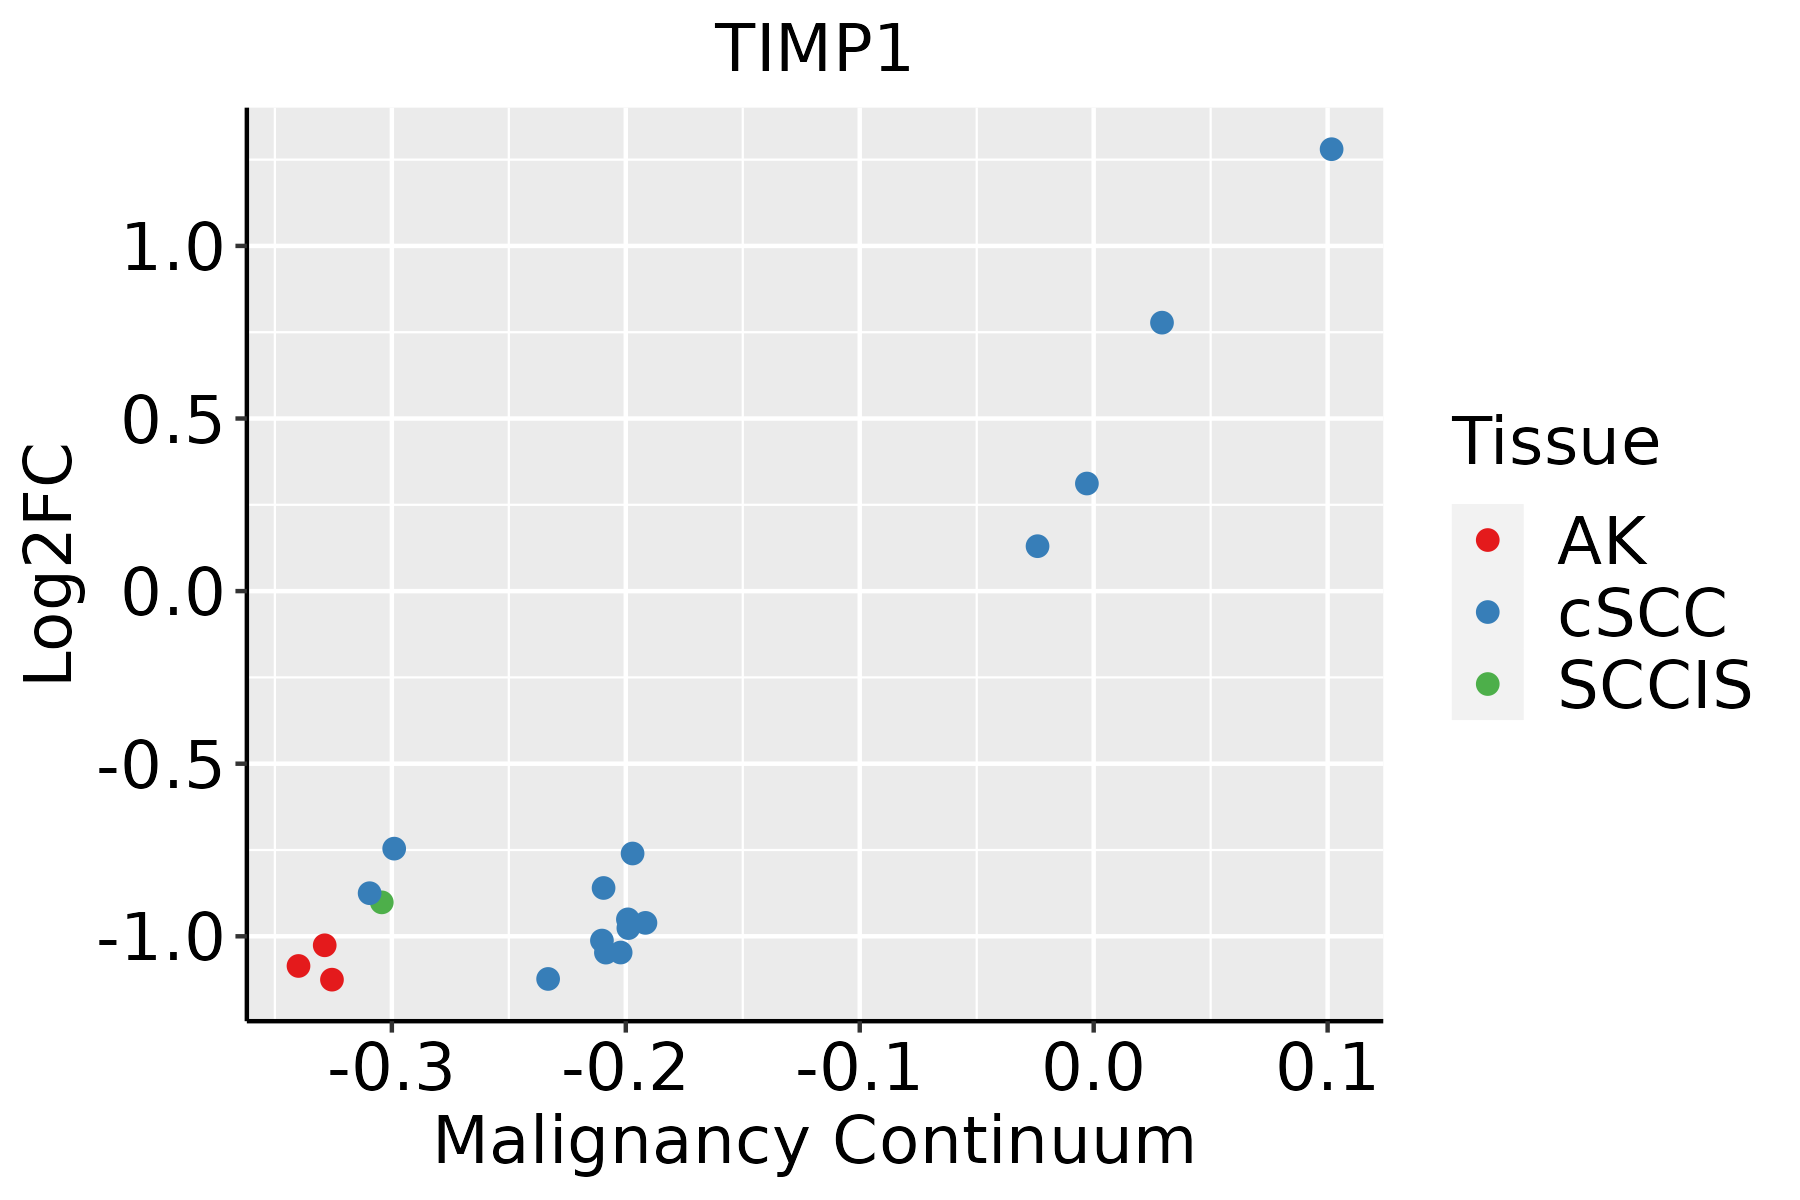 | AK: Actinic keratosis |
| cSCC: Cutaneous squamous cell carcinoma | ||
| SCCIS:squamous cell carcinoma in situ | ||
| Thyroid | 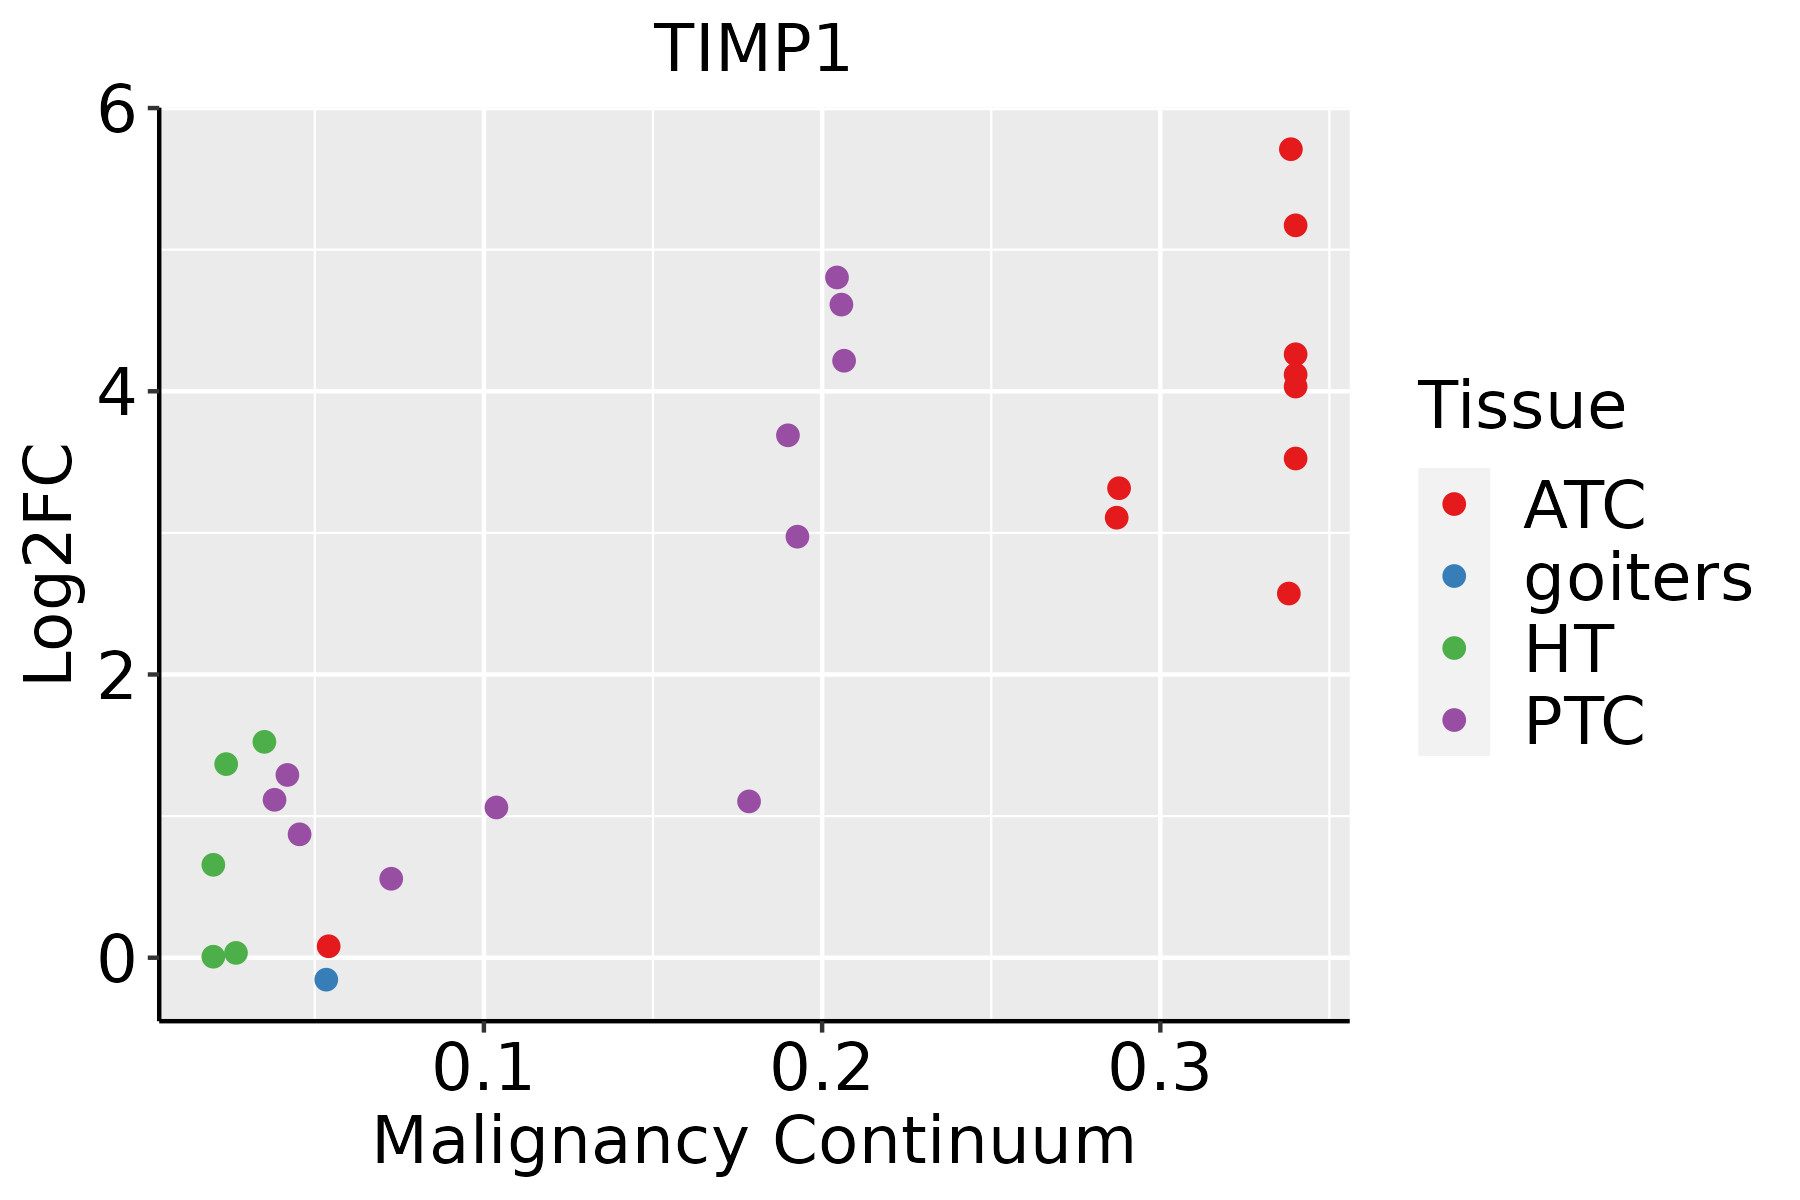 | ATC: Anaplastic thyroid cancer |
| HT: Hashimoto's thyroiditis | ||
| PTC: Papillary thyroid cancer |
| ∗log2FC in expression of this searched gene in stem-like cells from each diseased tissue sample relative to stem-like cells in normal samples in each tissue plotted against the malignancy continuum. Samples are colored based on if they are from different disease stage. |
Top |
Malignant transformation related pathway analysis |
| Find out the enriched GO biological processes and KEGG pathways involved in transition from healthy to precancer to cancer |
| Tissue | Disease Stage | Enriched GO biological Processes |
| Colorectum | AD |  |
| Colorectum | SER |  |
| Colorectum | MSS |  |
| Colorectum | MSI-H |  |
| Colorectum | FAP |  |
| ∗Top 15 enriched GO BP terms are showed in the bar plot of each disease state in each tissue. Each row represents a significant GO biological process which is colored according to the -log10(p.adjust). |
| Page: 1 2 3 4 5 6 7 8 9 |
| GO ID | Tissue | Disease Stage | Description | Gene Ratio | Bg Ratio | pvalue | p.adjust | Count |
| GO:00525479 | Breast | Precancer | regulation of peptidase activity | 71/1080 | 461/18723 | 2.72e-14 | 6.94e-12 | 71 |
| GO:00525489 | Breast | Precancer | regulation of endopeptidase activity | 67/1080 | 432/18723 | 1.06e-13 | 2.36e-11 | 67 |
| GO:00458619 | Breast | Precancer | negative regulation of proteolysis | 50/1080 | 351/18723 | 2.99e-09 | 2.39e-07 | 50 |
| GO:00513468 | Breast | Precancer | negative regulation of hydrolase activity | 50/1080 | 379/18723 | 3.85e-08 | 2.34e-06 | 50 |
| GO:00104668 | Breast | Precancer | negative regulation of peptidase activity | 38/1080 | 262/18723 | 1.46e-07 | 7.82e-06 | 38 |
| GO:00109519 | Breast | Precancer | negative regulation of endopeptidase activity | 37/1080 | 252/18723 | 1.55e-07 | 8.05e-06 | 37 |
| GO:00421769 | Breast | Precancer | regulation of protein catabolic process | 47/1080 | 391/18723 | 1.50e-06 | 5.58e-05 | 47 |
| GO:00075653 | Breast | Precancer | female pregnancy | 29/1080 | 193/18723 | 2.07e-06 | 7.31e-05 | 29 |
| GO:00447063 | Breast | Precancer | multi-multicellular organism process | 31/1080 | 220/18723 | 3.73e-06 | 1.19e-04 | 31 |
| GO:00420609 | Breast | Precancer | wound healing | 48/1080 | 422/18723 | 5.48e-06 | 1.63e-04 | 48 |
| GO:00075688 | Breast | Precancer | aging | 41/1080 | 339/18723 | 5.95e-06 | 1.71e-04 | 41 |
| GO:00313309 | Breast | Precancer | negative regulation of cellular catabolic process | 34/1080 | 262/18723 | 8.16e-06 | 2.20e-04 | 34 |
| GO:00093148 | Breast | Precancer | response to radiation | 47/1080 | 456/18723 | 8.39e-05 | 1.62e-03 | 47 |
| GO:00712147 | Breast | Precancer | cellular response to abiotic stimulus | 37/1080 | 331/18723 | 9.12e-05 | 1.73e-03 | 37 |
| GO:01040047 | Breast | Precancer | cellular response to environmental stimulus | 37/1080 | 331/18723 | 9.12e-05 | 1.73e-03 | 37 |
| GO:00098959 | Breast | Precancer | negative regulation of catabolic process | 36/1080 | 320/18723 | 9.92e-05 | 1.83e-03 | 36 |
| GO:00075663 | Breast | Precancer | embryo implantation | 11/1080 | 53/18723 | 1.82e-04 | 2.95e-03 | 11 |
| GO:00714785 | Breast | Precancer | cellular response to radiation | 24/1080 | 186/18723 | 1.83e-04 | 2.96e-03 | 24 |
| GO:00016678 | Breast | Precancer | ameboidal-type cell migration | 47/1080 | 475/18723 | 2.19e-04 | 3.35e-03 | 47 |
| GO:00421779 | Breast | Precancer | negative regulation of protein catabolic process | 17/1080 | 121/18723 | 5.76e-04 | 7.28e-03 | 17 |
| Page: 1 2 3 4 5 6 7 8 9 10 11 12 13 14 15 16 17 18 19 20 21 22 23 24 25 26 27 28 29 30 31 32 33 34 35 36 37 38 |
| Pathway ID | Tissue | Disease Stage | Description | Gene Ratio | Bg Ratio | pvalue | p.adjust | qvalue | Count |
| hsa0406616 | Breast | Precancer | HIF-1 signaling pathway | 23/684 | 109/8465 | 1.51e-05 | 1.59e-04 | 1.22e-04 | 23 |
| hsa0406617 | Breast | Precancer | HIF-1 signaling pathway | 23/684 | 109/8465 | 1.51e-05 | 1.59e-04 | 1.22e-04 | 23 |
| hsa0406623 | Breast | IDC | HIF-1 signaling pathway | 22/867 | 109/8465 | 1.36e-03 | 1.00e-02 | 7.50e-03 | 22 |
| hsa0406633 | Breast | IDC | HIF-1 signaling pathway | 22/867 | 109/8465 | 1.36e-03 | 1.00e-02 | 7.50e-03 | 22 |
| hsa0406642 | Breast | DCIS | HIF-1 signaling pathway | 22/846 | 109/8465 | 9.83e-04 | 7.05e-03 | 5.20e-03 | 22 |
| hsa0406652 | Breast | DCIS | HIF-1 signaling pathway | 22/846 | 109/8465 | 9.83e-04 | 7.05e-03 | 5.20e-03 | 22 |
| hsa0406618 | Cervix | CC | HIF-1 signaling pathway | 27/1267 | 109/8465 | 4.72e-03 | 1.64e-02 | 9.72e-03 | 27 |
| hsa0406619 | Cervix | CC | HIF-1 signaling pathway | 27/1267 | 109/8465 | 4.72e-03 | 1.64e-02 | 9.72e-03 | 27 |
| hsa04066 | Colorectum | AD | HIF-1 signaling pathway | 48/2092 | 109/8465 | 7.25e-06 | 7.84e-05 | 5.00e-05 | 48 |
| hsa040661 | Colorectum | AD | HIF-1 signaling pathway | 48/2092 | 109/8465 | 7.25e-06 | 7.84e-05 | 5.00e-05 | 48 |
| hsa040662 | Colorectum | SER | HIF-1 signaling pathway | 36/1580 | 109/8465 | 2.27e-04 | 2.15e-03 | 1.56e-03 | 36 |
| hsa040663 | Colorectum | SER | HIF-1 signaling pathway | 36/1580 | 109/8465 | 2.27e-04 | 2.15e-03 | 1.56e-03 | 36 |
| hsa040664 | Colorectum | MSS | HIF-1 signaling pathway | 39/1875 | 109/8465 | 7.61e-04 | 5.00e-03 | 3.06e-03 | 39 |
| hsa040665 | Colorectum | MSS | HIF-1 signaling pathway | 39/1875 | 109/8465 | 7.61e-04 | 5.00e-03 | 3.06e-03 | 39 |
| hsa040668 | Colorectum | CRC | HIF-1 signaling pathway | 25/1091 | 109/8465 | 2.57e-03 | 1.75e-02 | 1.19e-02 | 25 |
| hsa040669 | Colorectum | CRC | HIF-1 signaling pathway | 25/1091 | 109/8465 | 2.57e-03 | 1.75e-02 | 1.19e-02 | 25 |
| hsa0406620 | Endometrium | AEH | HIF-1 signaling pathway | 29/1197 | 109/8465 | 4.23e-04 | 3.11e-03 | 2.27e-03 | 29 |
| hsa04066110 | Endometrium | AEH | HIF-1 signaling pathway | 29/1197 | 109/8465 | 4.23e-04 | 3.11e-03 | 2.27e-03 | 29 |
| hsa0406624 | Endometrium | EEC | HIF-1 signaling pathway | 29/1237 | 109/8465 | 7.33e-04 | 5.13e-03 | 3.82e-03 | 29 |
| hsa0406634 | Endometrium | EEC | HIF-1 signaling pathway | 29/1237 | 109/8465 | 7.33e-04 | 5.13e-03 | 3.82e-03 | 29 |
| Page: 1 2 |
Top |
Cell-cell communication analysis |
| Identification of potential cell-cell interactions between two cell types and their ligand-receptor pairs for different disease states |
| Ligand | Receptor | LRpair | Pathway | Tissue | Disease Stage |
| Page: 1 |
Top |
Single-cell gene regulatory network inference analysis |
| Find out the significant the regulons (TFs) and the target genes of each regulon across cell types for different disease states |
| TF | Cell Type | Tissue | Disease Stage | Target Gene | RSS | Regulon Activity |
| ∗The dot plots of a searched regulon are shown for all cell subpopulations in each disease state of each tissue based on the regulon specific score inferred using pySCENIC and by calculating the average expression. |
| Page: 1 |
Top |
Somatic mutation of malignant transformation related genes |
| Annotation of somatic variants for genes involved in malignant transformation |
| Hugo Symbol | Variant Class | Variant Classification | dbSNP RS | HGVSc | HGVSp | HGVSp Short | SWISSPROT | BIOTYPE | SIFT | PolyPhen | Tumor Sample Barcode | Tissue | Histology | Sex | Age | Stage | Therapy Types | Drugs | Outcome |
| TIMP1 | SNV | Missense_Mutation | novel | c.55G>A | p.Ala19Thr | p.A19T | P01033 | protein_coding | tolerated(0.61) | benign(0.001) | TCGA-AC-A3OD-01 | Breast | breast invasive carcinoma | Female | >=65 | I/II | Unknown | Unknown | SD |
| TIMP1 | SNV | Missense_Mutation | novel | c.256N>C | p.Thr86Pro | p.T86P | P01033 | protein_coding | deleterious(0) | probably_damaging(0.983) | TCGA-E9-A1RE-01 | Breast | breast invasive carcinoma | Female | >=65 | III/IV | Hormone Therapy | tamoxiphen | SD |
| TIMP1 | SNV | Missense_Mutation | novel | c.444N>T | p.Glu148Asp | p.E148D | P01033 | protein_coding | tolerated_low_confidence(0.46) | benign(0) | TCGA-2W-A8YY-01 | Cervix | cervical & endocervical cancer | Female | <65 | I/II | Chemotherapy | cisplatin | CR |
| TIMP1 | SNV | Missense_Mutation | c.278N>A | p.Cys93Tyr | p.C93Y | P01033 | protein_coding | deleterious(0) | probably_damaging(1) | TCGA-AA-A01R-01 | Colorectum | colon adenocarcinoma | Male | <65 | III/IV | Chemotherapy | 5-fluorouracil | PD | |
| TIMP1 | SNV | Missense_Mutation | novel | c.395G>T | p.Ser132Ile | p.S132I | P01033 | protein_coding | deleterious(0) | probably_damaging(0.965) | TCGA-A5-A0G1-01 | Endometrium | uterine corpus endometrioid carcinoma | Female | >=65 | I/II | Unknown | Unknown | SD |
| TIMP1 | SNV | Missense_Mutation | novel | c.395N>T | p.Ser132Ile | p.S132I | P01033 | protein_coding | deleterious(0) | probably_damaging(0.965) | TCGA-A5-A0GG-01 | Endometrium | uterine corpus endometrioid carcinoma | Female | >=65 | I/II | Unknown | Unknown | SD |
| TIMP1 | SNV | Missense_Mutation | novel | c.302A>G | p.Asn101Ser | p.N101S | P01033 | protein_coding | tolerated(0.22) | benign(0.394) | TCGA-A5-A1OF-01 | Endometrium | uterine corpus endometrioid carcinoma | Female | <65 | I/II | Unknown | Unknown | SD |
| TIMP1 | SNV | Missense_Mutation | novel | c.434T>C | p.Val145Ala | p.V145A | P01033 | protein_coding | tolerated(1) | benign(0) | TCGA-A5-A1OF-01 | Endometrium | uterine corpus endometrioid carcinoma | Female | <65 | I/II | Unknown | Unknown | SD |
| TIMP1 | SNV | Missense_Mutation | c.121N>A | p.Val41Ile | p.V41I | P01033 | protein_coding | deleterious(0.03) | probably_damaging(0.989) | TCGA-AP-A0LD-01 | Endometrium | uterine corpus endometrioid carcinoma | Female | <65 | I/II | Unknown | Unknown | SD | |
| TIMP1 | SNV | Missense_Mutation | rs754631765 | c.304C>T | p.Arg102Cys | p.R102C | P01033 | protein_coding | deleterious(0) | probably_damaging(0.954) | TCGA-AP-A1DK-01 | Endometrium | uterine corpus endometrioid carcinoma | Female | <65 | I/II | Unknown | Unknown | SD |
| Page: 1 2 3 |
Top |
Related drugs of malignant transformation related genes |
| Identification of chemicals and drugs interact with genes involved in malignant transfromation |
| (DGIdb 4.0) |
| Entrez ID | Symbol | Category | Interaction Types | Drug Claim Name | Drug Name | PMIDs |
| Page: 1 |

Copyright 2023-Present -The University of Texas Health Science Center at Houston |