
|
|||||
|
 | |
| |
| |
| |
| |
| |
|
Gene: TIMM8B |
Gene summary for TIMM8B |
| Gene information | Species | Human | Gene symbol | TIMM8B | Gene ID | 26521 |
| Gene name | translocase of inner mitochondrial membrane 8 homolog B | |
| Gene Alias | DDP2 | |
| Cytomap | 11q23.1 | |
| Gene Type | protein-coding | GO ID | GO:0003008 | UniProtAcc | G3XAN8 |
Top |
Malignant transformation analysis |
| Identification of the aberrant gene expression in precancerous and cancerous lesions by comparing the gene expression of stem-like cells in diseased tissues with normal stem cells |
| Entrez ID | Symbol | Replicates | Species | Organ | Tissue | Adj P-value | Log2FC | Malignancy |
| 26521 | TIMM8B | GSM4909281 | Human | Breast | IDC | 1.14e-20 | 5.84e-01 | 0.21 |
| 26521 | TIMM8B | GSM4909285 | Human | Breast | IDC | 3.19e-02 | 1.97e-01 | 0.21 |
| 26521 | TIMM8B | GSM4909286 | Human | Breast | IDC | 8.17e-13 | 4.05e-01 | 0.1081 |
| 26521 | TIMM8B | GSM4909287 | Human | Breast | IDC | 5.46e-11 | 4.63e-01 | 0.2057 |
| 26521 | TIMM8B | GSM4909288 | Human | Breast | IDC | 4.29e-03 | 6.07e-03 | 0.0988 |
| 26521 | TIMM8B | GSM4909290 | Human | Breast | IDC | 3.89e-36 | 8.34e-01 | 0.2096 |
| 26521 | TIMM8B | GSM4909293 | Human | Breast | IDC | 1.15e-07 | 3.18e-01 | 0.1581 |
| 26521 | TIMM8B | GSM4909294 | Human | Breast | IDC | 1.83e-06 | 3.55e-01 | 0.2022 |
| 26521 | TIMM8B | GSM4909296 | Human | Breast | IDC | 4.56e-11 | 1.93e-01 | 0.1524 |
| 26521 | TIMM8B | GSM4909297 | Human | Breast | IDC | 1.82e-12 | -2.40e-01 | 0.1517 |
| 26521 | TIMM8B | GSM4909311 | Human | Breast | IDC | 9.16e-27 | -2.57e-01 | 0.1534 |
| 26521 | TIMM8B | GSM4909312 | Human | Breast | IDC | 1.31e-09 | -2.07e-01 | 0.1552 |
| 26521 | TIMM8B | GSM4909313 | Human | Breast | IDC | 1.91e-02 | -1.77e-01 | 0.0391 |
| 26521 | TIMM8B | GSM4909315 | Human | Breast | IDC | 2.85e-02 | -2.30e-01 | 0.21 |
| 26521 | TIMM8B | GSM4909319 | Human | Breast | IDC | 5.47e-36 | -1.44e-01 | 0.1563 |
| 26521 | TIMM8B | GSM4909320 | Human | Breast | IDC | 1.31e-02 | -1.36e-01 | 0.1575 |
| 26521 | TIMM8B | GSM4909321 | Human | Breast | IDC | 6.06e-12 | -1.82e-01 | 0.1559 |
| 26521 | TIMM8B | brca2 | Human | Breast | Precancer | 8.10e-10 | 3.57e-01 | -0.024 |
| 26521 | TIMM8B | brca3 | Human | Breast | Precancer | 4.39e-02 | 1.71e-01 | -0.0263 |
| 26521 | TIMM8B | M2 | Human | Breast | IDC | 5.37e-03 | 7.41e-02 | 0.21 |
| Page: 1 2 3 4 5 6 7 8 9 10 11 12 |
| Tissue | Expression Dynamics | Abbreviation |
| Breast |  | IDC: Invasive ductal carcinoma |
| DCIS: Ductal carcinoma in situ | ||
| Precancer(BRCA1-mut): Precancerous lesion from BRCA1 mutation carriers | ||
| Cervix | 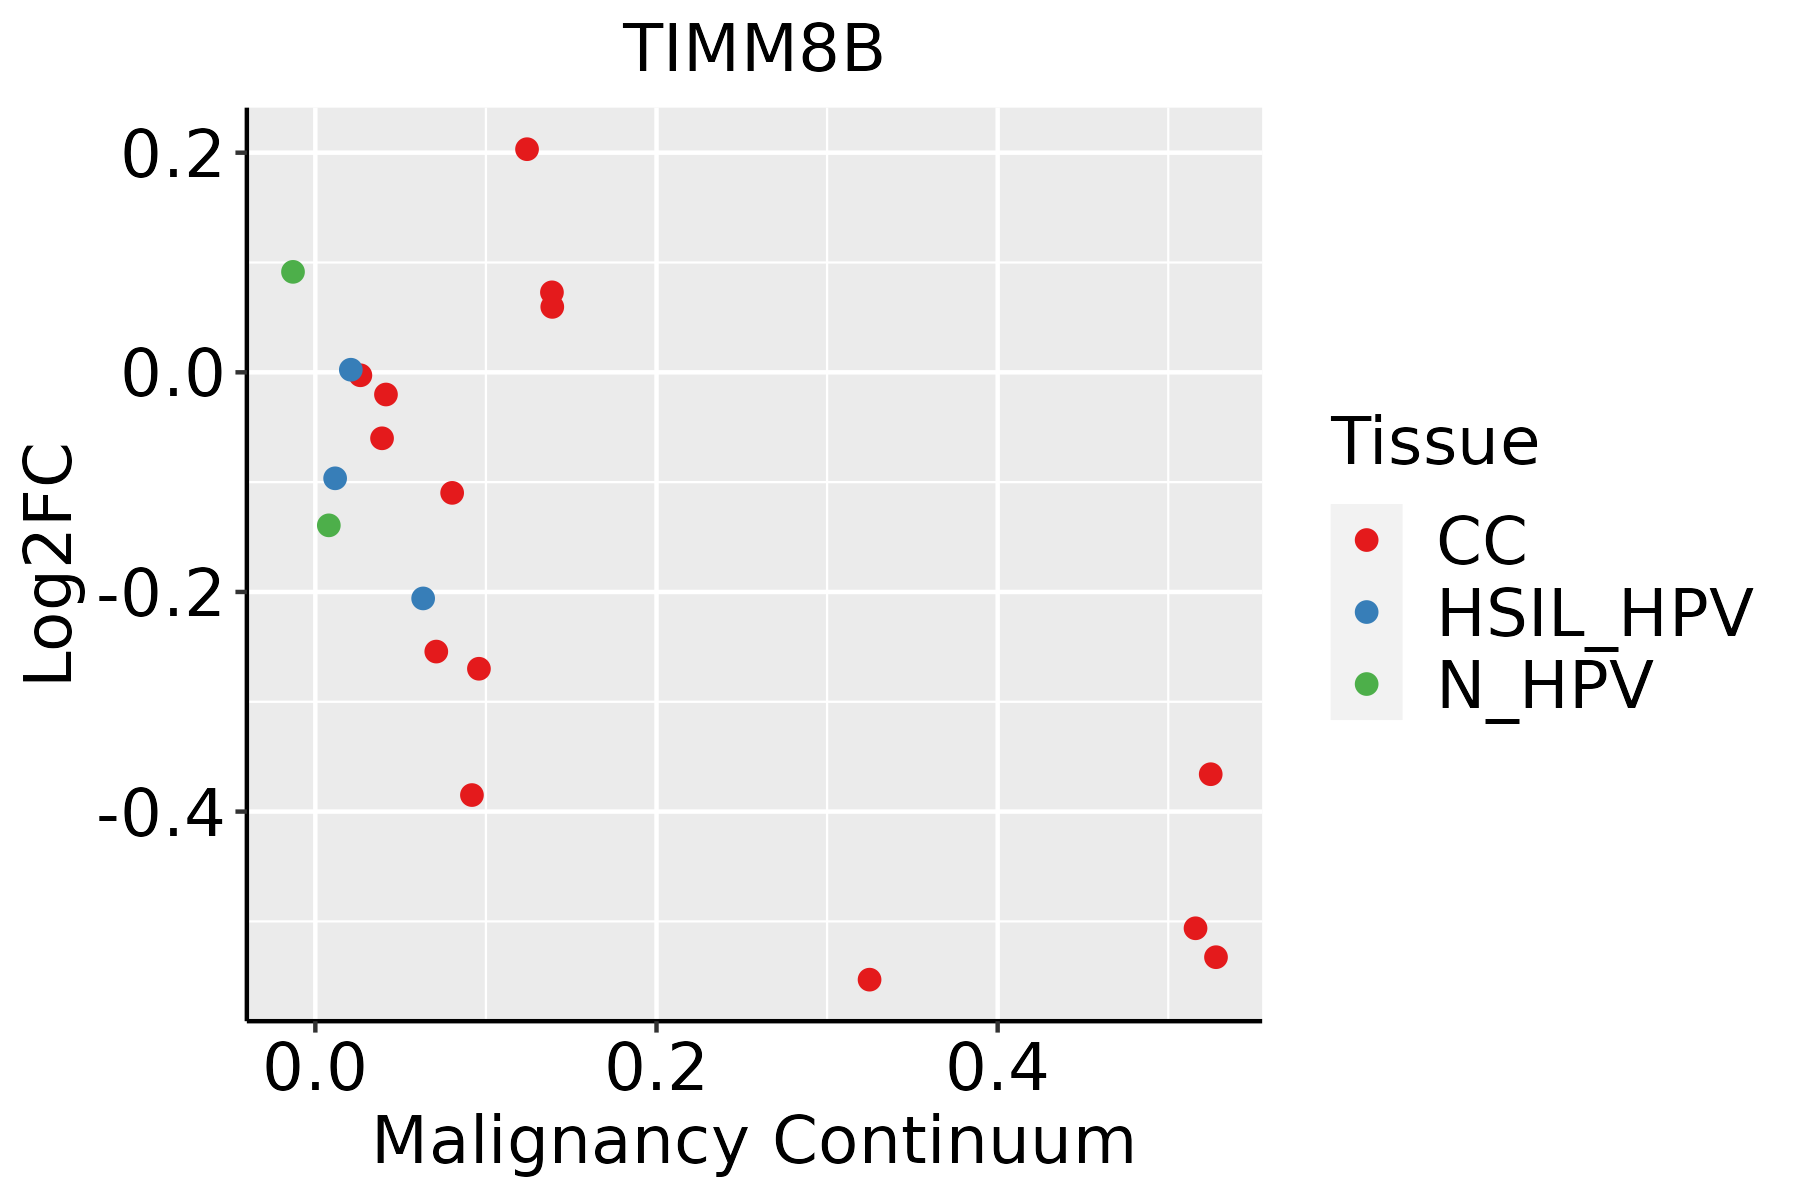 | CC: Cervix cancer |
| HSIL_HPV: HPV-infected high-grade squamous intraepithelial lesions | ||
| N_HPV: HPV-infected normal cervix | ||
| Colorectum (GSE201348) |  | FAP: Familial adenomatous polyposis |
| CRC: Colorectal cancer | ||
| Colorectum (HTA11) |  | AD: Adenomas |
| SER: Sessile serrated lesions | ||
| MSI-H: Microsatellite-high colorectal cancer | ||
| MSS: Microsatellite stable colorectal cancer | ||
| Endometrium | 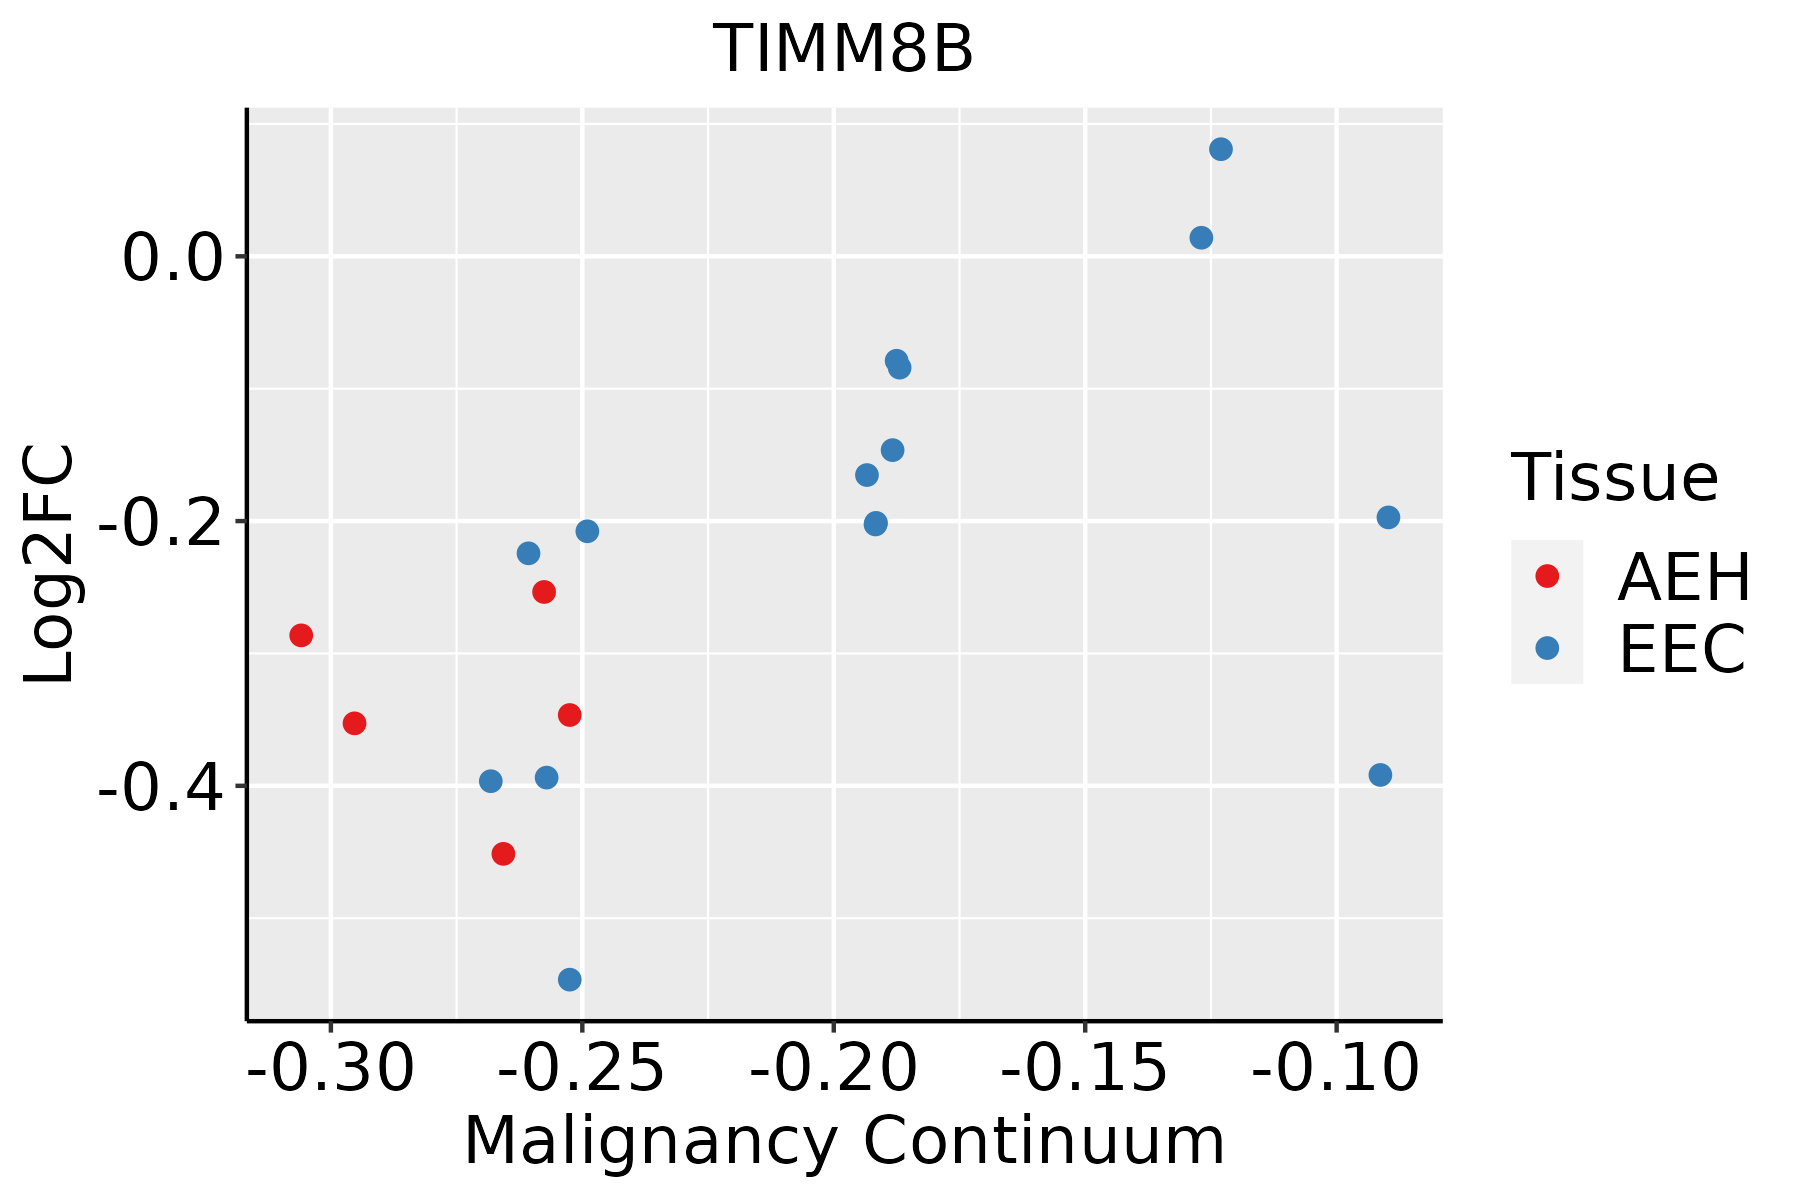 | AEH: Atypical endometrial hyperplasia |
| EEC: Endometrioid Cancer | ||
| Esophagus |  | ESCC: Esophageal squamous cell carcinoma |
| HGIN: High-grade intraepithelial neoplasias | ||
| LGIN: Low-grade intraepithelial neoplasias | ||
| GC |  | CAG: Chronic atrophic gastritis |
| CAG with IM: Chronic atrophic gastritis with intestinal metaplasia | ||
| CSG: Chronic superficial gastritis | ||
| GC: Gastric cancer | ||
| SIM: Severe intestinal metaplasia | ||
| WIM: Wild intestinal metaplasia | ||
| Liver | 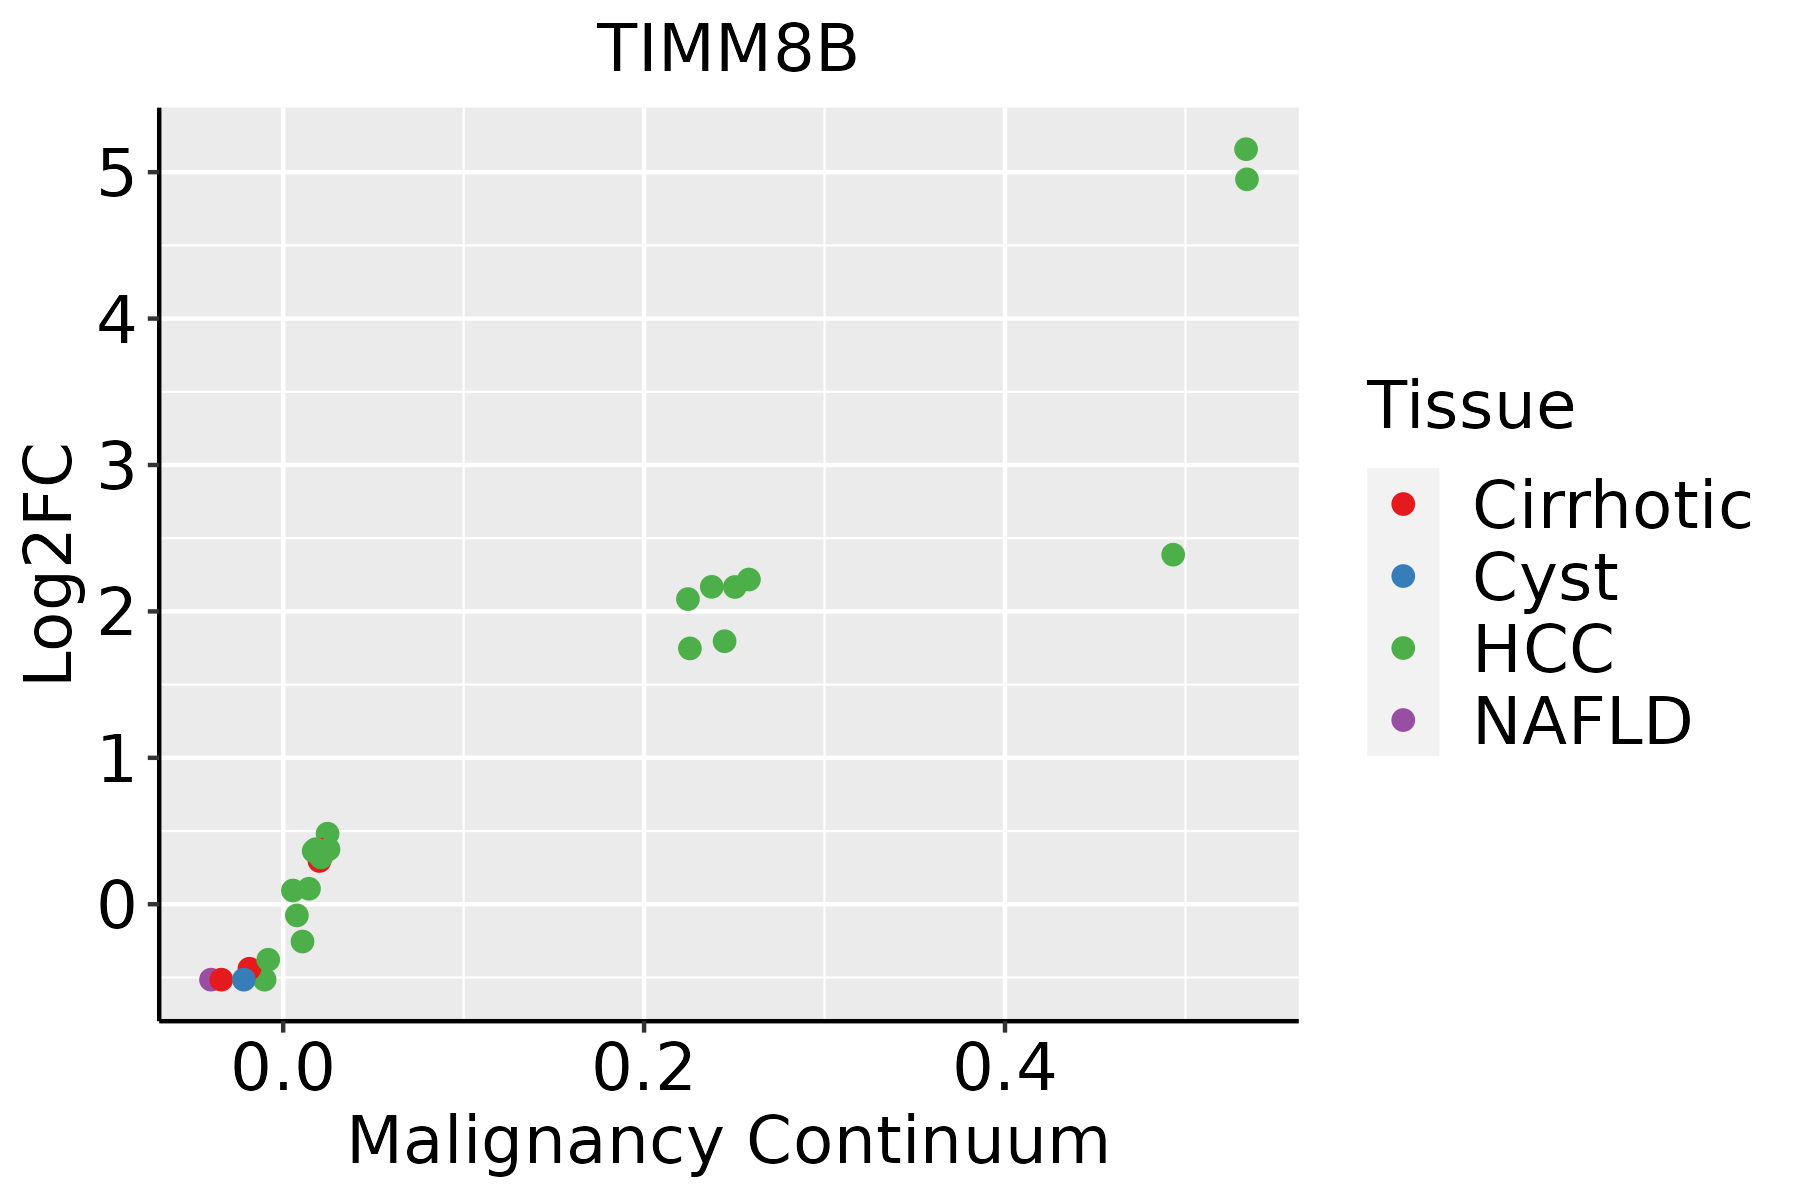 | HCC: Hepatocellular carcinoma |
| NAFLD: Non-alcoholic fatty liver disease | ||
| Oral Cavity | 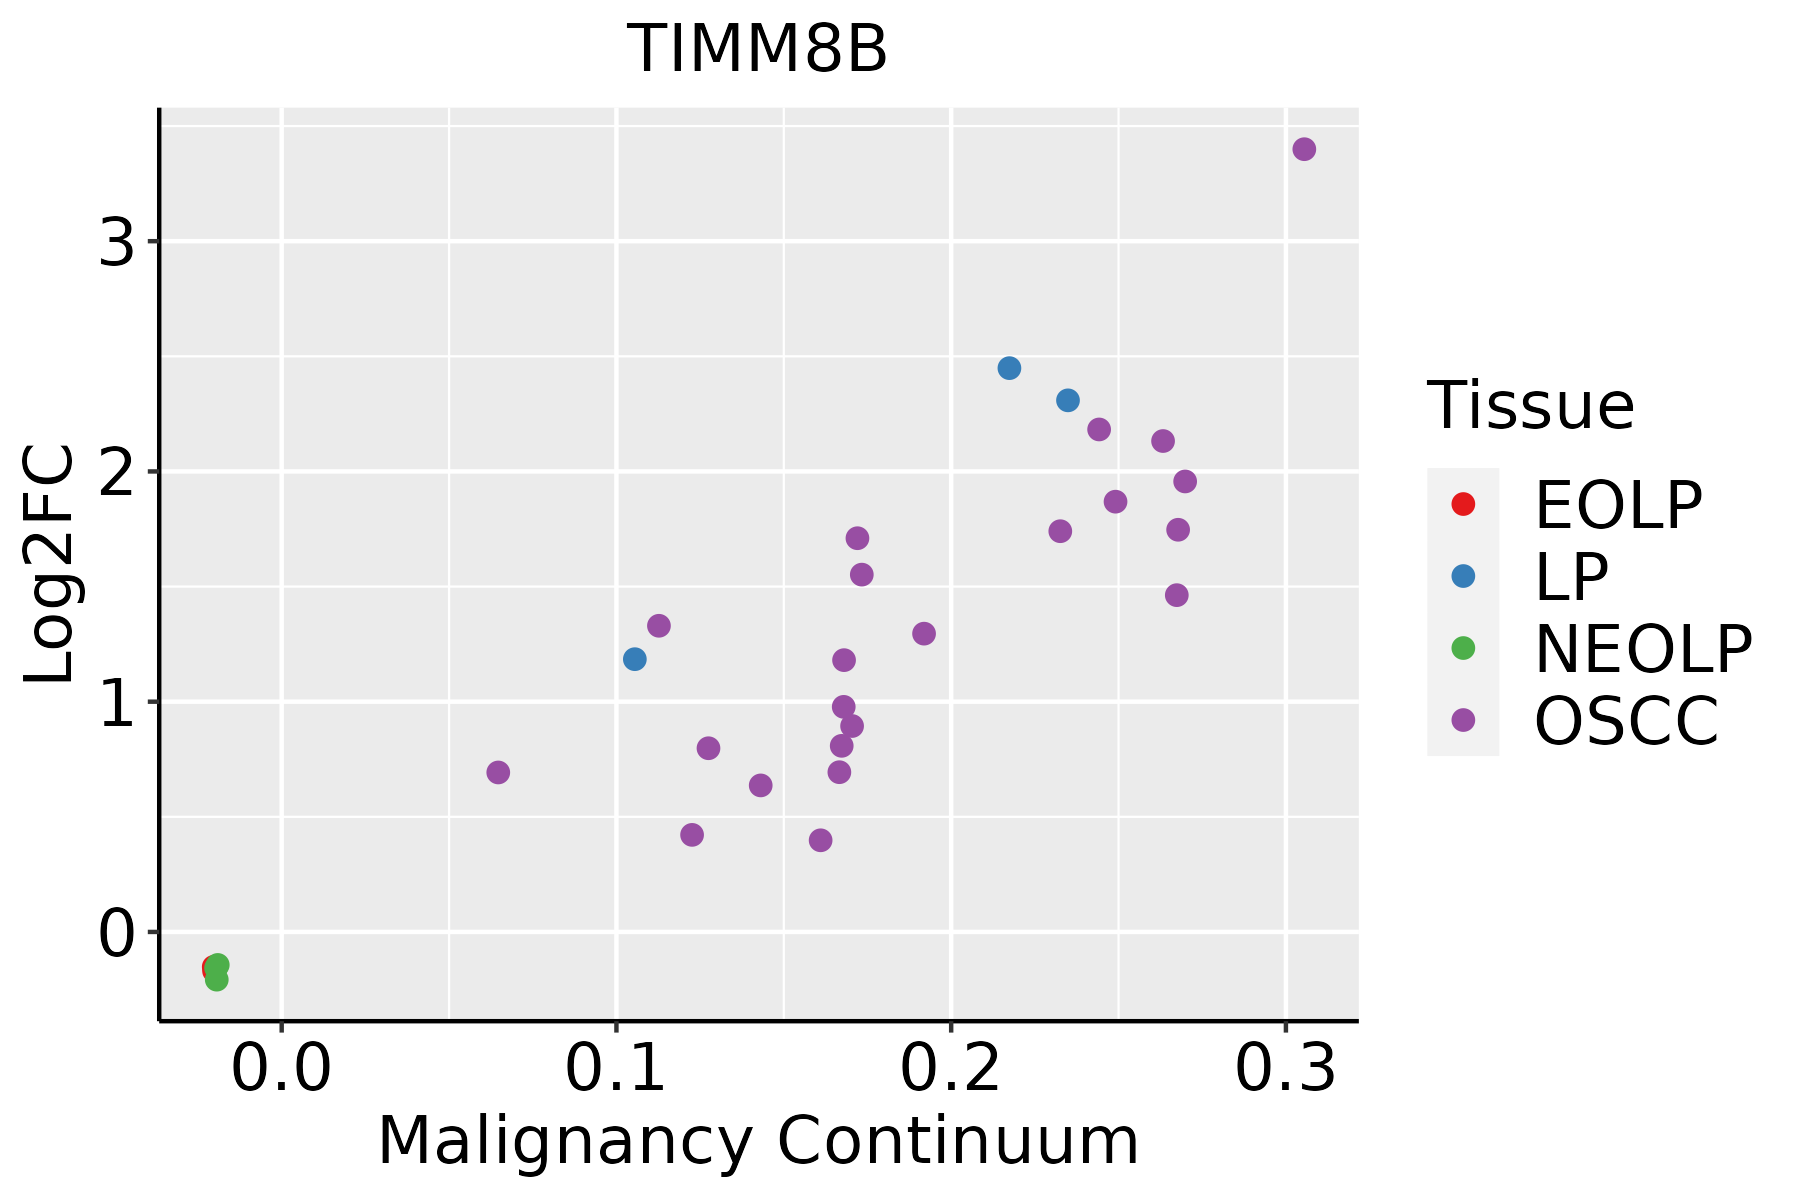 | EOLP: Erosive Oral lichen planus |
| LP: leukoplakia | ||
| NEOLP: Non-erosive oral lichen planus | ||
| OSCC: Oral squamous cell carcinoma | ||
| Prostate | 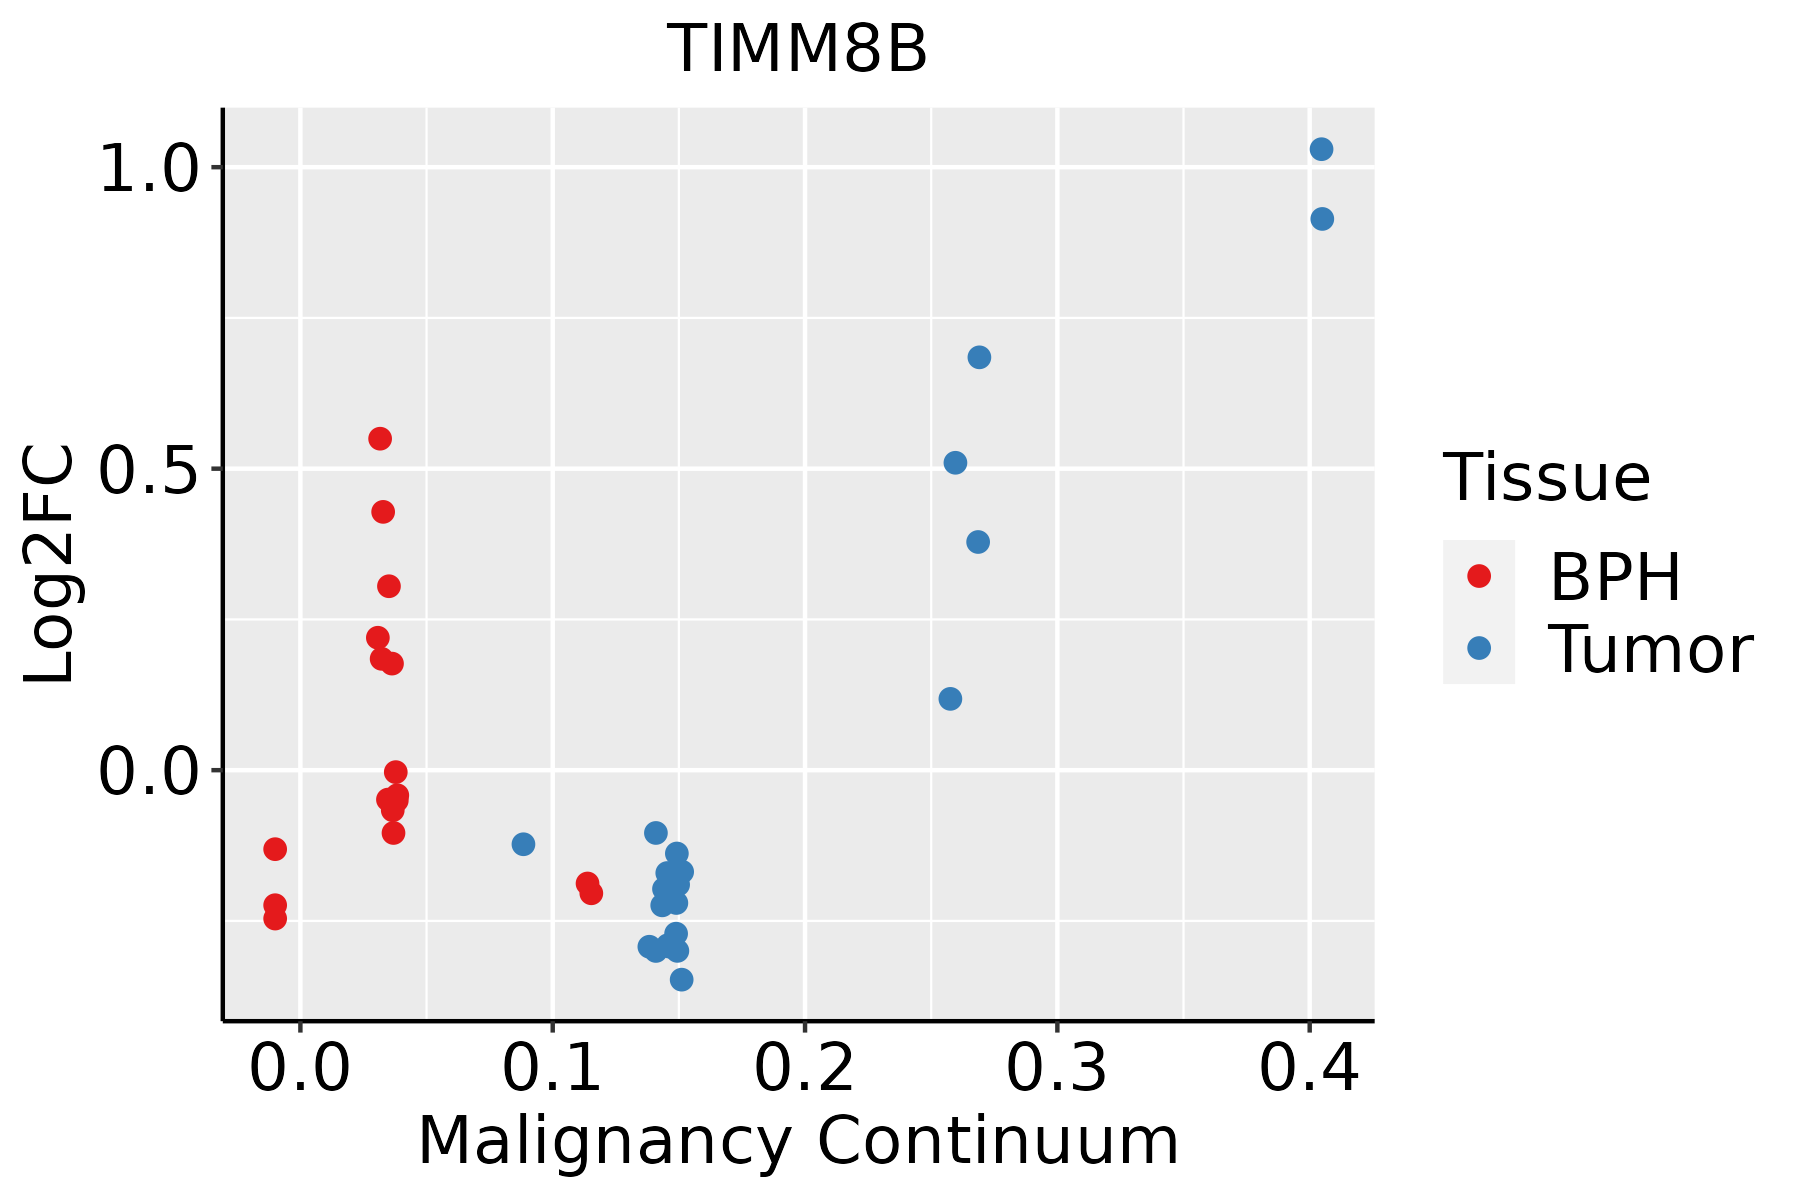 | BPH: Benign Prostatic Hyperplasia |
| Skin | 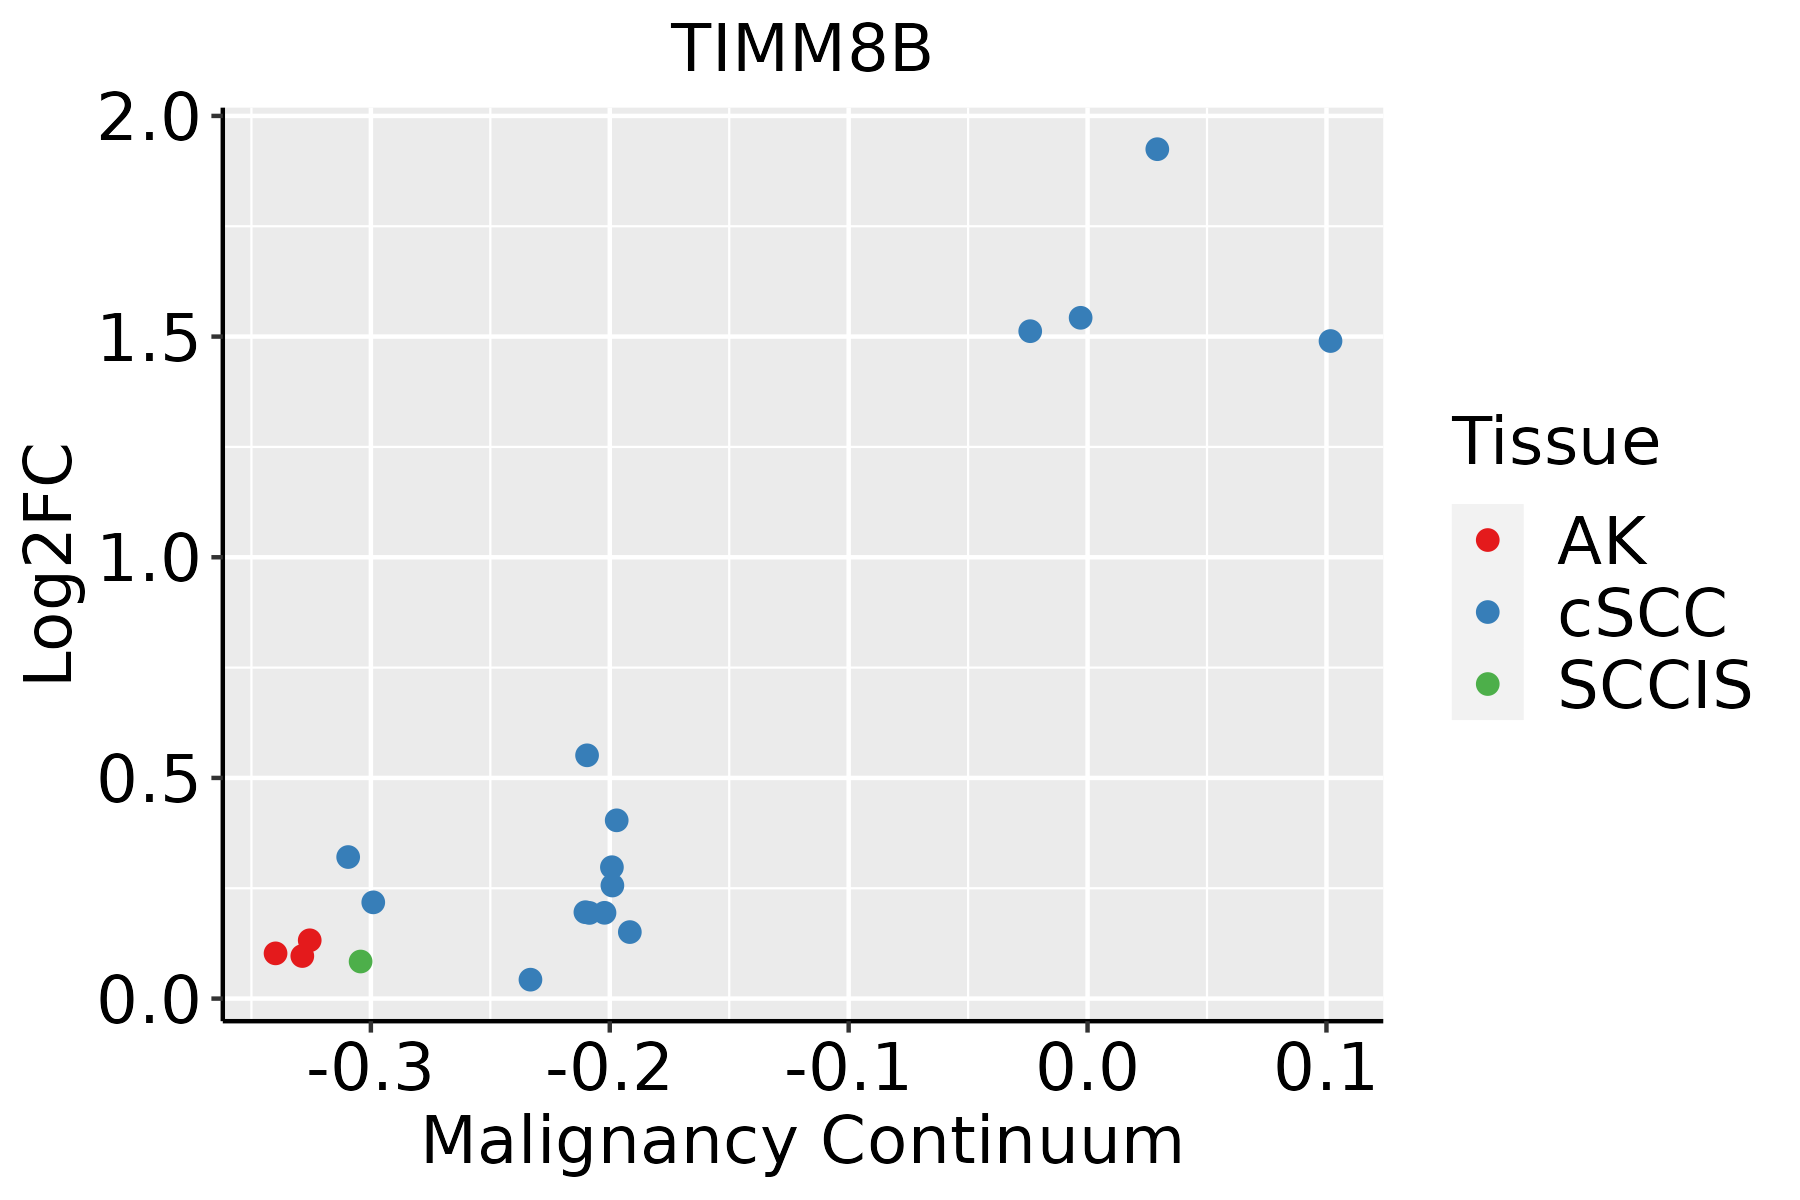 | AK: Actinic keratosis |
| cSCC: Cutaneous squamous cell carcinoma | ||
| SCCIS:squamous cell carcinoma in situ | ||
| Thyroid |  | ATC: Anaplastic thyroid cancer |
| HT: Hashimoto's thyroiditis | ||
| PTC: Papillary thyroid cancer |
| ∗log2FC in expression of this searched gene in stem-like cells from each diseased tissue sample relative to stem-like cells in normal samples in each tissue plotted against the malignancy continuum. Samples are colored based on if they are from different disease stage. |
Top |
Malignant transformation related pathway analysis |
| Find out the enriched GO biological processes and KEGG pathways involved in transition from healthy to precancer to cancer |
| Tissue | Disease Stage | Enriched GO biological Processes |
| Colorectum | AD |  |
| Colorectum | SER |  |
| Colorectum | MSS |  |
| Colorectum | MSI-H |  |
| Colorectum | FAP |  |
| ∗Top 15 enriched GO BP terms are showed in the bar plot of each disease state in each tissue. Each row represents a significant GO biological process which is colored according to the -log10(p.adjust). |
| Page: 1 2 3 4 5 6 7 8 9 |
| GO ID | Tissue | Disease Stage | Description | Gene Ratio | Bg Ratio | pvalue | p.adjust | Count |
| GO:00068398 | Breast | Precancer | mitochondrial transport | 45/1080 | 254/18723 | 1.37e-11 | 1.88e-09 | 45 |
| GO:00705858 | Breast | Precancer | protein localization to mitochondrion | 21/1080 | 125/18723 | 9.07e-06 | 2.42e-04 | 21 |
| GO:00070066 | Breast | Precancer | mitochondrial membrane organization | 20/1080 | 116/18723 | 9.88e-06 | 2.61e-04 | 20 |
| GO:00726558 | Breast | Precancer | establishment of protein localization to mitochondrion | 20/1080 | 120/18723 | 1.66e-05 | 4.03e-04 | 20 |
| GO:00901516 | Breast | Precancer | establishment of protein localization to mitochondrial membrane | 8/1080 | 30/18723 | 2.24e-04 | 3.40e-03 | 8 |
| GO:00066268 | Breast | Precancer | protein targeting to mitochondrion | 15/1080 | 100/18723 | 5.94e-04 | 7.48e-03 | 15 |
| GO:00066059 | Breast | Precancer | protein targeting | 33/1080 | 314/18723 | 6.50e-04 | 7.99e-03 | 33 |
| GO:00725948 | Breast | Precancer | establishment of protein localization to organelle | 41/1080 | 422/18723 | 7.75e-04 | 9.20e-03 | 41 |
| GO:00512045 | Breast | Precancer | protein insertion into mitochondrial membrane | 6/1080 | 25/18723 | 2.49e-03 | 2.28e-02 | 6 |
| GO:0045039 | Breast | Precancer | protein insertion into mitochondrial inner membrane | 4/1080 | 12/18723 | 3.75e-03 | 3.04e-02 | 4 |
| GO:000683913 | Breast | IDC | mitochondrial transport | 51/1434 | 254/18723 | 1.54e-10 | 1.83e-08 | 51 |
| GO:007058513 | Breast | IDC | protein localization to mitochondrion | 23/1434 | 125/18723 | 6.92e-05 | 1.40e-03 | 23 |
| GO:007265513 | Breast | IDC | establishment of protein localization to mitochondrion | 22/1434 | 120/18723 | 1.04e-04 | 1.97e-03 | 22 |
| GO:000660514 | Breast | IDC | protein targeting | 43/1434 | 314/18723 | 1.44e-04 | 2.53e-03 | 43 |
| GO:000700613 | Breast | IDC | mitochondrial membrane organization | 21/1434 | 116/18723 | 1.78e-04 | 3.00e-03 | 21 |
| GO:007259413 | Breast | IDC | establishment of protein localization to organelle | 51/1434 | 422/18723 | 7.94e-04 | 9.55e-03 | 51 |
| GO:000662613 | Breast | IDC | protein targeting to mitochondrion | 17/1434 | 100/18723 | 1.47e-03 | 1.50e-02 | 17 |
| GO:009015112 | Breast | IDC | establishment of protein localization to mitochondrial membrane | 8/1434 | 30/18723 | 1.48e-03 | 1.50e-02 | 8 |
| GO:000683923 | Breast | DCIS | mitochondrial transport | 51/1390 | 254/18723 | 5.04e-11 | 6.79e-09 | 51 |
| GO:007058522 | Breast | DCIS | protein localization to mitochondrion | 23/1390 | 125/18723 | 4.28e-05 | 9.05e-04 | 23 |
| Page: 1 2 3 4 5 6 7 8 9 10 11 12 13 14 |
| Pathway ID | Tissue | Disease Stage | Description | Gene Ratio | Bg Ratio | pvalue | p.adjust | qvalue | Count |
| Page: 1 |
Top |
Cell-cell communication analysis |
| Identification of potential cell-cell interactions between two cell types and their ligand-receptor pairs for different disease states |
| Ligand | Receptor | LRpair | Pathway | Tissue | Disease Stage |
| Page: 1 |
Top |
Single-cell gene regulatory network inference analysis |
| Find out the significant the regulons (TFs) and the target genes of each regulon across cell types for different disease states |
| TF | Cell Type | Tissue | Disease Stage | Target Gene | RSS | Regulon Activity |
| ∗The dot plots of a searched regulon are shown for all cell subpopulations in each disease state of each tissue based on the regulon specific score inferred using pySCENIC and by calculating the average expression. |
| Page: 1 |
Top |
Somatic mutation of malignant transformation related genes |
| Annotation of somatic variants for genes involved in malignant transformation |
| Hugo Symbol | Variant Class | Variant Classification | dbSNP RS | HGVSc | HGVSp | HGVSp Short | SWISSPROT | BIOTYPE | SIFT | PolyPhen | Tumor Sample Barcode | Tissue | Histology | Sex | Age | Stage | Therapy Types | Drugs | Outcome |
| TIMM8B | SNV | Missense_Mutation | c.55N>A | p.Leu19Met | p.L19M | protein_coding | tolerated(0.11) | benign(0.202) | TCGA-D8-A1X9-01 | Breast | breast invasive carcinoma | Female | >=65 | I/II | Chemotherapy | adriamycin+cyclophosphamide | SD | ||
| TIMM8B | SNV | Missense_Mutation | rs538340896 | c.262N>T | p.Arg88Trp | p.R88W | protein_coding | deleterious(0.02) | benign(0.003) | TCGA-D8-A1XQ-01 | Breast | breast invasive carcinoma | Female | >=65 | I/II | Unknown | Unknown | SD | |
| TIMM8B | SNV | Missense_Mutation | novel | c.230G>A | p.Arg77His | p.R77H | protein_coding | tolerated(0.07) | benign(0.003) | TCGA-AA-3949-01 | Colorectum | colon adenocarcinoma | Female | >=65 | III/IV | Unknown | Unknown | SD | |
| TIMM8B | SNV | Missense_Mutation | novel | c.153N>G | p.Cys51Trp | p.C51W | protein_coding | deleterious(0.01) | probably_damaging(0.993) | TCGA-B5-A3FC-01 | Endometrium | uterine corpus endometrioid carcinoma | Female | <65 | I/II | Unknown | Unknown | SD | |
| TIMM8B | SNV | Missense_Mutation | rs116405897 | c.185G>A | p.Arg62His | p.R62H | protein_coding | deleterious(0.01) | benign(0.003) | TCGA-FI-A2D5-01 | Endometrium | uterine corpus endometrioid carcinoma | Female | <65 | III/IV | Chemotherapy | carboplatinum | PD | |
| TIMM8B | SNV | Missense_Mutation | novel | c.25N>T | p.Val9Leu | p.V9L | protein_coding | tolerated_low_confidence(0.56) | unknown(0) | TCGA-49-4512-01 | Lung | lung adenocarcinoma | Female | >=65 | III/IV | Unspecific | PD | ||
| TIMM8B | SNV | Missense_Mutation | novel | c.61G>A | p.Glu21Lys | p.E21K | protein_coding | tolerated(0.49) | benign(0.006) | TCGA-86-8672-01 | Lung | lung adenocarcinoma | Male | <65 | I/II | Unknown | Unknown | SD | |
| TIMM8B | SNV | Missense_Mutation | novel | c.160A>G | p.Lys54Glu | p.K54E | protein_coding | deleterious(0.01) | probably_damaging(0.981) | TCGA-R5-A7ZR-01 | Stomach | stomach adenocarcinoma | Female | >=65 | III/IV | Unknown | Unknown | PD | |
| TIMM8B | SNV | Missense_Mutation | novel | c.62N>G | p.Glu21Gly | p.E21G | protein_coding | tolerated(0.23) | benign(0.327) | TCGA-VQ-A8PP-01 | Stomach | stomach adenocarcinoma | Male | >=65 | III/IV | Chemotherapy | fluorouracil | PD |
| Page: 1 |
Top |
Related drugs of malignant transformation related genes |
| Identification of chemicals and drugs interact with genes involved in malignant transfromation |
| (DGIdb 4.0) |
| Entrez ID | Symbol | Category | Interaction Types | Drug Claim Name | Drug Name | PMIDs |
| Page: 1 |

Copyright 2023-Present -The University of Texas Health Science Center at Houston |