
|
|||||
|
 | |
| |
| |
| |
| |
| |
|
Gene: TIMM8A |
Gene summary for TIMM8A |
| Gene information | Species | Human | Gene symbol | TIMM8A | Gene ID | 1678 |
| Gene name | translocase of inner mitochondrial membrane 8A | |
| Gene Alias | DDP | |
| Cytomap | Xq22.1 | |
| Gene Type | protein-coding | GO ID | GO:0006605 | UniProtAcc | O60220 |
Top |
Malignant transformation analysis |
| Identification of the aberrant gene expression in precancerous and cancerous lesions by comparing the gene expression of stem-like cells in diseased tissues with normal stem cells |
| Entrez ID | Symbol | Replicates | Species | Organ | Tissue | Adj P-value | Log2FC | Malignancy |
| 1678 | TIMM8A | LZE2T | Human | Esophagus | ESCC | 2.33e-05 | 3.66e-01 | 0.082 |
| 1678 | TIMM8A | LZE4T | Human | Esophagus | ESCC | 1.76e-04 | 1.13e-01 | 0.0811 |
| 1678 | TIMM8A | LZE7T | Human | Esophagus | ESCC | 3.43e-06 | 3.92e-01 | 0.0667 |
| 1678 | TIMM8A | LZE20T | Human | Esophagus | ESCC | 1.94e-05 | 6.52e-02 | 0.0662 |
| 1678 | TIMM8A | LZE24T | Human | Esophagus | ESCC | 3.27e-10 | 3.51e-01 | 0.0596 |
| 1678 | TIMM8A | LZE21T | Human | Esophagus | ESCC | 6.73e-03 | 2.00e-01 | 0.0655 |
| 1678 | TIMM8A | LZE6T | Human | Esophagus | ESCC | 3.73e-02 | 2.69e-01 | 0.0845 |
| 1678 | TIMM8A | P1T-E | Human | Esophagus | ESCC | 5.43e-05 | 2.99e-01 | 0.0875 |
| 1678 | TIMM8A | P2T-E | Human | Esophagus | ESCC | 3.68e-20 | 3.97e-01 | 0.1177 |
| 1678 | TIMM8A | P4T-E | Human | Esophagus | ESCC | 1.59e-15 | 5.83e-01 | 0.1323 |
| 1678 | TIMM8A | P5T-E | Human | Esophagus | ESCC | 3.23e-26 | 5.06e-01 | 0.1327 |
| 1678 | TIMM8A | P8T-E | Human | Esophagus | ESCC | 1.43e-09 | 5.82e-02 | 0.0889 |
| 1678 | TIMM8A | P9T-E | Human | Esophagus | ESCC | 2.43e-17 | 5.56e-01 | 0.1131 |
| 1678 | TIMM8A | P10T-E | Human | Esophagus | ESCC | 5.96e-13 | 1.78e-01 | 0.116 |
| 1678 | TIMM8A | P11T-E | Human | Esophagus | ESCC | 5.30e-08 | 3.54e-01 | 0.1426 |
| 1678 | TIMM8A | P12T-E | Human | Esophagus | ESCC | 3.43e-10 | 9.91e-02 | 0.1122 |
| 1678 | TIMM8A | P15T-E | Human | Esophagus | ESCC | 3.49e-15 | 3.25e-01 | 0.1149 |
| 1678 | TIMM8A | P16T-E | Human | Esophagus | ESCC | 8.59e-13 | 1.50e-01 | 0.1153 |
| 1678 | TIMM8A | P17T-E | Human | Esophagus | ESCC | 6.00e-03 | 2.45e-01 | 0.1278 |
| 1678 | TIMM8A | P20T-E | Human | Esophagus | ESCC | 5.00e-15 | 3.12e-01 | 0.1124 |
| Page: 1 2 3 4 5 |
| Tissue | Expression Dynamics | Abbreviation |
| Esophagus | 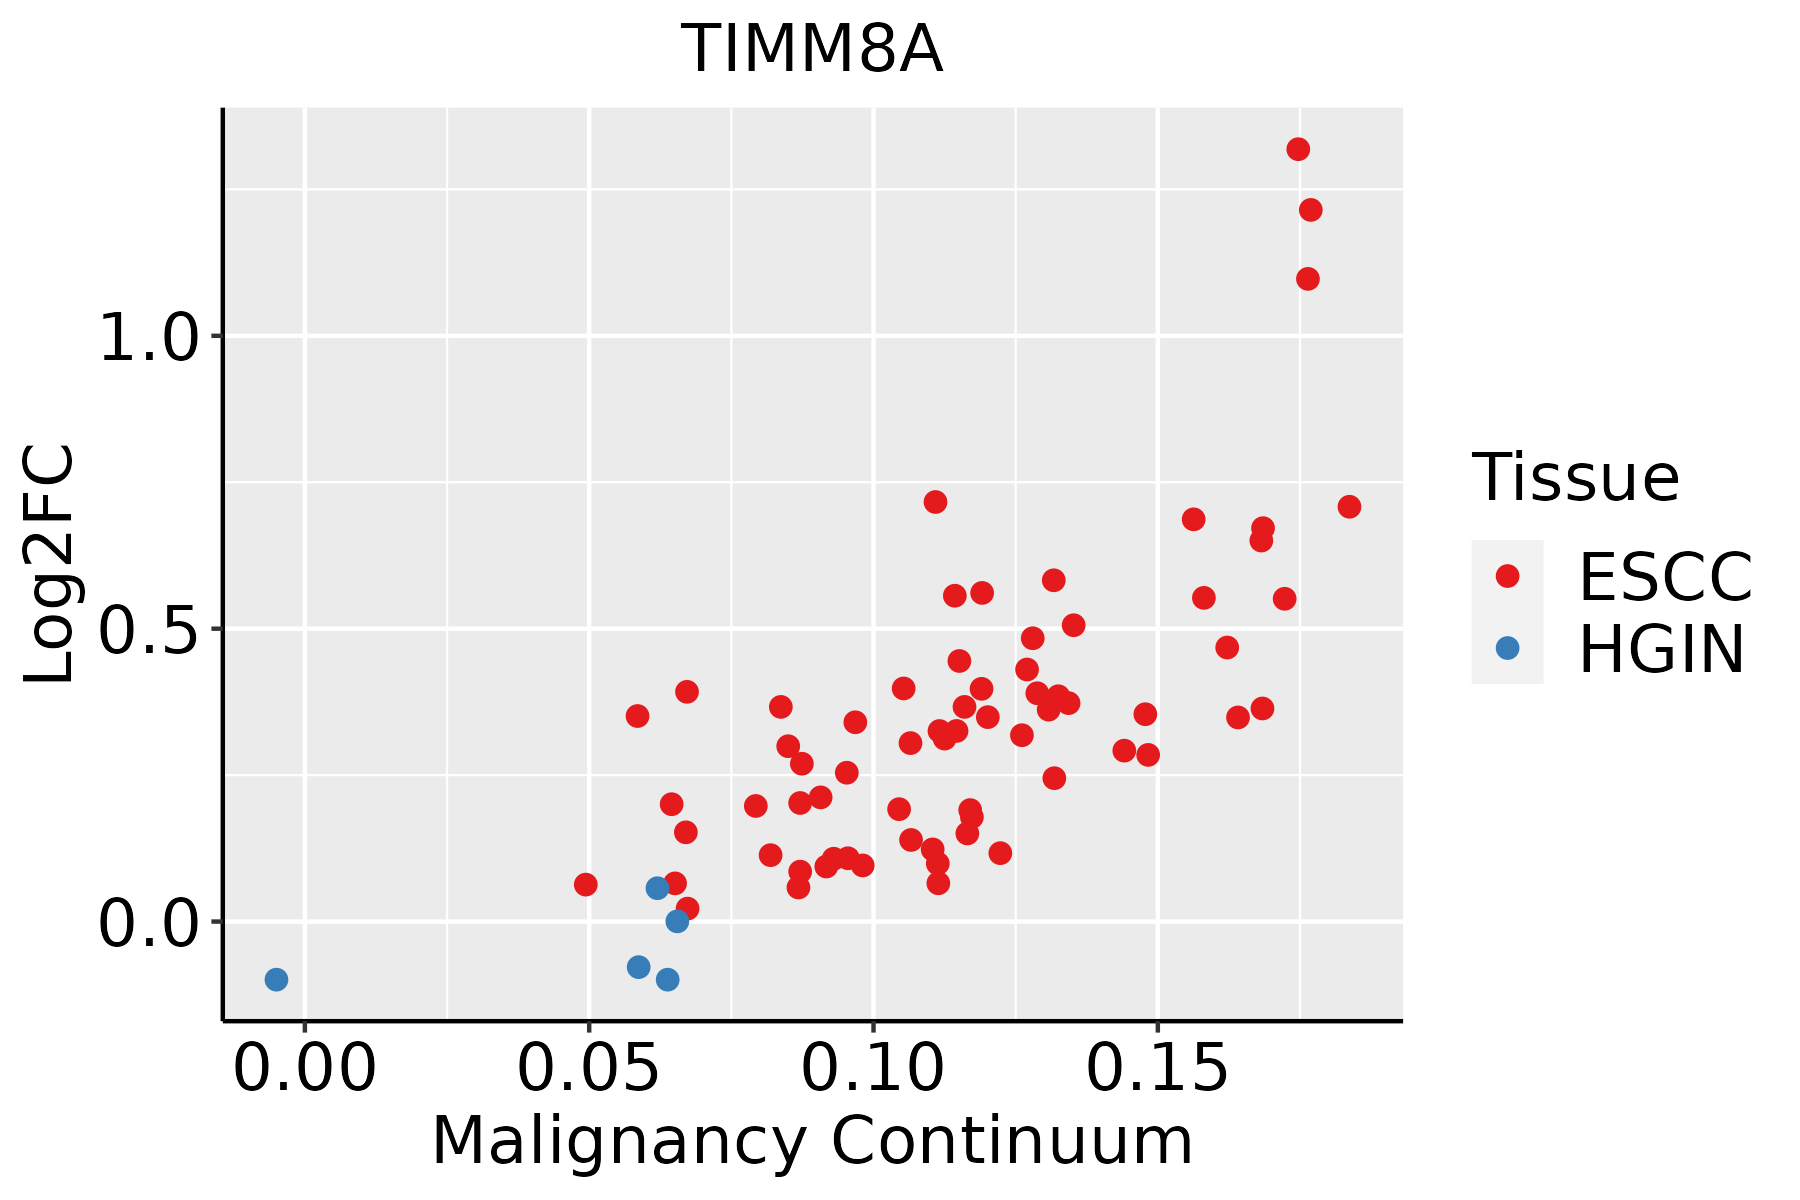 | ESCC: Esophageal squamous cell carcinoma |
| HGIN: High-grade intraepithelial neoplasias | ||
| LGIN: Low-grade intraepithelial neoplasias | ||
| Liver | 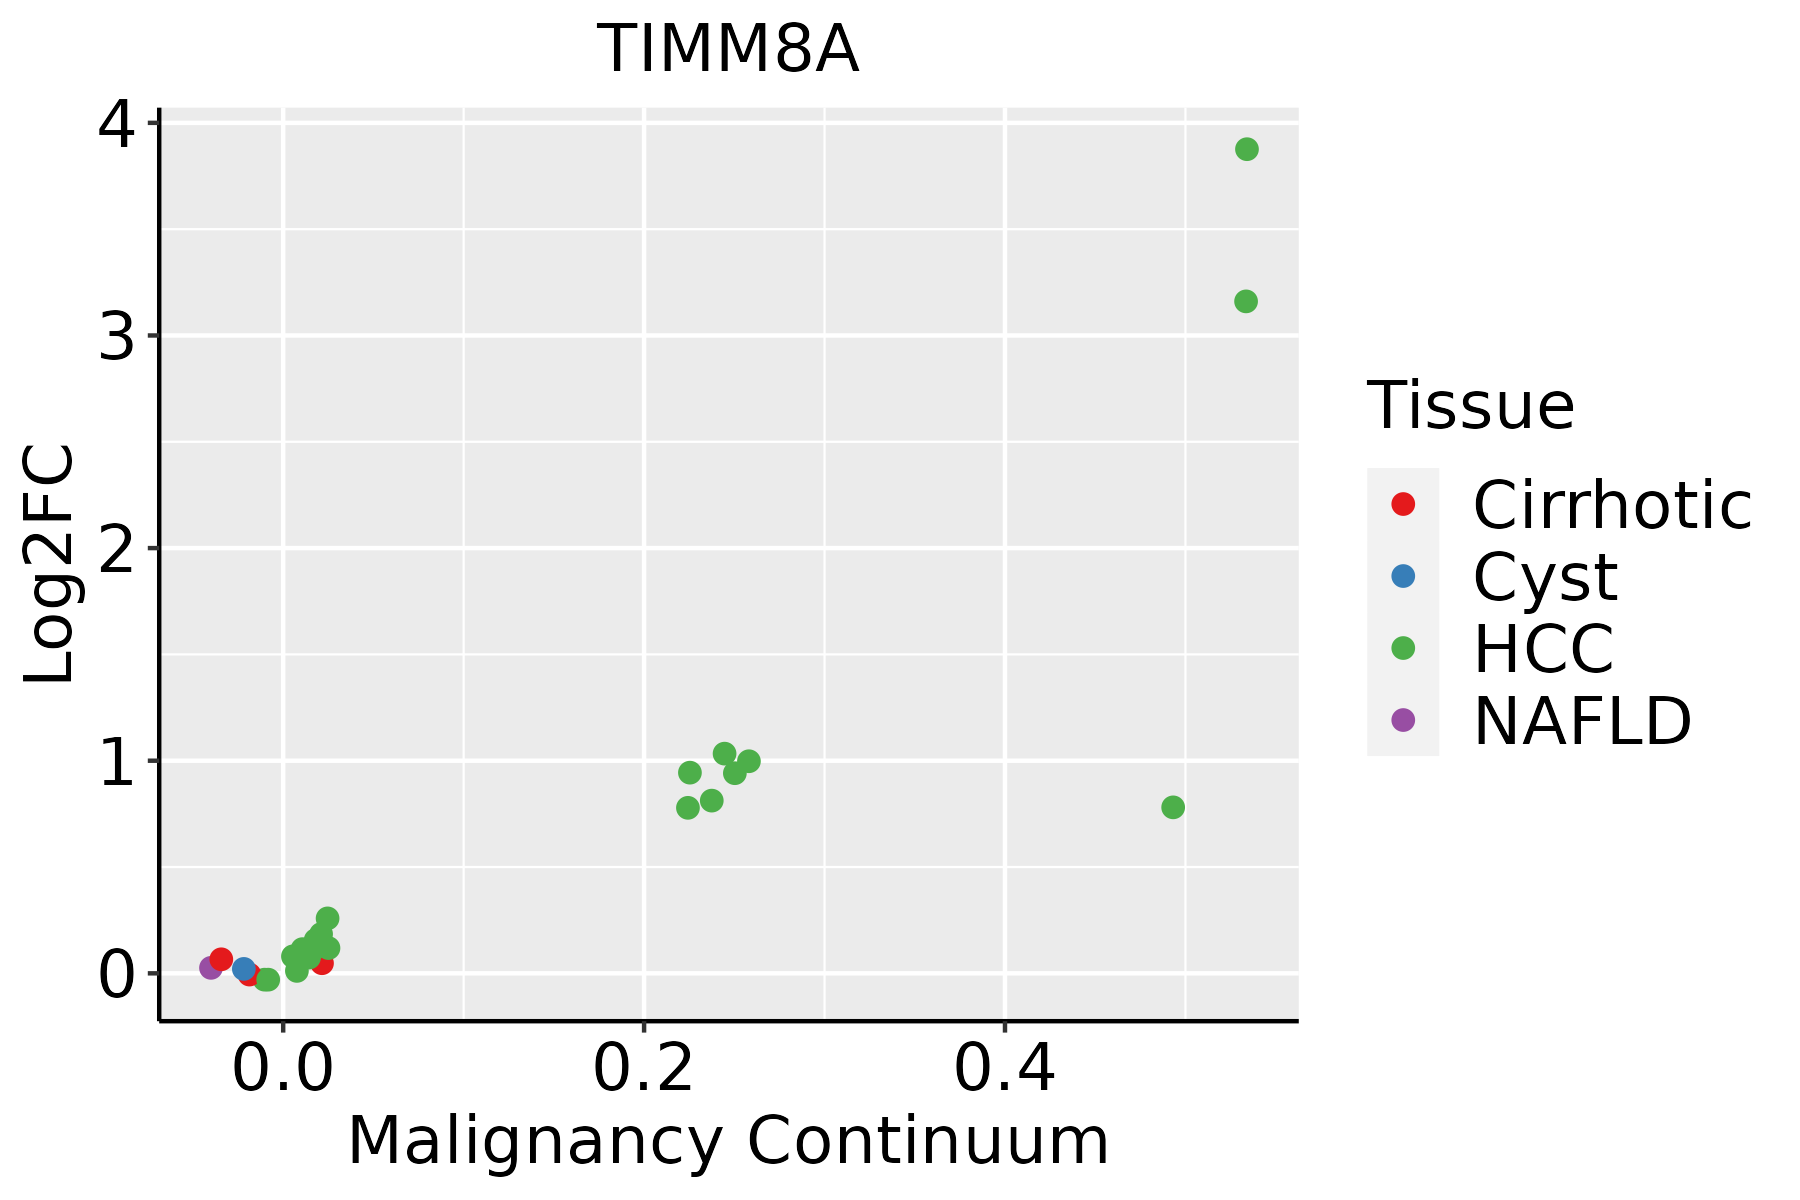 | HCC: Hepatocellular carcinoma |
| NAFLD: Non-alcoholic fatty liver disease | ||
| Oral Cavity | 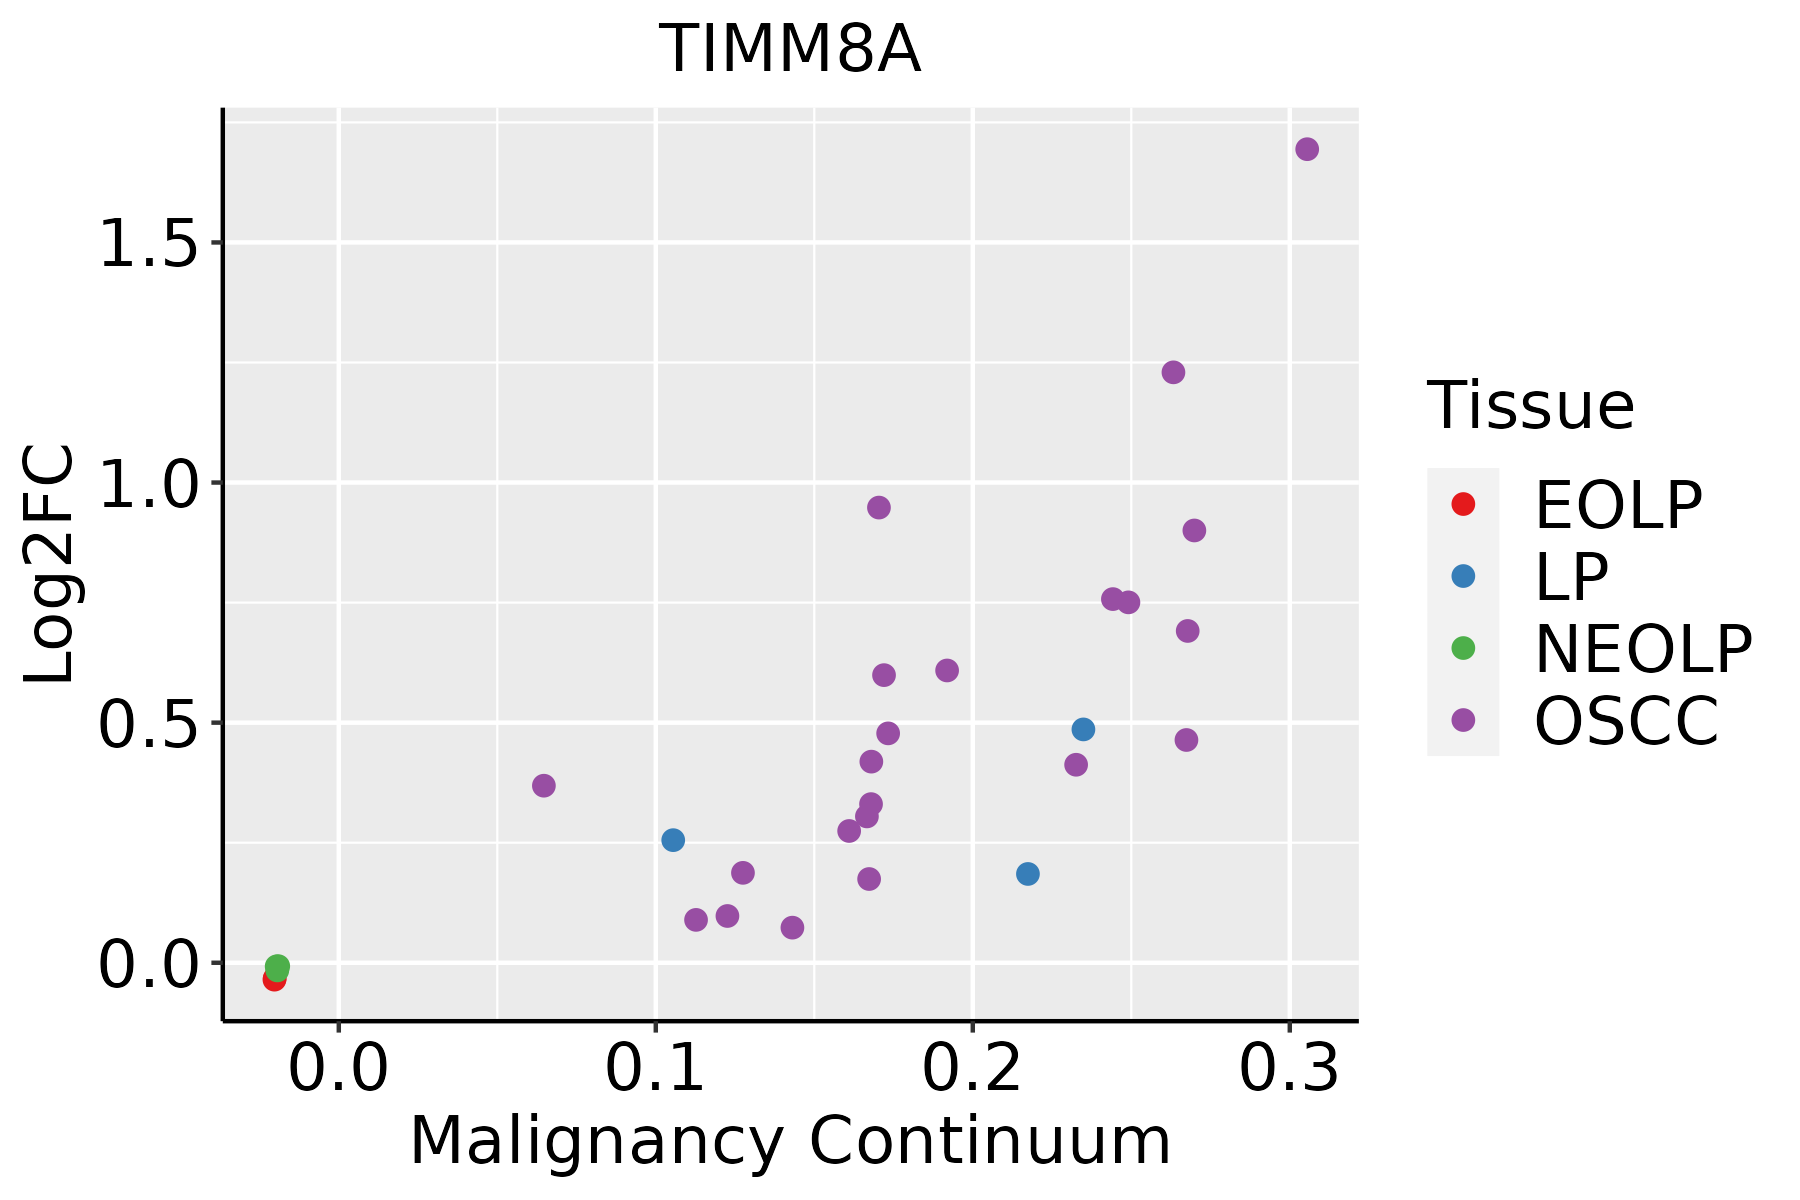 | EOLP: Erosive Oral lichen planus |
| LP: leukoplakia | ||
| NEOLP: Non-erosive oral lichen planus | ||
| OSCC: Oral squamous cell carcinoma |
| ∗log2FC in expression of this searched gene in stem-like cells from each diseased tissue sample relative to stem-like cells in normal samples in each tissue plotted against the malignancy continuum. Samples are colored based on if they are from different disease stage. |
Top |
Malignant transformation related pathway analysis |
| Find out the enriched GO biological processes and KEGG pathways involved in transition from healthy to precancer to cancer |
| Tissue | Disease Stage | Enriched GO biological Processes |
| Colorectum | AD |  |
| Colorectum | SER |  |
| Colorectum | MSS |  |
| Colorectum | MSI-H |  |
| Colorectum | FAP |  |
| ∗Top 15 enriched GO BP terms are showed in the bar plot of each disease state in each tissue. Each row represents a significant GO biological process which is colored according to the -log10(p.adjust). |
| Page: 1 2 3 4 5 6 7 8 9 |
| GO ID | Tissue | Disease Stage | Description | Gene Ratio | Bg Ratio | pvalue | p.adjust | Count |
| GO:0072594110 | Esophagus | ESCC | establishment of protein localization to organelle | 311/8552 | 422/18723 | 3.02e-32 | 2.13e-29 | 311 |
| GO:0006605111 | Esophagus | ESCC | protein targeting | 229/8552 | 314/18723 | 4.93e-23 | 1.01e-20 | 229 |
| GO:0006839110 | Esophagus | ESCC | mitochondrial transport | 187/8552 | 254/18723 | 8.35e-20 | 9.81e-18 | 187 |
| GO:0090150110 | Esophagus | ESCC | establishment of protein localization to membrane | 182/8552 | 260/18723 | 1.27e-15 | 8.19e-14 | 182 |
| GO:0072655110 | Esophagus | ESCC | establishment of protein localization to mitochondrion | 97/8552 | 120/18723 | 2.17e-15 | 1.33e-13 | 97 |
| GO:0070585110 | Esophagus | ESCC | protein localization to mitochondrion | 100/8552 | 125/18723 | 2.96e-15 | 1.77e-13 | 100 |
| GO:000700619 | Esophagus | ESCC | mitochondrial membrane organization | 93/8552 | 116/18723 | 2.16e-14 | 1.11e-12 | 93 |
| GO:0006626110 | Esophagus | ESCC | protein targeting to mitochondrion | 81/8552 | 100/18723 | 3.60e-13 | 1.67e-11 | 81 |
| GO:005120515 | Esophagus | ESCC | protein insertion into membrane | 46/8552 | 57/18723 | 5.90e-08 | 1.04e-06 | 46 |
| GO:009015118 | Esophagus | ESCC | establishment of protein localization to mitochondrial membrane | 26/8552 | 30/18723 | 3.79e-06 | 4.12e-05 | 26 |
| GO:000700713 | Esophagus | ESCC | inner mitochondrial membrane organization | 31/8552 | 38/18723 | 5.93e-06 | 6.10e-05 | 31 |
| GO:005120416 | Esophagus | ESCC | protein insertion into mitochondrial membrane | 21/8552 | 25/18723 | 9.12e-05 | 6.54e-04 | 21 |
| GO:00450393 | Esophagus | ESCC | protein insertion into mitochondrial inner membrane | 11/8552 | 12/18723 | 1.26e-03 | 6.06e-03 | 11 |
| GO:007259422 | Liver | HCC | establishment of protein localization to organelle | 299/7958 | 422/18723 | 1.06e-32 | 6.10e-30 | 299 |
| GO:000660512 | Liver | HCC | protein targeting | 219/7958 | 314/18723 | 7.74e-23 | 1.49e-20 | 219 |
| GO:000683912 | Liver | HCC | mitochondrial transport | 184/7958 | 254/18723 | 2.30e-22 | 3.83e-20 | 184 |
| GO:007265512 | Liver | HCC | establishment of protein localization to mitochondrion | 98/7958 | 120/18723 | 1.18e-18 | 1.46e-16 | 98 |
| GO:007058512 | Liver | HCC | protein localization to mitochondrion | 101/7958 | 125/18723 | 1.53e-18 | 1.86e-16 | 101 |
| GO:000662612 | Liver | HCC | protein targeting to mitochondrion | 82/7958 | 100/18723 | 4.93e-16 | 4.05e-14 | 82 |
| GO:009015012 | Liver | HCC | establishment of protein localization to membrane | 168/7958 | 260/18723 | 4.07e-13 | 2.13e-11 | 168 |
| Page: 1 2 3 |
| Pathway ID | Tissue | Disease Stage | Description | Gene Ratio | Bg Ratio | pvalue | p.adjust | qvalue | Count |
| Page: 1 |
Top |
Cell-cell communication analysis |
| Identification of potential cell-cell interactions between two cell types and their ligand-receptor pairs for different disease states |
| Ligand | Receptor | LRpair | Pathway | Tissue | Disease Stage |
| Page: 1 |
Top |
Single-cell gene regulatory network inference analysis |
| Find out the significant the regulons (TFs) and the target genes of each regulon across cell types for different disease states |
| TF | Cell Type | Tissue | Disease Stage | Target Gene | RSS | Regulon Activity |
| TIMM8A | BN | Esophagus | ADJ | PTRH1,CUEDC2,CINP, etc. | 3.58e-02 |  |
| TIMM8A | BN | Esophagus | ESCC | PTRH1,CUEDC2,CINP, etc. | 1.27e-01 |  |
| TIMM8A | CD8TEREX | Liver | Healthy | DPM1,RNF44,SLC7A5, etc. | 7.78e-03 |  |
| TIMM8A | CD8TCM | Liver | Healthy | DPM1,RNF44,SLC7A5, etc. | 7.24e-03 | |
| ∗The dot plots of a searched regulon are shown for all cell subpopulations in each disease state of each tissue based on the regulon specific score inferred using pySCENIC and by calculating the average expression. |
| Page: 1 |
Top |
Somatic mutation of malignant transformation related genes |
| Annotation of somatic variants for genes involved in malignant transformation |
| Hugo Symbol | Variant Class | Variant Classification | dbSNP RS | HGVSc | HGVSp | HGVSp Short | SWISSPROT | BIOTYPE | SIFT | PolyPhen | Tumor Sample Barcode | Tissue | Histology | Sex | Age | Stage | Therapy Types | Drugs | Outcome |
| TIMM8A | SNV | Missense_Mutation | c.190N>A | p.Val64Met | p.V64M | O60220 | protein_coding | deleterious(0.01) | probably_damaging(0.951) | TCGA-E2-A1LH-01 | Breast | breast invasive carcinoma | Female | <65 | I/II | Chemotherapy | adriamycin | SD | |
| TIMM8A | SNV | Missense_Mutation | c.80N>A | p.Thr27Asn | p.T27N | O60220 | protein_coding | tolerated(0.16) | benign(0.229) | TCGA-GM-A2DB-01 | Breast | breast invasive carcinoma | Female | <65 | I/II | Chemotherapy | taxol | CR | |
| TIMM8A | SNV | Missense_Mutation | c.173N>A | p.Arg58Gln | p.R58Q | O60220 | protein_coding | tolerated(0.12) | benign(0.05) | TCGA-VS-A8QF-01 | Cervix | cervical & endocervical cancer | Female | <65 | I/II | Chemotherapy | cisplatin | CR | |
| TIMM8A | SNV | Missense_Mutation | rs781878654 | c.206N>A | p.Arg69His | p.R69H | O60220 | protein_coding | tolerated(0.05) | benign(0.175) | TCGA-CM-4743-01 | Colorectum | colon adenocarcinoma | Male | >=65 | I/II | Chemotherapy | capecitabine | SD |
| TIMM8A | SNV | Missense_Mutation | rs781878654 | c.206N>A | p.Arg69His | p.R69H | O60220 | protein_coding | tolerated(0.05) | benign(0.175) | TCGA-AX-A0J1-01 | Endometrium | uterine corpus endometrioid carcinoma | Female | >=65 | I/II | Unknown | Unknown | SD |
| TIMM8A | SNV | Missense_Mutation | c.91N>T | p.Arg31Cys | p.R31C | O60220 | protein_coding | tolerated(0.16) | benign(0.066) | TCGA-B5-A0JY-01 | Endometrium | uterine corpus endometrioid carcinoma | Female | <65 | III/IV | Chemotherapy | doxorubicin | SD | |
| TIMM8A | SNV | Missense_Mutation | c.225G>C | p.Gln75His | p.Q75H | O60220 | protein_coding | tolerated(0.25) | benign(0.025) | TCGA-BG-A0MU-01 | Endometrium | uterine corpus endometrioid carcinoma | Female | >=65 | III/IV | Hormone Therapy | megace | SD | |
| TIMM8A | SNV | Missense_Mutation | novel | c.145N>T | p.Asp49Tyr | p.D49Y | O60220 | protein_coding | deleterious(0) | probably_damaging(0.93) | TCGA-DF-A2KU-01 | Endometrium | uterine corpus endometrioid carcinoma | Female | Unknown | I/II | Unknown | Unknown | SD |
| TIMM8A | SNV | Missense_Mutation | novel | c.257N>C | p.Lys86Thr | p.K86T | O60220 | protein_coding | deleterious(0) | benign(0.015) | TCGA-E6-A1LX-01 | Endometrium | uterine corpus endometrioid carcinoma | Female | <65 | I/II | Unknown | Unknown | SD |
| TIMM8A | SNV | Missense_Mutation | novel | c.205N>T | p.Arg69Cys | p.R69C | O60220 | protein_coding | deleterious(0.03) | benign(0.175) | TCGA-SJ-A6ZI-01 | Endometrium | uterine corpus endometrioid carcinoma | Female | <65 | I/II | Unknown | Unknown | SD |
| Page: 1 2 |
Top |
Related drugs of malignant transformation related genes |
| Identification of chemicals and drugs interact with genes involved in malignant transfromation |
| (DGIdb 4.0) |
| Entrez ID | Symbol | Category | Interaction Types | Drug Claim Name | Drug Name | PMIDs |
| Page: 1 |

Copyright 2023-Present -The University of Texas Health Science Center at Houston |