
|
|||||
|
 | |
| |
| |
| |
| |
| |
|
Gene: TIMM44 |
Gene summary for TIMM44 |
| Gene information | Species | Human | Gene symbol | TIMM44 | Gene ID | 10469 |
| Gene name | translocase of inner mitochondrial membrane 44 | |
| Gene Alias | TIM44 | |
| Cytomap | 19p13.2 | |
| Gene Type | protein-coding | GO ID | GO:0006605 | UniProtAcc | O43615 |
Top |
Malignant transformation analysis |
| Identification of the aberrant gene expression in precancerous and cancerous lesions by comparing the gene expression of stem-like cells in diseased tissues with normal stem cells |
| Entrez ID | Symbol | Replicates | Species | Organ | Tissue | Adj P-value | Log2FC | Malignancy |
| 10469 | TIMM44 | LZE4T | Human | Esophagus | ESCC | 1.26e-08 | 1.85e-01 | 0.0811 |
| 10469 | TIMM44 | LZE7T | Human | Esophagus | ESCC | 3.67e-09 | 3.66e-01 | 0.0667 |
| 10469 | TIMM44 | LZE8T | Human | Esophagus | ESCC | 1.43e-04 | 1.38e-01 | 0.067 |
| 10469 | TIMM44 | LZE20T | Human | Esophagus | ESCC | 2.65e-04 | 4.68e-02 | 0.0662 |
| 10469 | TIMM44 | LZE22T | Human | Esophagus | ESCC | 8.88e-04 | 1.56e-01 | 0.068 |
| 10469 | TIMM44 | LZE24T | Human | Esophagus | ESCC | 2.24e-17 | 3.49e-01 | 0.0596 |
| 10469 | TIMM44 | LZE21T | Human | Esophagus | ESCC | 4.39e-05 | 2.70e-01 | 0.0655 |
| 10469 | TIMM44 | P1T-E | Human | Esophagus | ESCC | 2.38e-09 | 3.36e-01 | 0.0875 |
| 10469 | TIMM44 | P2T-E | Human | Esophagus | ESCC | 5.15e-16 | 1.76e-01 | 0.1177 |
| 10469 | TIMM44 | P4T-E | Human | Esophagus | ESCC | 2.30e-16 | 3.59e-01 | 0.1323 |
| 10469 | TIMM44 | P5T-E | Human | Esophagus | ESCC | 4.59e-16 | 3.48e-01 | 0.1327 |
| 10469 | TIMM44 | P8T-E | Human | Esophagus | ESCC | 2.71e-17 | 2.98e-01 | 0.0889 |
| 10469 | TIMM44 | P9T-E | Human | Esophagus | ESCC | 1.82e-20 | 4.31e-01 | 0.1131 |
| 10469 | TIMM44 | P10T-E | Human | Esophagus | ESCC | 5.43e-27 | 5.40e-01 | 0.116 |
| 10469 | TIMM44 | P11T-E | Human | Esophagus | ESCC | 1.50e-15 | 3.33e-01 | 0.1426 |
| 10469 | TIMM44 | P12T-E | Human | Esophagus | ESCC | 1.67e-22 | 3.89e-01 | 0.1122 |
| 10469 | TIMM44 | P15T-E | Human | Esophagus | ESCC | 1.56e-18 | 3.53e-01 | 0.1149 |
| 10469 | TIMM44 | P16T-E | Human | Esophagus | ESCC | 4.13e-18 | 1.49e-01 | 0.1153 |
| 10469 | TIMM44 | P17T-E | Human | Esophagus | ESCC | 2.08e-10 | 4.01e-01 | 0.1278 |
| 10469 | TIMM44 | P19T-E | Human | Esophagus | ESCC | 2.09e-04 | 5.78e-01 | 0.1662 |
| Page: 1 2 3 4 5 6 7 |
| Tissue | Expression Dynamics | Abbreviation |
| Esophagus |  | ESCC: Esophageal squamous cell carcinoma |
| HGIN: High-grade intraepithelial neoplasias | ||
| LGIN: Low-grade intraepithelial neoplasias | ||
| Liver | 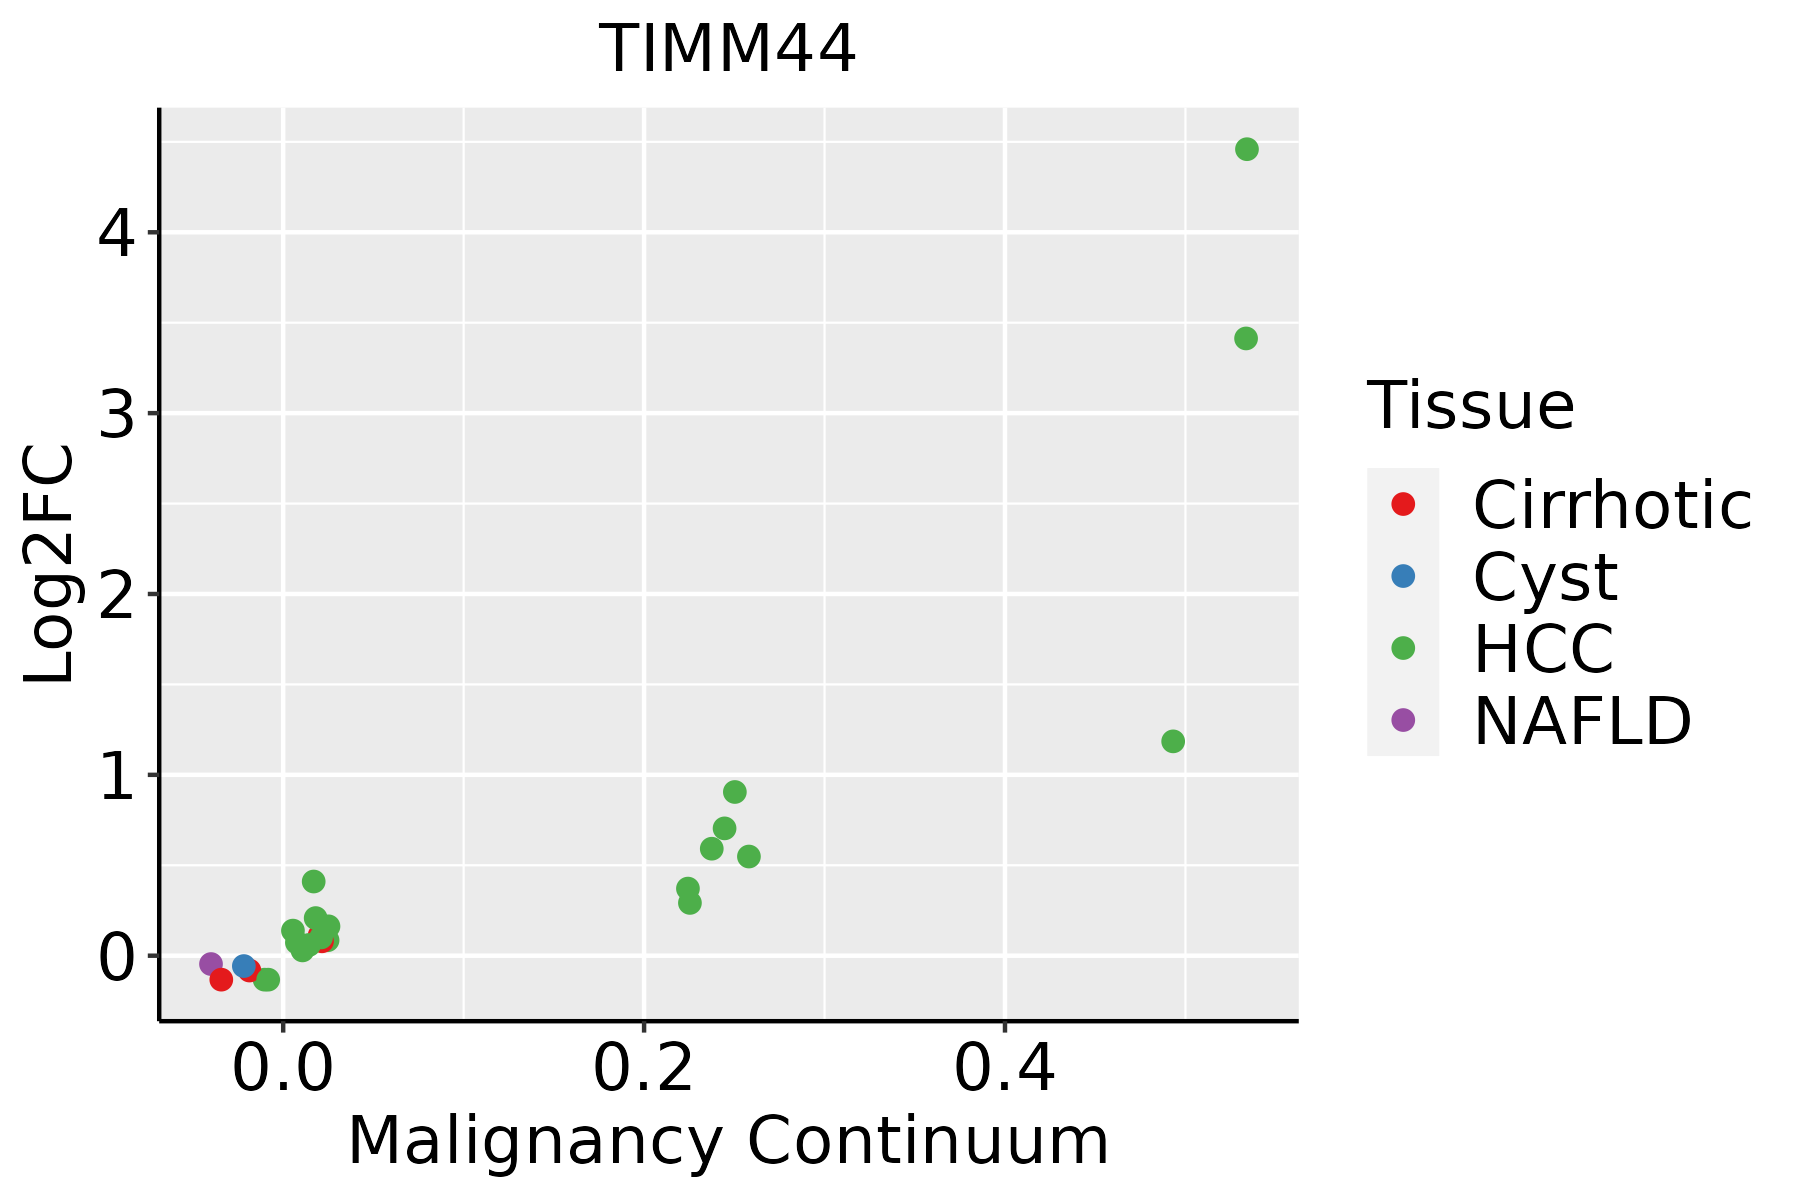 | HCC: Hepatocellular carcinoma |
| NAFLD: Non-alcoholic fatty liver disease | ||
| Oral Cavity | 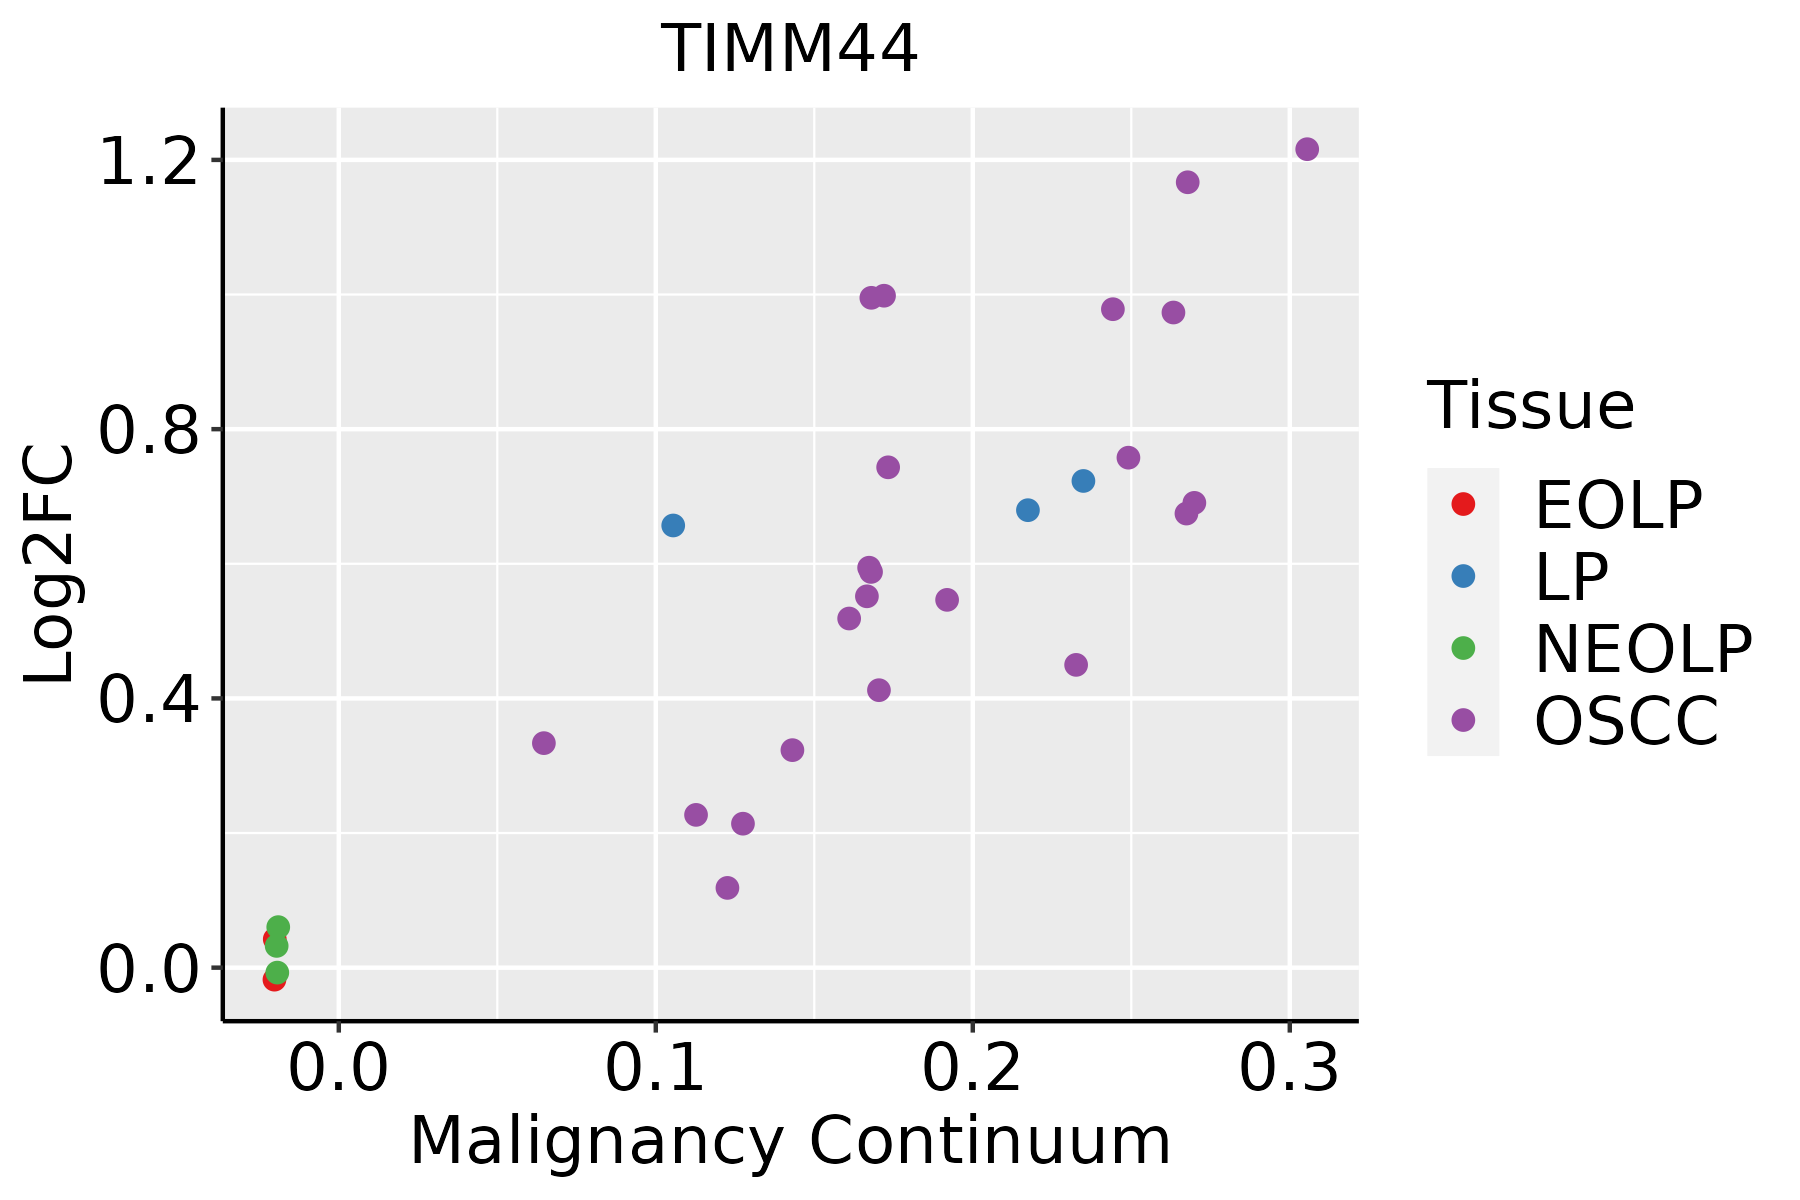 | EOLP: Erosive Oral lichen planus |
| LP: leukoplakia | ||
| NEOLP: Non-erosive oral lichen planus | ||
| OSCC: Oral squamous cell carcinoma | ||
| Skin | 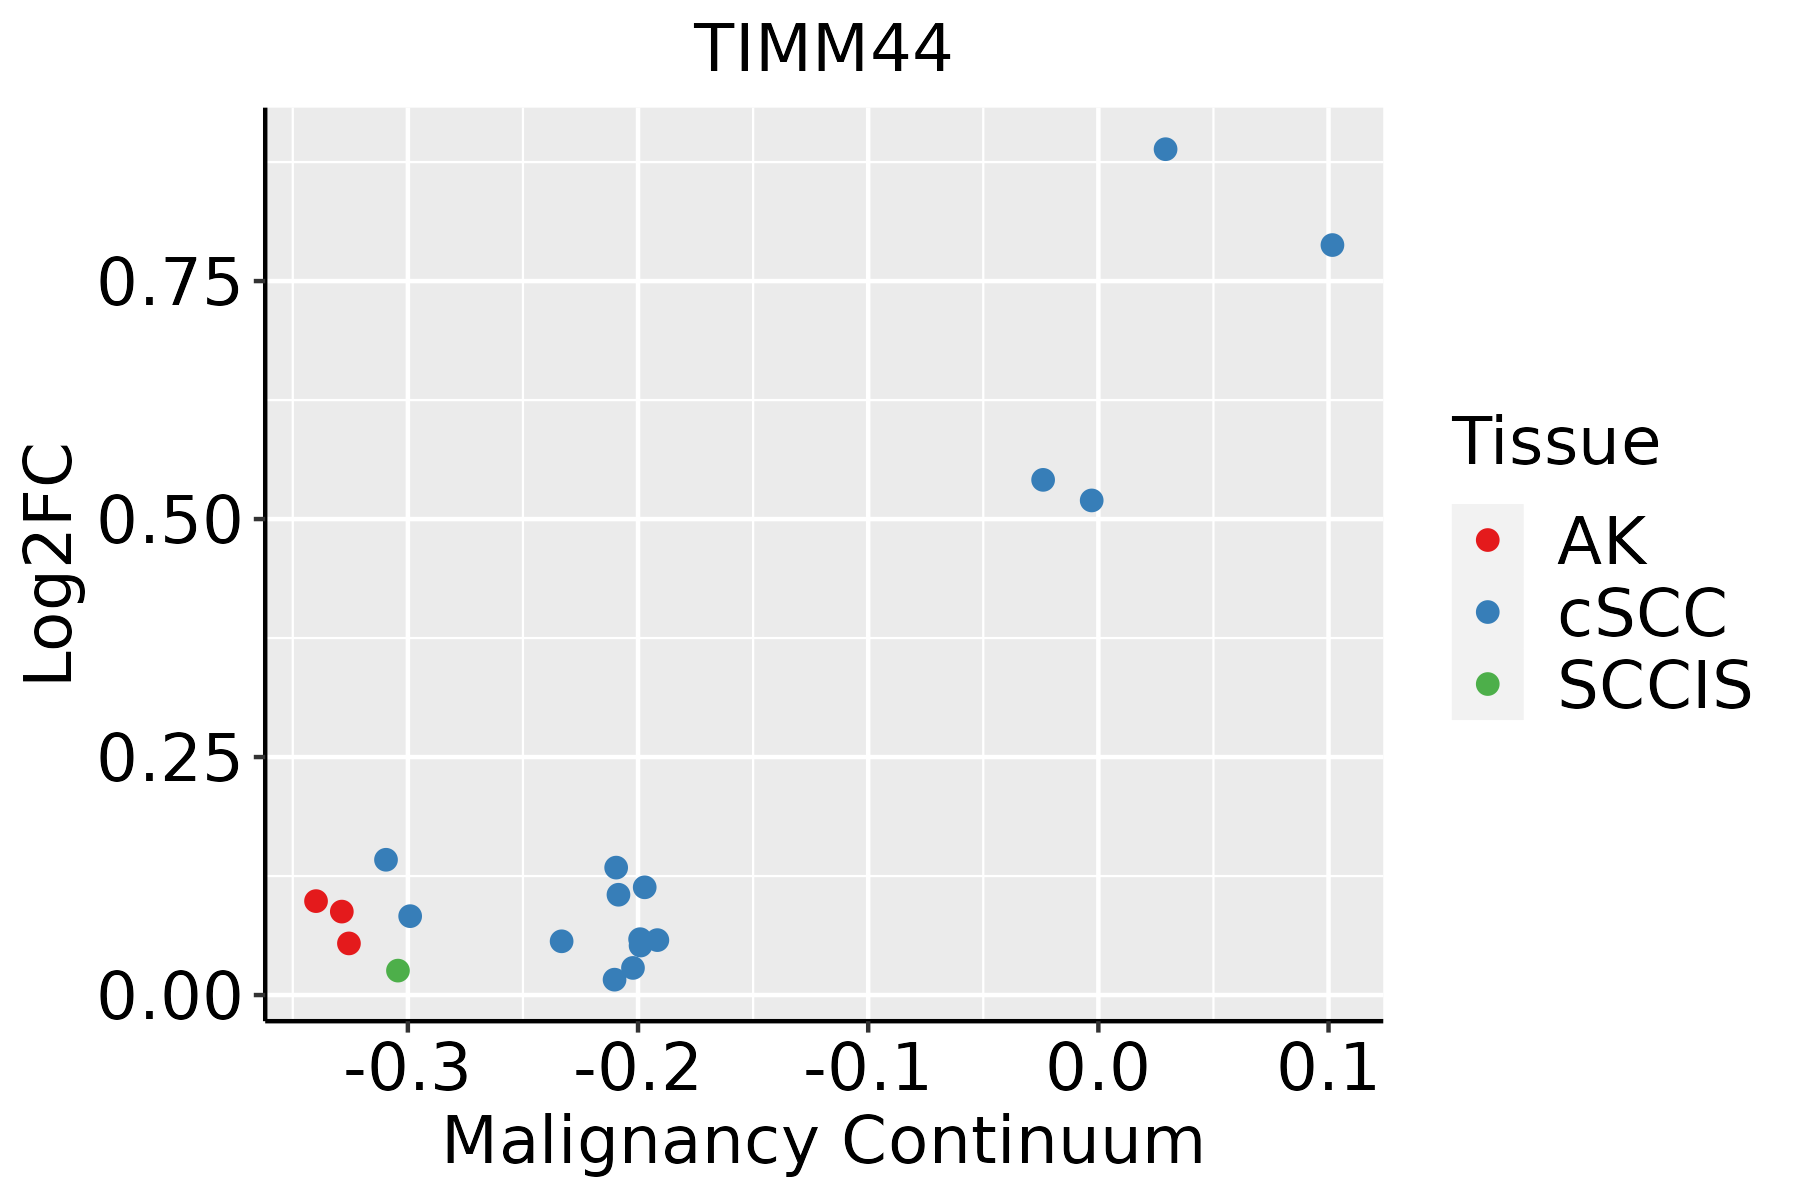 | AK: Actinic keratosis |
| cSCC: Cutaneous squamous cell carcinoma | ||
| SCCIS:squamous cell carcinoma in situ | ||
| Thyroid | 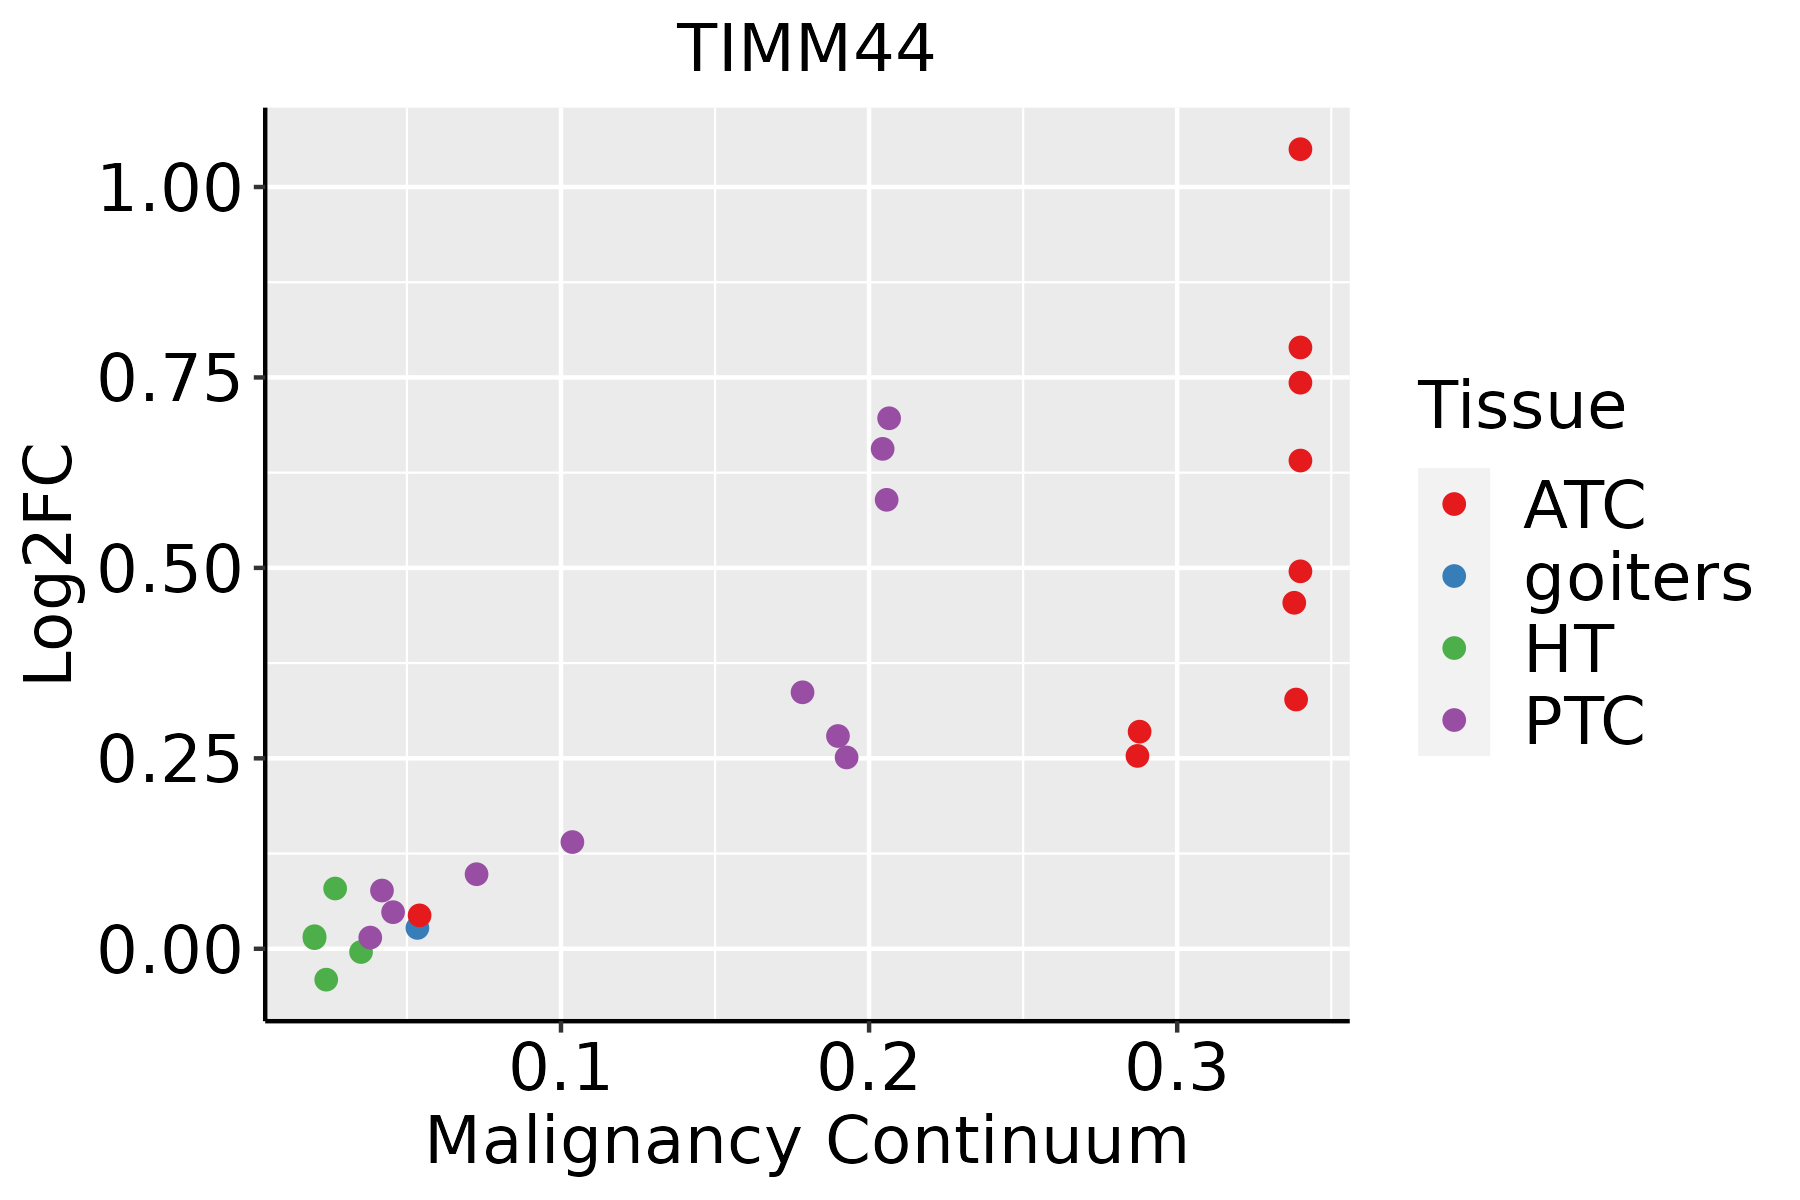 | ATC: Anaplastic thyroid cancer |
| HT: Hashimoto's thyroiditis | ||
| PTC: Papillary thyroid cancer |
| ∗log2FC in expression of this searched gene in stem-like cells from each diseased tissue sample relative to stem-like cells in normal samples in each tissue plotted against the malignancy continuum. Samples are colored based on if they are from different disease stage. |
Top |
Malignant transformation related pathway analysis |
| Find out the enriched GO biological processes and KEGG pathways involved in transition from healthy to precancer to cancer |
| Tissue | Disease Stage | Enriched GO biological Processes |
| Colorectum | AD |  |
| Colorectum | SER |  |
| Colorectum | MSS |  |
| Colorectum | MSI-H |  |
| Colorectum | FAP |  |
| ∗Top 15 enriched GO BP terms are showed in the bar plot of each disease state in each tissue. Each row represents a significant GO biological process which is colored according to the -log10(p.adjust). |
| Page: 1 2 3 4 5 6 7 8 9 |
| GO ID | Tissue | Disease Stage | Description | Gene Ratio | Bg Ratio | pvalue | p.adjust | Count |
| GO:0072594110 | Esophagus | ESCC | establishment of protein localization to organelle | 311/8552 | 422/18723 | 3.02e-32 | 2.13e-29 | 311 |
| GO:0006605111 | Esophagus | ESCC | protein targeting | 229/8552 | 314/18723 | 4.93e-23 | 1.01e-20 | 229 |
| GO:0006839110 | Esophagus | ESCC | mitochondrial transport | 187/8552 | 254/18723 | 8.35e-20 | 9.81e-18 | 187 |
| GO:0072655110 | Esophagus | ESCC | establishment of protein localization to mitochondrion | 97/8552 | 120/18723 | 2.17e-15 | 1.33e-13 | 97 |
| GO:0070585110 | Esophagus | ESCC | protein localization to mitochondrion | 100/8552 | 125/18723 | 2.96e-15 | 1.77e-13 | 100 |
| GO:001703818 | Esophagus | ESCC | protein import | 149/8552 | 206/18723 | 5.90e-15 | 3.31e-13 | 149 |
| GO:0006626110 | Esophagus | ESCC | protein targeting to mitochondrion | 81/8552 | 100/18723 | 3.60e-13 | 1.67e-11 | 81 |
| GO:00718069 | Esophagus | ESCC | protein transmembrane transport | 47/8552 | 59/18723 | 9.02e-08 | 1.51e-06 | 47 |
| GO:1990542110 | Esophagus | ESCC | mitochondrial transmembrane transport | 72/8552 | 102/18723 | 2.94e-07 | 4.23e-06 | 72 |
| GO:00650026 | Esophagus | ESCC | intracellular protein transmembrane transport | 40/8552 | 51/18723 | 1.76e-06 | 2.08e-05 | 40 |
| GO:00447433 | Esophagus | ESCC | protein transmembrane import into intracellular organelle | 29/8552 | 36/18723 | 1.91e-05 | 1.67e-04 | 29 |
| GO:00301503 | Esophagus | ESCC | protein import into mitochondrial matrix | 16/8552 | 20/18723 | 1.85e-03 | 8.40e-03 | 16 |
| GO:007259412 | Liver | Cirrhotic | establishment of protein localization to organelle | 189/4634 | 422/18723 | 1.01e-19 | 2.45e-17 | 189 |
| GO:00066057 | Liver | Cirrhotic | protein targeting | 148/4634 | 314/18723 | 3.86e-18 | 6.20e-16 | 148 |
| GO:00068397 | Liver | Cirrhotic | mitochondrial transport | 112/4634 | 254/18723 | 1.03e-11 | 6.66e-10 | 112 |
| GO:00705857 | Liver | Cirrhotic | protein localization to mitochondrion | 65/4634 | 125/18723 | 4.91e-11 | 2.77e-09 | 65 |
| GO:00726557 | Liver | Cirrhotic | establishment of protein localization to mitochondrion | 63/4634 | 120/18723 | 5.70e-11 | 3.19e-09 | 63 |
| GO:00066267 | Liver | Cirrhotic | protein targeting to mitochondrion | 53/4634 | 100/18723 | 1.19e-09 | 5.27e-08 | 53 |
| GO:00718063 | Liver | Cirrhotic | protein transmembrane transport | 31/4634 | 59/18723 | 4.10e-06 | 6.90e-05 | 31 |
| GO:00170387 | Liver | Cirrhotic | protein import | 77/4634 | 206/18723 | 3.56e-05 | 4.32e-04 | 77 |
| Page: 1 2 3 4 5 |
| Pathway ID | Tissue | Disease Stage | Description | Gene Ratio | Bg Ratio | pvalue | p.adjust | qvalue | Count |
| Page: 1 |
Top |
Cell-cell communication analysis |
| Identification of potential cell-cell interactions between two cell types and their ligand-receptor pairs for different disease states |
| Ligand | Receptor | LRpair | Pathway | Tissue | Disease Stage |
| Page: 1 |
Top |
Single-cell gene regulatory network inference analysis |
| Find out the significant the regulons (TFs) and the target genes of each regulon across cell types for different disease states |
| TF | Cell Type | Tissue | Disease Stage | Target Gene | RSS | Regulon Activity |
| TIMM44 | SMC | Esophagus | ESCC | SLC7A5,CLDN1,DSP, etc. | 3.40e-02 |  |
| ∗The dot plots of a searched regulon are shown for all cell subpopulations in each disease state of each tissue based on the regulon specific score inferred using pySCENIC and by calculating the average expression. |
| Page: 1 |
Top |
Somatic mutation of malignant transformation related genes |
| Annotation of somatic variants for genes involved in malignant transformation |
| Hugo Symbol | Variant Class | Variant Classification | dbSNP RS | HGVSc | HGVSp | HGVSp Short | SWISSPROT | BIOTYPE | SIFT | PolyPhen | Tumor Sample Barcode | Tissue | Histology | Sex | Age | Stage | Therapy Types | Drugs | Outcome |
| TIMM44 | SNV | Missense_Mutation | novel | c.1324N>A | p.Asp442Asn | p.D442N | O43615 | protein_coding | deleterious(0) | probably_damaging(0.991) | TCGA-AC-A5XU-01 | Breast | breast invasive carcinoma | Female | >=65 | I/II | Hormone Therapy | letrozole | SD |
| TIMM44 | SNV | Missense_Mutation | c.543N>T | p.Gln181His | p.Q181H | O43615 | protein_coding | deleterious(0.05) | benign(0.106) | TCGA-AN-A0AT-01 | Breast | breast invasive carcinoma | Female | <65 | I/II | Unknown | Unknown | SD | |
| TIMM44 | SNV | Missense_Mutation | novel | c.890C>T | p.Ser297Leu | p.S297L | O43615 | protein_coding | deleterious(0.03) | probably_damaging(0.989) | TCGA-EA-A3HU-01 | Cervix | cervical & endocervical cancer | Female | <65 | I/II | Unknown | Unknown | SD |
| TIMM44 | SNV | Missense_Mutation | rs143337629 | c.1307N>T | p.Ala436Val | p.A436V | O43615 | protein_coding | tolerated(0.12) | benign(0.305) | TCGA-MA-AA42-01 | Cervix | cervical & endocervical cancer | Female | >=65 | I/II | Unknown | Unknown | SD |
| TIMM44 | SNV | Missense_Mutation | c.783N>A | p.Met261Ile | p.M261I | O43615 | protein_coding | tolerated(0.24) | benign(0.269) | TCGA-AA-3492-01 | Colorectum | colon adenocarcinoma | Female | >=65 | I/II | Unknown | Unknown | SD | |
| TIMM44 | SNV | Missense_Mutation | rs764491703 | c.605G>A | p.Arg202Gln | p.R202Q | O43615 | protein_coding | tolerated(0.23) | benign(0.048) | TCGA-AA-A010-01 | Colorectum | colon adenocarcinoma | Female | <65 | I/II | Chemotherapy | folinic | CR |
| TIMM44 | SNV | Missense_Mutation | novel | c.303N>T | p.Arg101Ser | p.R101S | O43615 | protein_coding | deleterious(0) | probably_damaging(0.927) | TCGA-AA-A02R-01 | Colorectum | colon adenocarcinoma | Female | >=65 | I/II | Unknown | Unknown | PD |
| TIMM44 | SNV | Missense_Mutation | rs774365744 | c.622N>T | p.Arg208Trp | p.R208W | O43615 | protein_coding | deleterious(0) | probably_damaging(0.997) | TCGA-AD-6964-01 | Colorectum | colon adenocarcinoma | Male | <65 | III/IV | Chemotherapy | folfox | PD |
| TIMM44 | deletion | Frame_Shift_Del | c.249delA | p.Lys83AsnfsTer9 | p.K83Nfs*9 | O43615 | protein_coding | TCGA-AA-A022-01 | Colorectum | colon adenocarcinoma | Female | >=65 | I/II | Unknown | Unknown | SD | |||
| TIMM44 | deletion | Frame_Shift_Del | c.249delN | p.Lys83AsnfsTer9 | p.K83Nfs*9 | O43615 | protein_coding | TCGA-AZ-4313-01 | Colorectum | colon adenocarcinoma | Female | <65 | I/II | Unknown | Unknown | SD |
| Page: 1 2 3 4 5 |
Top |
Related drugs of malignant transformation related genes |
| Identification of chemicals and drugs interact with genes involved in malignant transfromation |
| (DGIdb 4.0) |
| Entrez ID | Symbol | Category | Interaction Types | Drug Claim Name | Drug Name | PMIDs |
| Page: 1 |

Copyright 2023-Present -The University of Texas Health Science Center at Houston |