
|
|||||
|
 | |
| |
| |
| |
| |
| |
|
Gene: TIMM29 |
Gene summary for TIMM29 |
| Gene information | Species | Human | Gene symbol | TIMM29 | Gene ID | 90580 |
| Gene name | translocase of inner mitochondrial membrane 29 | |
| Gene Alias | C19orf52 | |
| Cytomap | 19p13.2 | |
| Gene Type | protein-coding | GO ID | GO:0006605 | UniProtAcc | Q9BSF4 |
Top |
Malignant transformation analysis |
| Identification of the aberrant gene expression in precancerous and cancerous lesions by comparing the gene expression of stem-like cells in diseased tissues with normal stem cells |
| Entrez ID | Symbol | Replicates | Species | Organ | Tissue | Adj P-value | Log2FC | Malignancy |
| 90580 | TIMM29 | male-WTA | Human | Thyroid | PTC | 5.85e-06 | 1.48e-01 | 0.1037 |
| 90580 | TIMM29 | PTC01 | Human | Thyroid | PTC | 5.67e-05 | 1.39e-01 | 0.1899 |
| 90580 | TIMM29 | PTC04 | Human | Thyroid | PTC | 2.29e-02 | 1.09e-01 | 0.1927 |
| 90580 | TIMM29 | PTC05 | Human | Thyroid | PTC | 7.16e-14 | 4.03e-01 | 0.2065 |
| 90580 | TIMM29 | PTC06 | Human | Thyroid | PTC | 1.05e-18 | 3.99e-01 | 0.2057 |
| 90580 | TIMM29 | PTC07 | Human | Thyroid | PTC | 5.88e-09 | 2.42e-01 | 0.2044 |
| 90580 | TIMM29 | ATC12 | Human | Thyroid | ATC | 2.77e-07 | 1.90e-01 | 0.34 |
| 90580 | TIMM29 | ATC13 | Human | Thyroid | ATC | 2.80e-17 | 2.89e-01 | 0.34 |
| 90580 | TIMM29 | ATC2 | Human | Thyroid | ATC | 3.34e-11 | 8.01e-01 | 0.34 |
| 90580 | TIMM29 | ATC4 | Human | Thyroid | ATC | 6.40e-11 | 2.63e-01 | 0.34 |
| 90580 | TIMM29 | ATC5 | Human | Thyroid | ATC | 2.80e-17 | 3.24e-01 | 0.34 |
| Page: 1 |
| Tissue | Expression Dynamics | Abbreviation |
| Thyroid | 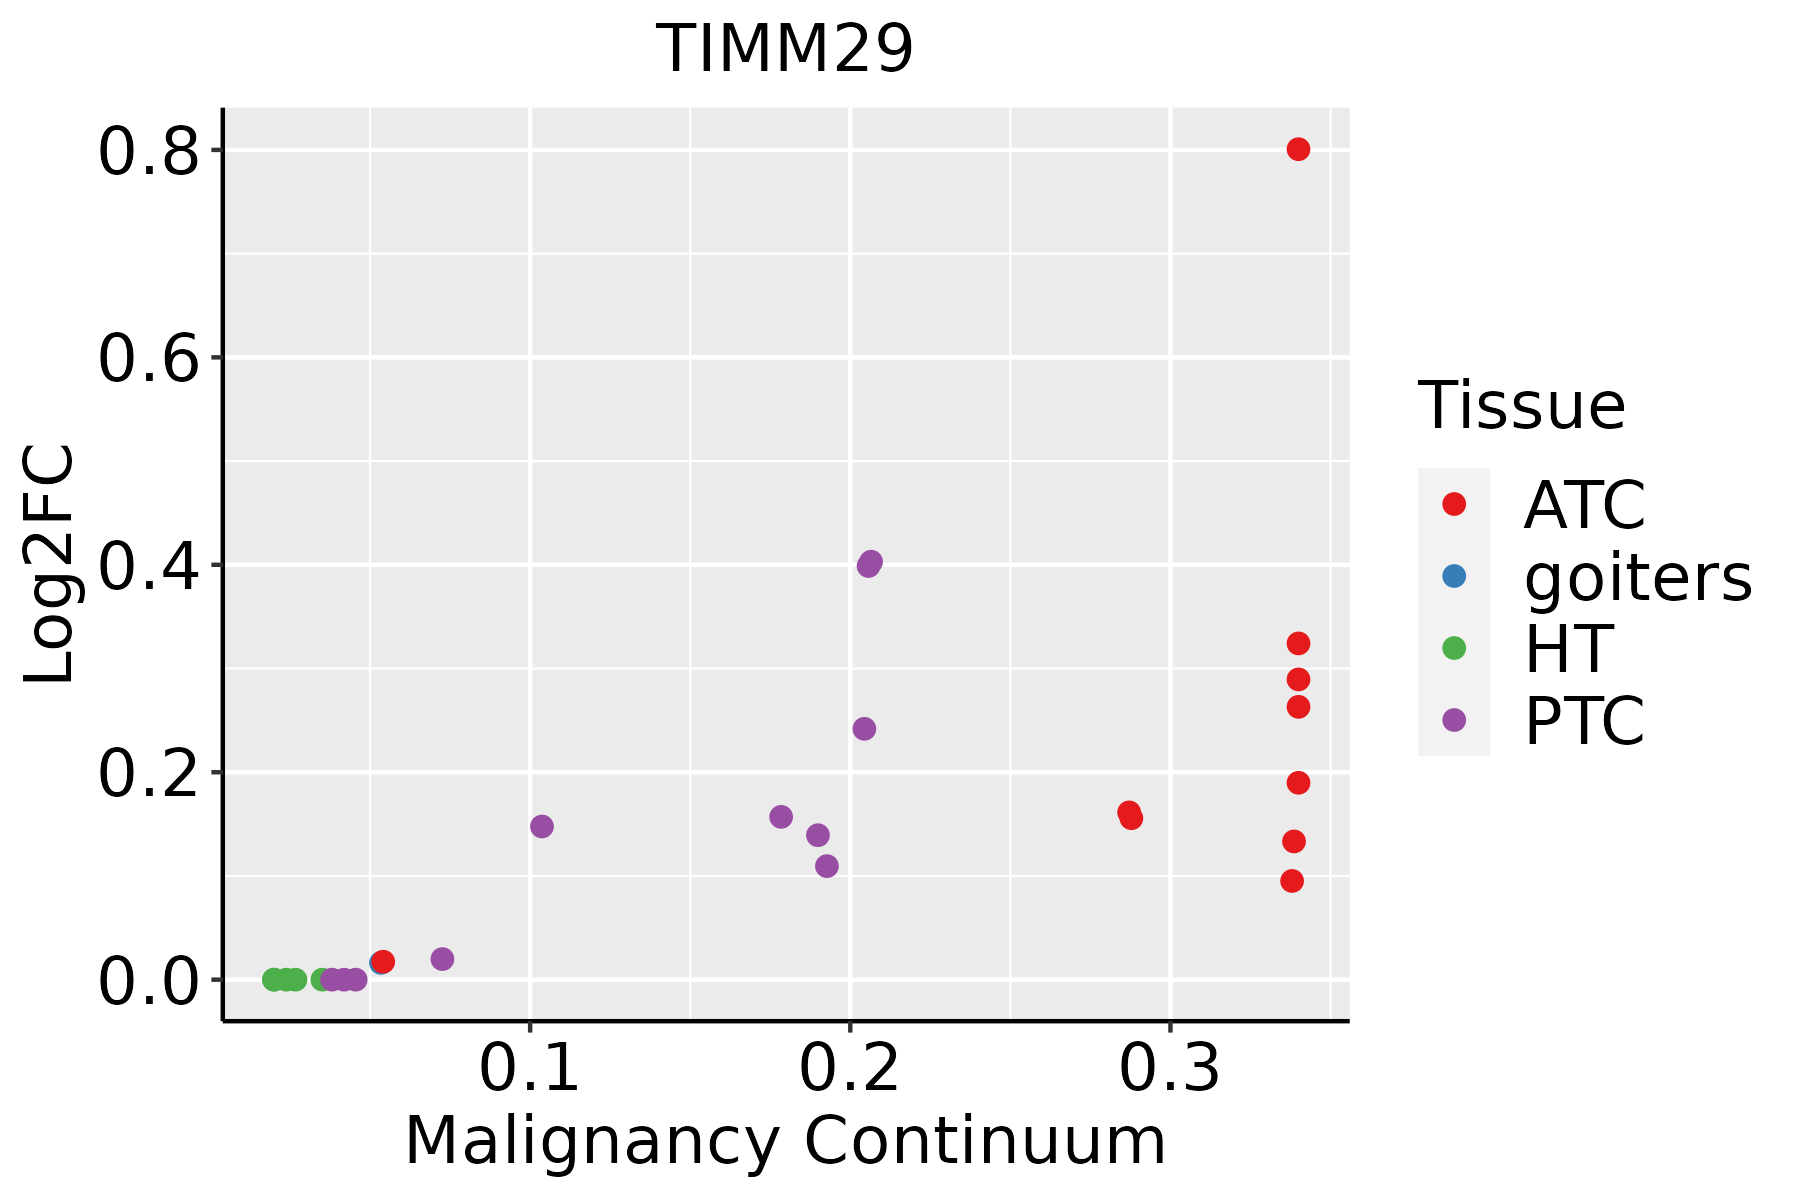 | ATC: Anaplastic thyroid cancer |
| HT: Hashimoto's thyroiditis | ||
| PTC: Papillary thyroid cancer |
| ∗log2FC in expression of this searched gene in stem-like cells from each diseased tissue sample relative to stem-like cells in normal samples in each tissue plotted against the malignancy continuum. Samples are colored based on if they are from different disease stage. |
Top |
Malignant transformation related pathway analysis |
| Find out the enriched GO biological processes and KEGG pathways involved in transition from healthy to precancer to cancer |
| Tissue | Disease Stage | Enriched GO biological Processes |
| Colorectum | AD |  |
| Colorectum | SER |  |
| Colorectum | MSS |  |
| Colorectum | MSI-H |  |
| Colorectum | FAP |  |
| ∗Top 15 enriched GO BP terms are showed in the bar plot of each disease state in each tissue. Each row represents a significant GO biological process which is colored according to the -log10(p.adjust). |
| Page: 1 2 3 4 5 6 7 8 9 |
| GO ID | Tissue | Disease Stage | Description | Gene Ratio | Bg Ratio | pvalue | p.adjust | Count |
| GO:0072594112 | Thyroid | PTC | establishment of protein localization to organelle | 244/5968 | 422/18723 | 1.18e-28 | 4.97e-26 | 244 |
| GO:0006605113 | Thyroid | PTC | protein targeting | 180/5968 | 314/18723 | 6.81e-21 | 1.19e-18 | 180 |
| GO:000683928 | Thyroid | PTC | mitochondrial transport | 150/5968 | 254/18723 | 2.76e-19 | 3.34e-17 | 150 |
| GO:0090150112 | Thyroid | PTC | establishment of protein localization to membrane | 149/5968 | 260/18723 | 1.64e-17 | 1.59e-15 | 149 |
| GO:0070585112 | Thyroid | PTC | protein localization to mitochondrion | 83/5968 | 125/18723 | 2.15e-15 | 1.56e-13 | 83 |
| GO:0072655112 | Thyroid | PTC | establishment of protein localization to mitochondrion | 80/5968 | 120/18723 | 4.87e-15 | 3.30e-13 | 80 |
| GO:0006626111 | Thyroid | PTC | protein targeting to mitochondrion | 67/5968 | 100/18723 | 5.55e-13 | 2.74e-11 | 67 |
| GO:000700624 | Thyroid | PTC | mitochondrial membrane organization | 68/5968 | 116/18723 | 2.47e-09 | 6.88e-08 | 68 |
| GO:00512059 | Thyroid | PTC | protein insertion into membrane | 35/5968 | 57/18723 | 4.20e-06 | 5.20e-05 | 35 |
| GO:009015120 | Thyroid | PTC | establishment of protein localization to mitochondrial membrane | 21/5968 | 30/18723 | 2.04e-05 | 2.06e-04 | 21 |
| GO:00070078 | Thyroid | PTC | inner mitochondrial membrane organization | 24/5968 | 38/18723 | 7.14e-05 | 6.19e-04 | 24 |
| GO:005120417 | Thyroid | PTC | protein insertion into mitochondrial membrane | 17/5968 | 25/18723 | 2.25e-04 | 1.64e-03 | 17 |
| GO:00450395 | Thyroid | PTC | protein insertion into mitochondrial inner membrane | 9/5968 | 12/18723 | 2.72e-03 | 1.36e-02 | 9 |
| GO:007259429 | Thyroid | ATC | establishment of protein localization to organelle | 247/6293 | 422/18723 | 2.88e-26 | 1.40e-23 | 247 |
| GO:000660533 | Thyroid | ATC | protein targeting | 180/6293 | 314/18723 | 3.54e-18 | 4.39e-16 | 180 |
| GO:000683929 | Thyroid | ATC | mitochondrial transport | 151/6293 | 254/18723 | 2.07e-17 | 2.14e-15 | 151 |
| GO:009015031 | Thyroid | ATC | establishment of protein localization to membrane | 150/6293 | 260/18723 | 1.05e-15 | 7.96e-14 | 150 |
| GO:007058533 | Thyroid | ATC | protein localization to mitochondrion | 83/6293 | 125/18723 | 6.24e-14 | 3.37e-12 | 83 |
| GO:007265533 | Thyroid | ATC | establishment of protein localization to mitochondrion | 80/6293 | 120/18723 | 1.27e-13 | 6.46e-12 | 80 |
| GO:000662626 | Thyroid | ATC | protein targeting to mitochondrion | 67/6293 | 100/18723 | 8.62e-12 | 3.21e-10 | 67 |
| Page: 1 2 |
| Pathway ID | Tissue | Disease Stage | Description | Gene Ratio | Bg Ratio | pvalue | p.adjust | qvalue | Count |
| Page: 1 |
Top |
Cell-cell communication analysis |
| Identification of potential cell-cell interactions between two cell types and their ligand-receptor pairs for different disease states |
| Ligand | Receptor | LRpair | Pathway | Tissue | Disease Stage |
| Page: 1 |
Top |
Single-cell gene regulatory network inference analysis |
| Find out the significant the regulons (TFs) and the target genes of each regulon across cell types for different disease states |
| TF | Cell Type | Tissue | Disease Stage | Target Gene | RSS | Regulon Activity |
| ∗The dot plots of a searched regulon are shown for all cell subpopulations in each disease state of each tissue based on the regulon specific score inferred using pySCENIC and by calculating the average expression. |
| Page: 1 |
Top |
Somatic mutation of malignant transformation related genes |
| Annotation of somatic variants for genes involved in malignant transformation |
| Hugo Symbol | Variant Class | Variant Classification | dbSNP RS | HGVSc | HGVSp | HGVSp Short | SWISSPROT | BIOTYPE | SIFT | PolyPhen | Tumor Sample Barcode | Tissue | Histology | Sex | Age | Stage | Therapy Types | Drugs | Outcome |
| TIMM29 | SNV | Missense_Mutation | c.694N>A | p.Trp232Arg | p.W232R | Q9BSF4 | protein_coding | tolerated_low_confidence(0.24) | benign(0.091) | TCGA-CK-4951-01 | Colorectum | colon adenocarcinoma | Female | >=65 | I/II | Unknown | Unknown | PD | |
| TIMM29 | SNV | Missense_Mutation | novel | c.425N>T | p.Ala142Val | p.A142V | Q9BSF4 | protein_coding | tolerated(0.19) | benign(0.003) | TCGA-A5-A1OF-01 | Endometrium | uterine corpus endometrioid carcinoma | Female | <65 | I/II | Unknown | Unknown | SD |
| TIMM29 | SNV | Missense_Mutation | novel | c.779N>T | p.Arg260Ile | p.R260I | Q9BSF4 | protein_coding | deleterious_low_confidence(0) | benign(0.007) | TCGA-AP-A1DV-01 | Endometrium | uterine corpus endometrioid carcinoma | Female | <65 | I/II | Unknown | Unknown | SD |
| TIMM29 | SNV | Missense_Mutation | novel | c.84N>T | p.Trp28Cys | p.W28C | Q9BSF4 | protein_coding | deleterious(0) | probably_damaging(0.937) | TCGA-EY-A1H0-01 | Endometrium | uterine corpus endometrioid carcinoma | Female | <65 | III/IV | Chemotherapy | taxol | SD |
| TIMM29 | SNV | Missense_Mutation | novel | c.512G>T | p.Arg171Leu | p.R171L | Q9BSF4 | protein_coding | deleterious(0.01) | possibly_damaging(0.565) | TCGA-56-A5DR-01 | Lung | lung squamous cell carcinoma | Male | >=65 | I/II | Unknown | Unknown | SD |
| TIMM29 | SNV | Missense_Mutation | c.556N>T | p.Asp186Tyr | p.D186Y | Q9BSF4 | protein_coding | deleterious(0.01) | benign(0.297) | TCGA-DJ-A3V7-01 | Thyroid | thyroid carcinoma | Female | <65 | III/IV | Unknown | Unknown | SD |
| Page: 1 |
Top |
Related drugs of malignant transformation related genes |
| Identification of chemicals and drugs interact with genes involved in malignant transfromation |
| (DGIdb 4.0) |
| Entrez ID | Symbol | Category | Interaction Types | Drug Claim Name | Drug Name | PMIDs |
| Page: 1 |

Copyright 2023-Present -The University of Texas Health Science Center at Houston |