
|
|||||
|
 | |
| |
| |
| |
| |
| |
|
Gene: TIMM21 |
Gene summary for TIMM21 |
| Gene information | Species | Human | Gene symbol | TIMM21 | Gene ID | 29090 |
| Gene name | translocase of inner mitochondrial membrane 21 | |
| Gene Alias | C18orf55 | |
| Cytomap | 18q22.3 | |
| Gene Type | protein-coding | GO ID | GO:0006605 | UniProtAcc | A8K1K8 |
Top |
Malignant transformation analysis |
| Identification of the aberrant gene expression in precancerous and cancerous lesions by comparing the gene expression of stem-like cells in diseased tissues with normal stem cells |
| Entrez ID | Symbol | Replicates | Species | Organ | Tissue | Adj P-value | Log2FC | Malignancy |
| 29090 | TIMM21 | LZE7T | Human | Esophagus | ESCC | 1.66e-03 | 4.24e-01 | 0.0667 |
| 29090 | TIMM21 | LZE24T | Human | Esophagus | ESCC | 2.54e-06 | 2.09e-01 | 0.0596 |
| 29090 | TIMM21 | P2T-E | Human | Esophagus | ESCC | 1.95e-23 | 4.51e-01 | 0.1177 |
| 29090 | TIMM21 | P4T-E | Human | Esophagus | ESCC | 6.74e-25 | 6.86e-01 | 0.1323 |
| 29090 | TIMM21 | P5T-E | Human | Esophagus | ESCC | 1.41e-11 | 1.49e-01 | 0.1327 |
| 29090 | TIMM21 | P8T-E | Human | Esophagus | ESCC | 9.96e-08 | 5.51e-02 | 0.0889 |
| 29090 | TIMM21 | P9T-E | Human | Esophagus | ESCC | 1.04e-11 | 2.26e-01 | 0.1131 |
| 29090 | TIMM21 | P10T-E | Human | Esophagus | ESCC | 2.86e-29 | 4.35e-01 | 0.116 |
| 29090 | TIMM21 | P11T-E | Human | Esophagus | ESCC | 3.26e-11 | 3.71e-01 | 0.1426 |
| 29090 | TIMM21 | P12T-E | Human | Esophagus | ESCC | 7.68e-30 | 4.96e-01 | 0.1122 |
| 29090 | TIMM21 | P15T-E | Human | Esophagus | ESCC | 3.02e-11 | 2.69e-01 | 0.1149 |
| 29090 | TIMM21 | P16T-E | Human | Esophagus | ESCC | 4.42e-22 | 3.62e-01 | 0.1153 |
| 29090 | TIMM21 | P17T-E | Human | Esophagus | ESCC | 4.23e-03 | 1.71e-01 | 0.1278 |
| 29090 | TIMM21 | P20T-E | Human | Esophagus | ESCC | 1.60e-11 | 2.59e-01 | 0.1124 |
| 29090 | TIMM21 | P21T-E | Human | Esophagus | ESCC | 1.08e-26 | 4.21e-01 | 0.1617 |
| 29090 | TIMM21 | P22T-E | Human | Esophagus | ESCC | 5.06e-28 | 4.15e-01 | 0.1236 |
| 29090 | TIMM21 | P23T-E | Human | Esophagus | ESCC | 6.40e-21 | 5.16e-01 | 0.108 |
| 29090 | TIMM21 | P24T-E | Human | Esophagus | ESCC | 2.83e-08 | 2.29e-01 | 0.1287 |
| 29090 | TIMM21 | P26T-E | Human | Esophagus | ESCC | 3.96e-33 | 5.37e-01 | 0.1276 |
| 29090 | TIMM21 | P27T-E | Human | Esophagus | ESCC | 1.83e-14 | 2.73e-01 | 0.1055 |
| Page: 1 2 3 4 |
| Tissue | Expression Dynamics | Abbreviation |
| Esophagus |  | ESCC: Esophageal squamous cell carcinoma |
| HGIN: High-grade intraepithelial neoplasias | ||
| LGIN: Low-grade intraepithelial neoplasias | ||
| Liver |  | HCC: Hepatocellular carcinoma |
| NAFLD: Non-alcoholic fatty liver disease | ||
| Oral Cavity | 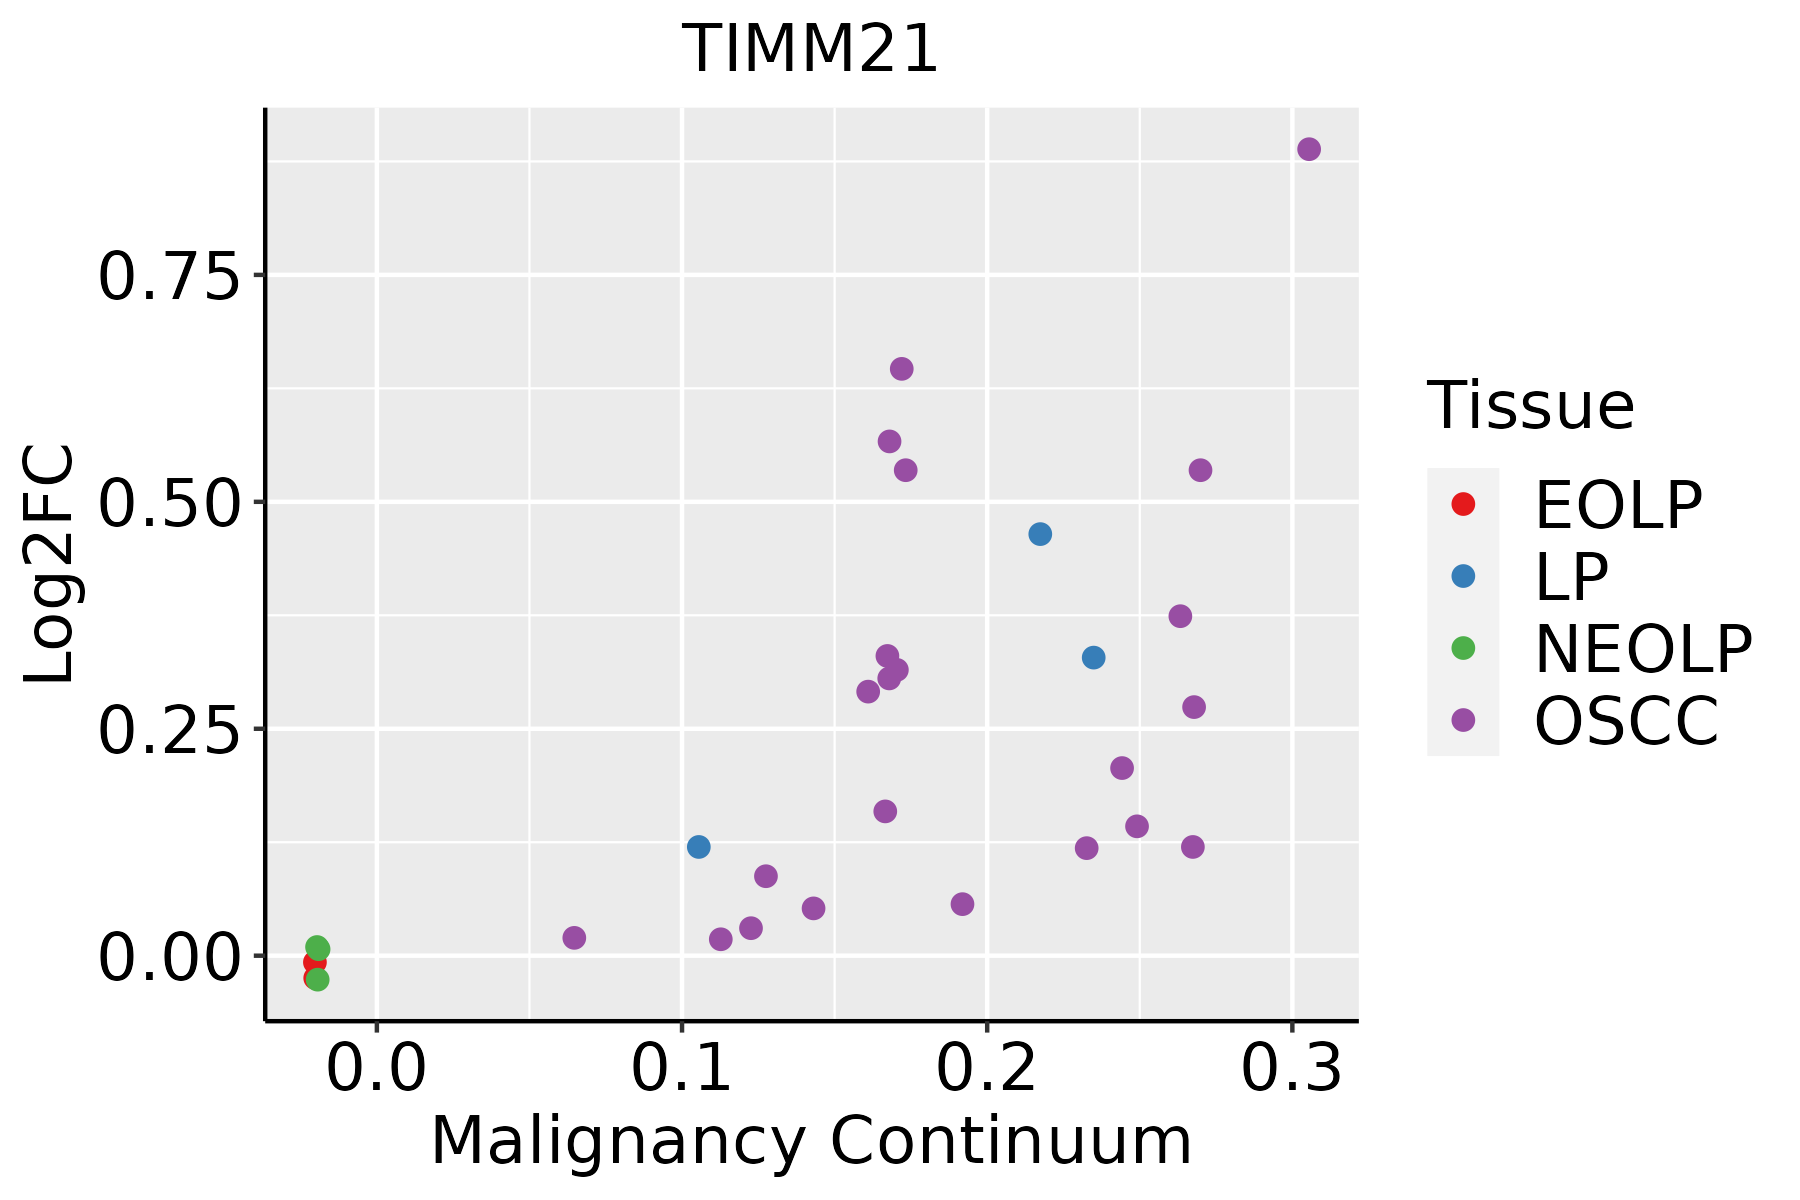 | EOLP: Erosive Oral lichen planus |
| LP: leukoplakia | ||
| NEOLP: Non-erosive oral lichen planus | ||
| OSCC: Oral squamous cell carcinoma |
| ∗log2FC in expression of this searched gene in stem-like cells from each diseased tissue sample relative to stem-like cells in normal samples in each tissue plotted against the malignancy continuum. Samples are colored based on if they are from different disease stage. |
Top |
Malignant transformation related pathway analysis |
| Find out the enriched GO biological processes and KEGG pathways involved in transition from healthy to precancer to cancer |
| Tissue | Disease Stage | Enriched GO biological Processes |
| Colorectum | AD |  |
| Colorectum | SER |  |
| Colorectum | MSS |  |
| Colorectum | MSI-H |  |
| Colorectum | FAP |  |
| ∗Top 15 enriched GO BP terms are showed in the bar plot of each disease state in each tissue. Each row represents a significant GO biological process which is colored according to the -log10(p.adjust). |
| Page: 1 2 3 4 5 6 7 8 9 |
| GO ID | Tissue | Disease Stage | Description | Gene Ratio | Bg Ratio | pvalue | p.adjust | Count |
| GO:0072594110 | Esophagus | ESCC | establishment of protein localization to organelle | 311/8552 | 422/18723 | 3.02e-32 | 2.13e-29 | 311 |
| GO:0006605111 | Esophagus | ESCC | protein targeting | 229/8552 | 314/18723 | 4.93e-23 | 1.01e-20 | 229 |
| GO:0006839110 | Esophagus | ESCC | mitochondrial transport | 187/8552 | 254/18723 | 8.35e-20 | 9.81e-18 | 187 |
| GO:0033108110 | Esophagus | ESCC | mitochondrial respiratory chain complex assembly | 83/8552 | 93/18723 | 9.56e-19 | 1.05e-16 | 83 |
| GO:0072655110 | Esophagus | ESCC | establishment of protein localization to mitochondrion | 97/8552 | 120/18723 | 2.17e-15 | 1.33e-13 | 97 |
| GO:0070585110 | Esophagus | ESCC | protein localization to mitochondrion | 100/8552 | 125/18723 | 2.96e-15 | 1.77e-13 | 100 |
| GO:001703818 | Esophagus | ESCC | protein import | 149/8552 | 206/18723 | 5.90e-15 | 3.31e-13 | 149 |
| GO:0006626110 | Esophagus | ESCC | protein targeting to mitochondrion | 81/8552 | 100/18723 | 3.60e-13 | 1.67e-11 | 81 |
| GO:0010257110 | Esophagus | ESCC | NADH dehydrogenase complex assembly | 50/8552 | 57/18723 | 3.78e-11 | 1.24e-09 | 50 |
| GO:0032981110 | Esophagus | ESCC | mitochondrial respiratory chain complex I assembly | 50/8552 | 57/18723 | 3.78e-11 | 1.24e-09 | 50 |
| GO:001700413 | Esophagus | ESCC | cytochrome complex assembly | 34/8552 | 36/18723 | 5.08e-10 | 1.31e-08 | 34 |
| GO:00718069 | Esophagus | ESCC | protein transmembrane transport | 47/8552 | 59/18723 | 9.02e-08 | 1.51e-06 | 47 |
| GO:1990542110 | Esophagus | ESCC | mitochondrial transmembrane transport | 72/8552 | 102/18723 | 2.94e-07 | 4.23e-06 | 72 |
| GO:000853512 | Esophagus | ESCC | respiratory chain complex IV assembly | 24/8552 | 26/18723 | 6.87e-07 | 8.99e-06 | 24 |
| GO:003361712 | Esophagus | ESCC | mitochondrial cytochrome c oxidase assembly | 21/8552 | 22/18723 | 8.75e-07 | 1.13e-05 | 21 |
| GO:00650026 | Esophagus | ESCC | intracellular protein transmembrane transport | 40/8552 | 51/18723 | 1.76e-06 | 2.08e-05 | 40 |
| GO:00447433 | Esophagus | ESCC | protein transmembrane import into intracellular organelle | 29/8552 | 36/18723 | 1.91e-05 | 1.67e-04 | 29 |
| GO:00301503 | Esophagus | ESCC | protein import into mitochondrial matrix | 16/8552 | 20/18723 | 1.85e-03 | 8.40e-03 | 16 |
| GO:007259412 | Liver | Cirrhotic | establishment of protein localization to organelle | 189/4634 | 422/18723 | 1.01e-19 | 2.45e-17 | 189 |
| GO:00331087 | Liver | Cirrhotic | mitochondrial respiratory chain complex assembly | 64/4634 | 93/18723 | 3.85e-19 | 7.79e-17 | 64 |
| Page: 1 2 3 4 5 |
| Pathway ID | Tissue | Disease Stage | Description | Gene Ratio | Bg Ratio | pvalue | p.adjust | qvalue | Count |
| Page: 1 |
Top |
Cell-cell communication analysis |
| Identification of potential cell-cell interactions between two cell types and their ligand-receptor pairs for different disease states |
| Ligand | Receptor | LRpair | Pathway | Tissue | Disease Stage |
| Page: 1 |
Top |
Single-cell gene regulatory network inference analysis |
| Find out the significant the regulons (TFs) and the target genes of each regulon across cell types for different disease states |
| TF | Cell Type | Tissue | Disease Stage | Target Gene | RSS | Regulon Activity |
| ∗The dot plots of a searched regulon are shown for all cell subpopulations in each disease state of each tissue based on the regulon specific score inferred using pySCENIC and by calculating the average expression. |
| Page: 1 |
Top |
Somatic mutation of malignant transformation related genes |
| Annotation of somatic variants for genes involved in malignant transformation |
| Hugo Symbol | Variant Class | Variant Classification | dbSNP RS | HGVSc | HGVSp | HGVSp Short | SWISSPROT | BIOTYPE | SIFT | PolyPhen | Tumor Sample Barcode | Tissue | Histology | Sex | Age | Stage | Therapy Types | Drugs | Outcome |
| TIMM21 | SNV | Missense_Mutation | c.172N>A | p.Leu58Ile | p.L58I | Q9BVV7 | protein_coding | tolerated(0.11) | benign(0.007) | TCGA-AN-A046-01 | Breast | breast invasive carcinoma | Female | >=65 | I/II | Unknown | Unknown | SD | |
| TIMM21 | SNV | Missense_Mutation | novel | c.176N>C | p.Gly59Ala | p.G59A | Q9BVV7 | protein_coding | tolerated(0.23) | benign(0.015) | TCGA-AR-A2LH-01 | Breast | breast invasive carcinoma | Female | <65 | III/IV | Chemotherapy | adriamycin | PD |
| TIMM21 | SNV | Missense_Mutation | rs750523747 | c.236G>A | p.Gly79Asp | p.G79D | Q9BVV7 | protein_coding | tolerated(0.41) | benign(0) | TCGA-E2-A14R-01 | Breast | breast invasive carcinoma | Female | <65 | I/II | Chemotherapy | doxorubicin | PD |
| TIMM21 | insertion | In_Frame_Ins | novel | c.168_169insGATCAGAGCCTGTTAATTAAA | p.Cys56_Ile57insAspGlnSerLeuLeuIleLys | p.C56_I57insDQSLLIK | Q9BVV7 | protein_coding | TCGA-A7-A0CJ-01 | Breast | breast invasive carcinoma | Female | <65 | I/II | Chemotherapy | cytoxan | SD | ||
| TIMM21 | SNV | Missense_Mutation | rs553191760 | c.523N>T | p.Arg175Trp | p.R175W | Q9BVV7 | protein_coding | deleterious(0) | probably_damaging(1) | TCGA-VS-A9U6-01 | Cervix | cervical & endocervical cancer | Female | <65 | I/II | Chemotherapy | cisplatin | PD |
| TIMM21 | SNV | Missense_Mutation | c.424T>G | p.Tyr142Asp | p.Y142D | Q9BVV7 | protein_coding | deleterious(0) | probably_damaging(0.989) | TCGA-CA-6718-01 | Colorectum | colon adenocarcinoma | Male | <65 | I/II | Unknown | Unknown | PD | |
| TIMM21 | SNV | Missense_Mutation | rs776869928 | c.70C>T | p.Leu24Phe | p.L24F | Q9BVV7 | protein_coding | tolerated_low_confidence(0.57) | benign(0) | TCGA-AJ-A3EL-01 | Endometrium | uterine corpus endometrioid carcinoma | Female | <65 | I/II | Unknown | Unknown | SD |
| TIMM21 | SNV | Missense_Mutation | c.343N>A | p.Leu115Ile | p.L115I | Q9BVV7 | protein_coding | tolerated(0.14) | benign(0.195) | TCGA-AP-A051-01 | Endometrium | uterine corpus endometrioid carcinoma | Female | >=65 | I/II | Unknown | Unknown | SD | |
| TIMM21 | SNV | Missense_Mutation | novel | c.43N>A | p.Leu15Met | p.L15M | Q9BVV7 | protein_coding | tolerated_low_confidence(0.05) | probably_damaging(0.997) | TCGA-AX-A1CE-01 | Endometrium | uterine corpus endometrioid carcinoma | Female | <65 | I/II | Unspecific | Paclitaxel | SD |
| TIMM21 | SNV | Missense_Mutation | novel | c.256C>A | p.His86Asn | p.H86N | Q9BVV7 | protein_coding | tolerated(0.14) | benign(0.001) | TCGA-AX-A2HC-01 | Endometrium | uterine corpus endometrioid carcinoma | Female | <65 | III/IV | Chemotherapy | paclitaxel | PD |
| Page: 1 2 3 |
Top |
Related drugs of malignant transformation related genes |
| Identification of chemicals and drugs interact with genes involved in malignant transfromation |
| (DGIdb 4.0) |
| Entrez ID | Symbol | Category | Interaction Types | Drug Claim Name | Drug Name | PMIDs |
| Page: 1 |

Copyright 2023-Present -The University of Texas Health Science Center at Houston |