
|
|||||
|
 | |
| |
| |
| |
| |
| |
|
Gene: TIMM10 |
Gene summary for TIMM10 |
| Gene information | Species | Human | Gene symbol | TIMM10 | Gene ID | 26519 |
| Gene name | translocase of inner mitochondrial membrane 10 | |
| Gene Alias | TIM10 | |
| Cytomap | 11q12.1 | |
| Gene Type | protein-coding | GO ID | GO:0003008 | UniProtAcc | P62072 |
Top |
Malignant transformation analysis |
| Identification of the aberrant gene expression in precancerous and cancerous lesions by comparing the gene expression of stem-like cells in diseased tissues with normal stem cells |
| Entrez ID | Symbol | Replicates | Species | Organ | Tissue | Adj P-value | Log2FC | Malignancy |
| 26519 | TIMM10 | HTA11_3410_2000001011 | Human | Colorectum | AD | 3.88e-03 | 1.14e-01 | 0.0155 |
| 26519 | TIMM10 | HTA11_2487_2000001011 | Human | Colorectum | SER | 1.67e-05 | 2.45e-01 | -0.1808 |
| 26519 | TIMM10 | HTA11_1938_2000001011 | Human | Colorectum | AD | 1.33e-07 | 3.25e-01 | -0.0811 |
| 26519 | TIMM10 | HTA11_347_2000001011 | Human | Colorectum | AD | 1.08e-03 | 1.64e-01 | -0.1954 |
| 26519 | TIMM10 | HTA11_83_2000001011 | Human | Colorectum | SER | 3.45e-06 | 3.30e-01 | -0.1526 |
| 26519 | TIMM10 | HTA11_696_2000001011 | Human | Colorectum | AD | 2.03e-09 | 2.27e-01 | -0.1464 |
| 26519 | TIMM10 | HTA11_866_2000001011 | Human | Colorectum | AD | 1.86e-11 | 2.62e-01 | -0.1001 |
| 26519 | TIMM10 | HTA11_1391_2000001011 | Human | Colorectum | AD | 2.50e-08 | 3.05e-01 | -0.059 |
| 26519 | TIMM10 | HTA11_866_3004761011 | Human | Colorectum | AD | 1.49e-12 | 3.71e-01 | 0.096 |
| 26519 | TIMM10 | HTA11_8622_2000001021 | Human | Colorectum | SER | 7.63e-03 | 3.22e-01 | 0.0528 |
| 26519 | TIMM10 | HTA11_7663_2000001011 | Human | Colorectum | SER | 4.93e-03 | 3.79e-01 | 0.0131 |
| 26519 | TIMM10 | HTA11_6801_2000001011 | Human | Colorectum | SER | 4.50e-04 | 3.54e-01 | 0.0171 |
| 26519 | TIMM10 | HTA11_10711_2000001011 | Human | Colorectum | AD | 1.33e-02 | 1.79e-01 | 0.0338 |
| 26519 | TIMM10 | HTA11_7696_3000711011 | Human | Colorectum | AD | 7.82e-13 | 2.50e-01 | 0.0674 |
| 26519 | TIMM10 | HTA11_7469_2000001011 | Human | Colorectum | AD | 2.24e-02 | 3.28e-01 | -0.0124 |
| 26519 | TIMM10 | HTA11_99999970781_79442 | Human | Colorectum | MSS | 1.73e-12 | 2.64e-01 | 0.294 |
| 26519 | TIMM10 | HTA11_99999965104_69814 | Human | Colorectum | MSS | 6.74e-03 | 1.98e-01 | 0.281 |
| 26519 | TIMM10 | HTA11_99999971662_82457 | Human | Colorectum | MSS | 2.10e-17 | 3.72e-01 | 0.3859 |
| 26519 | TIMM10 | HTA11_99999974143_84620 | Human | Colorectum | MSS | 4.71e-06 | 1.77e-01 | 0.3005 |
| 26519 | TIMM10 | LZE2D | Human | Esophagus | HGIN | 3.57e-03 | 3.60e-01 | 0.0642 |
| Page: 1 2 3 4 5 6 7 8 |
| Tissue | Expression Dynamics | Abbreviation |
| Colorectum (GSE201348) |  | FAP: Familial adenomatous polyposis |
| CRC: Colorectal cancer | ||
| Colorectum (HTA11) |  | AD: Adenomas |
| SER: Sessile serrated lesions | ||
| MSI-H: Microsatellite-high colorectal cancer | ||
| MSS: Microsatellite stable colorectal cancer | ||
| Esophagus |  | ESCC: Esophageal squamous cell carcinoma |
| HGIN: High-grade intraepithelial neoplasias | ||
| LGIN: Low-grade intraepithelial neoplasias | ||
| Liver |  | HCC: Hepatocellular carcinoma |
| NAFLD: Non-alcoholic fatty liver disease | ||
| Oral Cavity |  | EOLP: Erosive Oral lichen planus |
| LP: leukoplakia | ||
| NEOLP: Non-erosive oral lichen planus | ||
| OSCC: Oral squamous cell carcinoma | ||
| Skin |  | AK: Actinic keratosis |
| cSCC: Cutaneous squamous cell carcinoma | ||
| SCCIS:squamous cell carcinoma in situ | ||
| Thyroid | 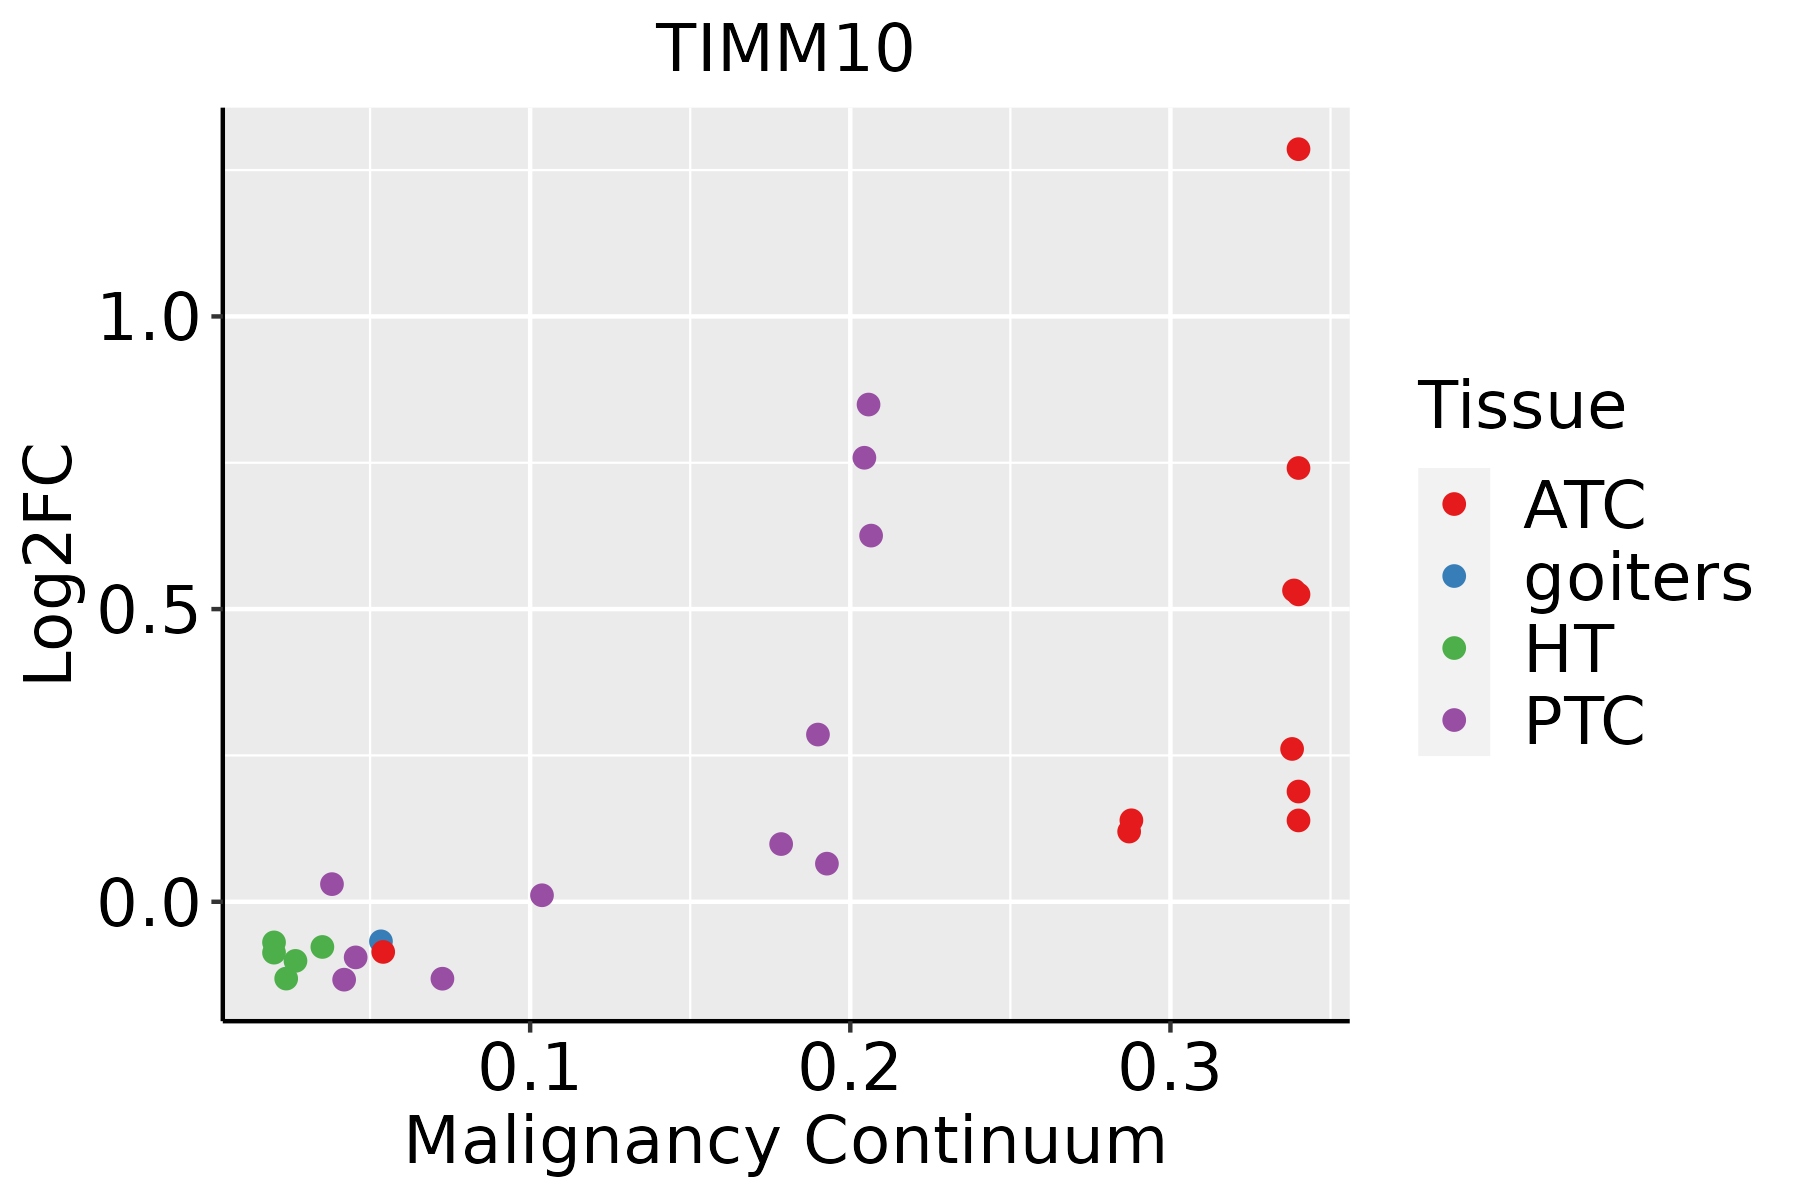 | ATC: Anaplastic thyroid cancer |
| HT: Hashimoto's thyroiditis | ||
| PTC: Papillary thyroid cancer |
| ∗log2FC in expression of this searched gene in stem-like cells from each diseased tissue sample relative to stem-like cells in normal samples in each tissue plotted against the malignancy continuum. Samples are colored based on if they are from different disease stage. |
Top |
Malignant transformation related pathway analysis |
| Find out the enriched GO biological processes and KEGG pathways involved in transition from healthy to precancer to cancer |
| Tissue | Disease Stage | Enriched GO biological Processes |
| Colorectum | AD |  |
| Colorectum | SER |  |
| Colorectum | MSS |  |
| Colorectum | MSI-H |  |
| Colorectum | FAP |  |
| ∗Top 15 enriched GO BP terms are showed in the bar plot of each disease state in each tissue. Each row represents a significant GO biological process which is colored according to the -log10(p.adjust). |
| Page: 1 2 3 4 5 6 7 8 9 |
| GO ID | Tissue | Disease Stage | Description | Gene Ratio | Bg Ratio | pvalue | p.adjust | Count |
| GO:0006839 | Colorectum | AD | mitochondrial transport | 102/3918 | 254/18723 | 1.87e-12 | 3.08e-10 | 102 |
| GO:0072594 | Colorectum | AD | establishment of protein localization to organelle | 148/3918 | 422/18723 | 7.95e-12 | 1.04e-09 | 148 |
| GO:0090150 | Colorectum | AD | establishment of protein localization to membrane | 100/3918 | 260/18723 | 6.01e-11 | 6.33e-09 | 100 |
| GO:0006605 | Colorectum | AD | protein targeting | 105/3918 | 314/18723 | 1.39e-07 | 6.44e-06 | 105 |
| GO:0070585 | Colorectum | AD | protein localization to mitochondrion | 51/3918 | 125/18723 | 3.40e-07 | 1.33e-05 | 51 |
| GO:0007006 | Colorectum | AD | mitochondrial membrane organization | 48/3918 | 116/18723 | 4.53e-07 | 1.72e-05 | 48 |
| GO:0072655 | Colorectum | AD | establishment of protein localization to mitochondrion | 47/3918 | 120/18723 | 3.76e-06 | 1.04e-04 | 47 |
| GO:0006626 | Colorectum | AD | protein targeting to mitochondrion | 37/3918 | 100/18723 | 1.58e-04 | 2.20e-03 | 37 |
| GO:0007007 | Colorectum | AD | inner mitochondrial membrane organization | 18/3918 | 38/18723 | 2.45e-04 | 3.09e-03 | 18 |
| GO:0090151 | Colorectum | AD | establishment of protein localization to mitochondrial membrane | 15/3918 | 30/18723 | 3.85e-04 | 4.39e-03 | 15 |
| GO:0051205 | Colorectum | AD | protein insertion into membrane | 23/3918 | 57/18723 | 6.62e-04 | 6.80e-03 | 23 |
| GO:0051204 | Colorectum | AD | protein insertion into mitochondrial membrane | 12/3918 | 25/18723 | 2.30e-03 | 1.80e-02 | 12 |
| GO:00068391 | Colorectum | SER | mitochondrial transport | 87/2897 | 254/18723 | 7.91e-14 | 3.03e-11 | 87 |
| GO:00725941 | Colorectum | SER | establishment of protein localization to organelle | 111/2897 | 422/18723 | 4.98e-09 | 4.49e-07 | 111 |
| GO:00705851 | Colorectum | SER | protein localization to mitochondrion | 42/2897 | 125/18723 | 3.75e-07 | 1.98e-05 | 42 |
| GO:00070061 | Colorectum | SER | mitochondrial membrane organization | 38/2897 | 116/18723 | 2.66e-06 | 1.10e-04 | 38 |
| GO:00901501 | Colorectum | SER | establishment of protein localization to membrane | 68/2897 | 260/18723 | 5.55e-06 | 2.01e-04 | 68 |
| GO:00726551 | Colorectum | SER | establishment of protein localization to mitochondrion | 38/2897 | 120/18723 | 6.60e-06 | 2.33e-04 | 38 |
| GO:00066051 | Colorectum | SER | protein targeting | 76/2897 | 314/18723 | 3.19e-05 | 8.47e-04 | 76 |
| GO:00066261 | Colorectum | SER | protein targeting to mitochondrion | 31/2897 | 100/18723 | 7.09e-05 | 1.61e-03 | 31 |
| Page: 1 2 3 4 5 6 7 8 9 |
| Pathway ID | Tissue | Disease Stage | Description | Gene Ratio | Bg Ratio | pvalue | p.adjust | qvalue | Count |
| Page: 1 |
Top |
Cell-cell communication analysis |
| Identification of potential cell-cell interactions between two cell types and their ligand-receptor pairs for different disease states |
| Ligand | Receptor | LRpair | Pathway | Tissue | Disease Stage |
| Page: 1 |
Top |
Single-cell gene regulatory network inference analysis |
| Find out the significant the regulons (TFs) and the target genes of each regulon across cell types for different disease states |
| TF | Cell Type | Tissue | Disease Stage | Target Gene | RSS | Regulon Activity |
| ∗The dot plots of a searched regulon are shown for all cell subpopulations in each disease state of each tissue based on the regulon specific score inferred using pySCENIC and by calculating the average expression. |
| Page: 1 |
Top |
Somatic mutation of malignant transformation related genes |
| Annotation of somatic variants for genes involved in malignant transformation |
| Hugo Symbol | Variant Class | Variant Classification | dbSNP RS | HGVSc | HGVSp | HGVSp Short | SWISSPROT | BIOTYPE | SIFT | PolyPhen | Tumor Sample Barcode | Tissue | Histology | Sex | Age | Stage | Therapy Types | Drugs | Outcome |
| TIMM10 | SNV | Missense_Mutation | c.260N>G | p.Ser87Cys | p.S87C | P62072 | protein_coding | deleterious(0.03) | benign(0.077) | TCGA-DR-A0ZM-01 | Cervix | cervical & endocervical cancer | Female | <65 | III/IV | Unspecific | Cisplatin | SD | |
| TIMM10 | SNV | Missense_Mutation | novel | c.13N>G | p.Arg5Gly | p.R5G | P62072 | protein_coding | tolerated(0.11) | benign(0.007) | TCGA-AP-A1DK-01 | Endometrium | uterine corpus endometrioid carcinoma | Female | <65 | I/II | Unknown | Unknown | SD |
| TIMM10 | SNV | Missense_Mutation | novel | c.55N>A | p.Ala19Thr | p.A19T | P62072 | protein_coding | tolerated(1) | benign(0.057) | TCGA-AP-A1DV-01 | Endometrium | uterine corpus endometrioid carcinoma | Female | <65 | I/II | Unknown | Unknown | SD |
| TIMM10 | SNV | Missense_Mutation | c.196G>T | p.Gly66Cys | p.G66C | P62072 | protein_coding | deleterious(0) | probably_damaging(1) | TCGA-BR-4257-01 | Stomach | stomach adenocarcinoma | Female | >=65 | I/II | Unknown | Unknown | SD |
| Page: 1 |
Top |
Related drugs of malignant transformation related genes |
| Identification of chemicals and drugs interact with genes involved in malignant transfromation |
| (DGIdb 4.0) |
| Entrez ID | Symbol | Category | Interaction Types | Drug Claim Name | Drug Name | PMIDs |
| Page: 1 |

Copyright 2023-Present -The University of Texas Health Science Center at Houston |