Schematic overview of the cellular and molecular mechanisms involved in the cancer progression, including the proposed cellular and molecular mechanisms in cancer cells trajectory. AT1: alveolar type 1 cells; AT2: alveolar type 2 cells; AAH: atypical adenomatous hyperplasia; AIS: adenocarcinoma in situ; MIA: minimally invasive adenocarcinoma; IA: invasive adenocarcinoma; EMT: epithelial-mesenchymal transition

Home

Download

Statistics

Help

Contact

Center for Computational Systems Medicine
leaf

Gene summary

leaf

Malignant transformation analysis

leaf

Malignant transformation related pathway analysis

leaf

Cell-cell communication analysis

leaf

Single-cell gene regulatory network inference analysis

leaf

Somatic mutation of malignant transformation related genes

leaf

Related drugs of malignant transformation related genes

Gene: TIMELESS

Gene summary for TIMELESS

check button Gene summary.

Gene informationSpeciesHuman
Gene symbol

TIMELESS

Gene ID

8914

Gene nametimeless circadian regulator
Gene AliasTIM
Cytomap12q13.3
Gene Typeprotein-coding
GO ID

GO:0000018

UniProtAcc

Q9UNS1


Top

Malignant transformation analysis

check button Identification of the aberrant gene expression in precancerous and cancerous lesions by comparing the gene expression of stem-like cells in diseased tissues with normal stem cells
check button Malignant transformation involving gene list.
Entrez IDSymbolReplicatesSpeciesOrganTissueAdj P-valueLog2FCMalignancy
8914TIMELESSLZE2THumanEsophagusESCC2.18e-043.61e-010.082
8914TIMELESSLZE7THumanEsophagusESCC1.62e-042.47e-010.0667
8914TIMELESSLZE22THumanEsophagusESCC1.48e-053.61e-010.068
8914TIMELESSLZE24THumanEsophagusESCC4.35e-082.17e-010.0596
8914TIMELESSP1T-EHumanEsophagusESCC1.09e-043.46e-010.0875
8914TIMELESSP2T-EHumanEsophagusESCC3.95e-306.64e-010.1177
8914TIMELESSP4T-EHumanEsophagusESCC1.49e-092.71e-010.1323
8914TIMELESSP5T-EHumanEsophagusESCC2.03e-092.08e-010.1327
8914TIMELESSP8T-EHumanEsophagusESCC4.12e-112.51e-010.0889
8914TIMELESSP9T-EHumanEsophagusESCC2.30e-021.06e-010.1131
8914TIMELESSP10T-EHumanEsophagusESCC9.20e-062.10e-010.116
8914TIMELESSP11T-EHumanEsophagusESCC4.74e-031.45e-010.1426
8914TIMELESSP12T-EHumanEsophagusESCC1.78e-031.39e-010.1122
8914TIMELESSP15T-EHumanEsophagusESCC7.99e-082.18e-010.1149
8914TIMELESSP16T-EHumanEsophagusESCC4.40e-092.53e-010.1153
8914TIMELESSP17T-EHumanEsophagusESCC8.50e-052.04e-010.1278
8914TIMELESSP19T-EHumanEsophagusESCC4.64e-064.32e-010.1662
8914TIMELESSP20T-EHumanEsophagusESCC2.18e-031.32e-010.1124
8914TIMELESSP21T-EHumanEsophagusESCC9.44e-071.79e-010.1617
8914TIMELESSP22T-EHumanEsophagusESCC9.56e-081.92e-010.1236
Page: 1 2 3 4 5 

check button Transcriptomic changes along malignancy continuum.
TissueExpression DynamicsAbbreviation
EsophagusThe image shows the transcriptomic changes along malignancy continuum.log2FC in expression of this searched gene in stem-like cells from each diseased tissue sample relative to stem-like cells in normal samples in each tissue plotted against the malignancy continuum. Samples are colored based on if they are from different disease stage.
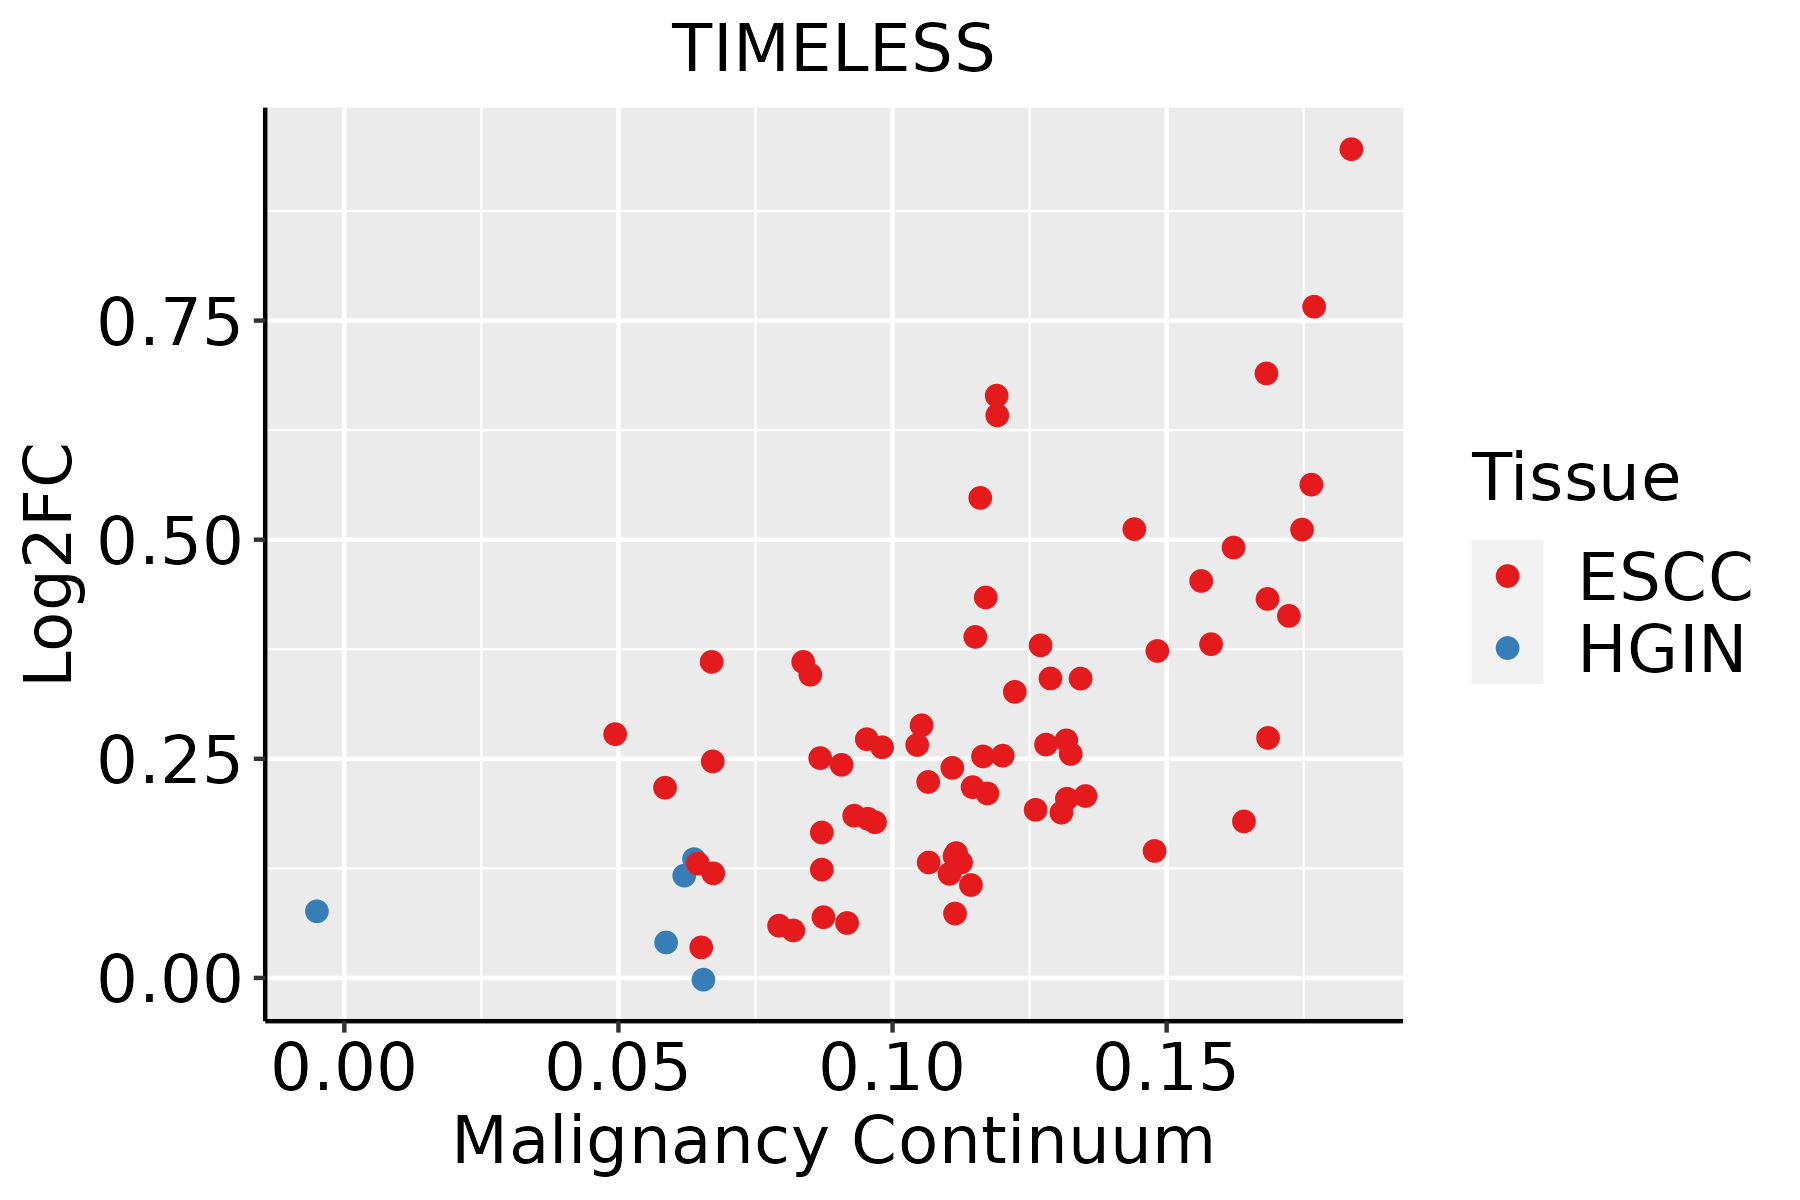
ESCC: Esophageal squamous cell carcinoma
HGIN: High-grade intraepithelial neoplasias
LGIN: Low-grade intraepithelial neoplasias
LiverThe image shows the transcriptomic changes along malignancy continuum.log2FC in expression of this searched gene in stem-like cells from each diseased tissue sample relative to stem-like cells in normal samples in each tissue plotted against the malignancy continuum. Samples are colored based on if they are from different disease stage.
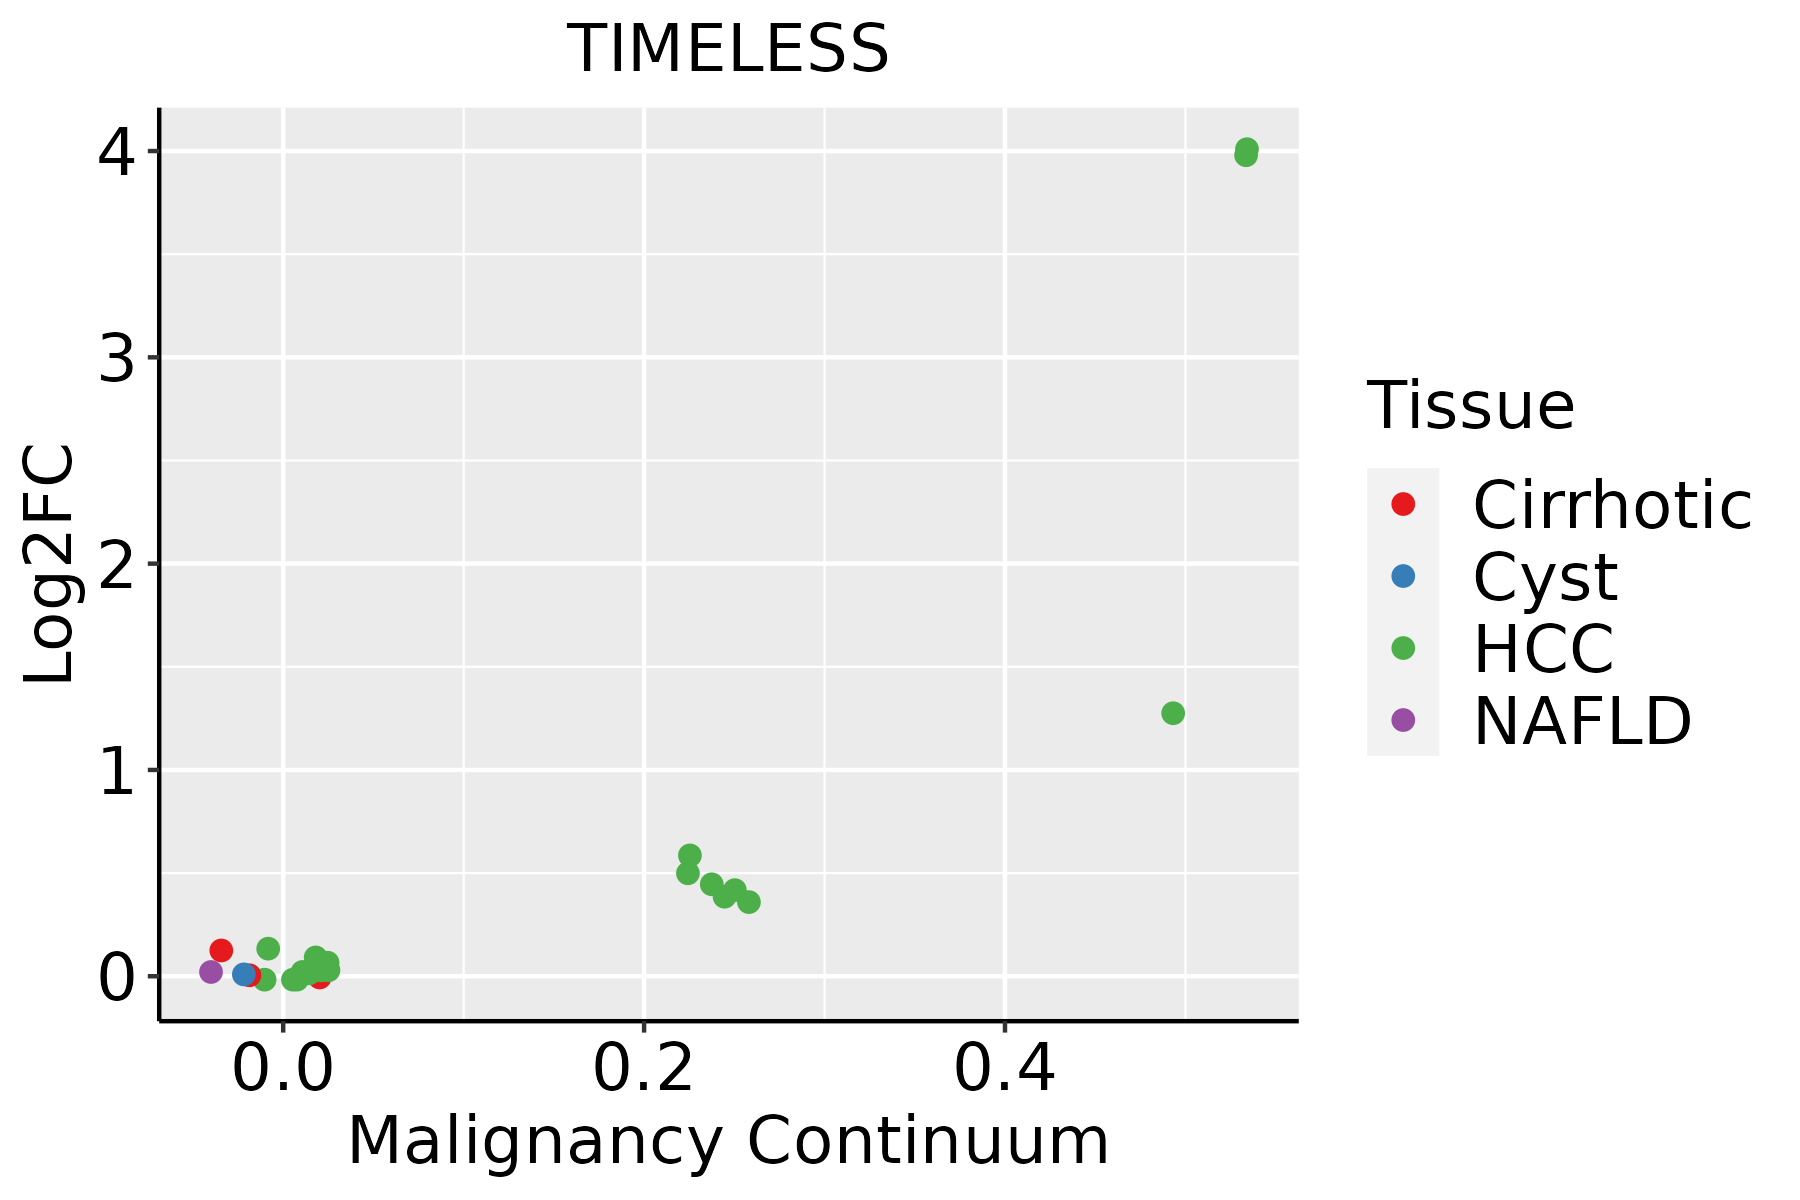
HCC: Hepatocellular carcinoma
NAFLD: Non-alcoholic fatty liver disease
Oral CavityThe image shows the transcriptomic changes along malignancy continuum.log2FC in expression of this searched gene in stem-like cells from each diseased tissue sample relative to stem-like cells in normal samples in each tissue plotted against the malignancy continuum. Samples are colored based on if they are from different disease stage.
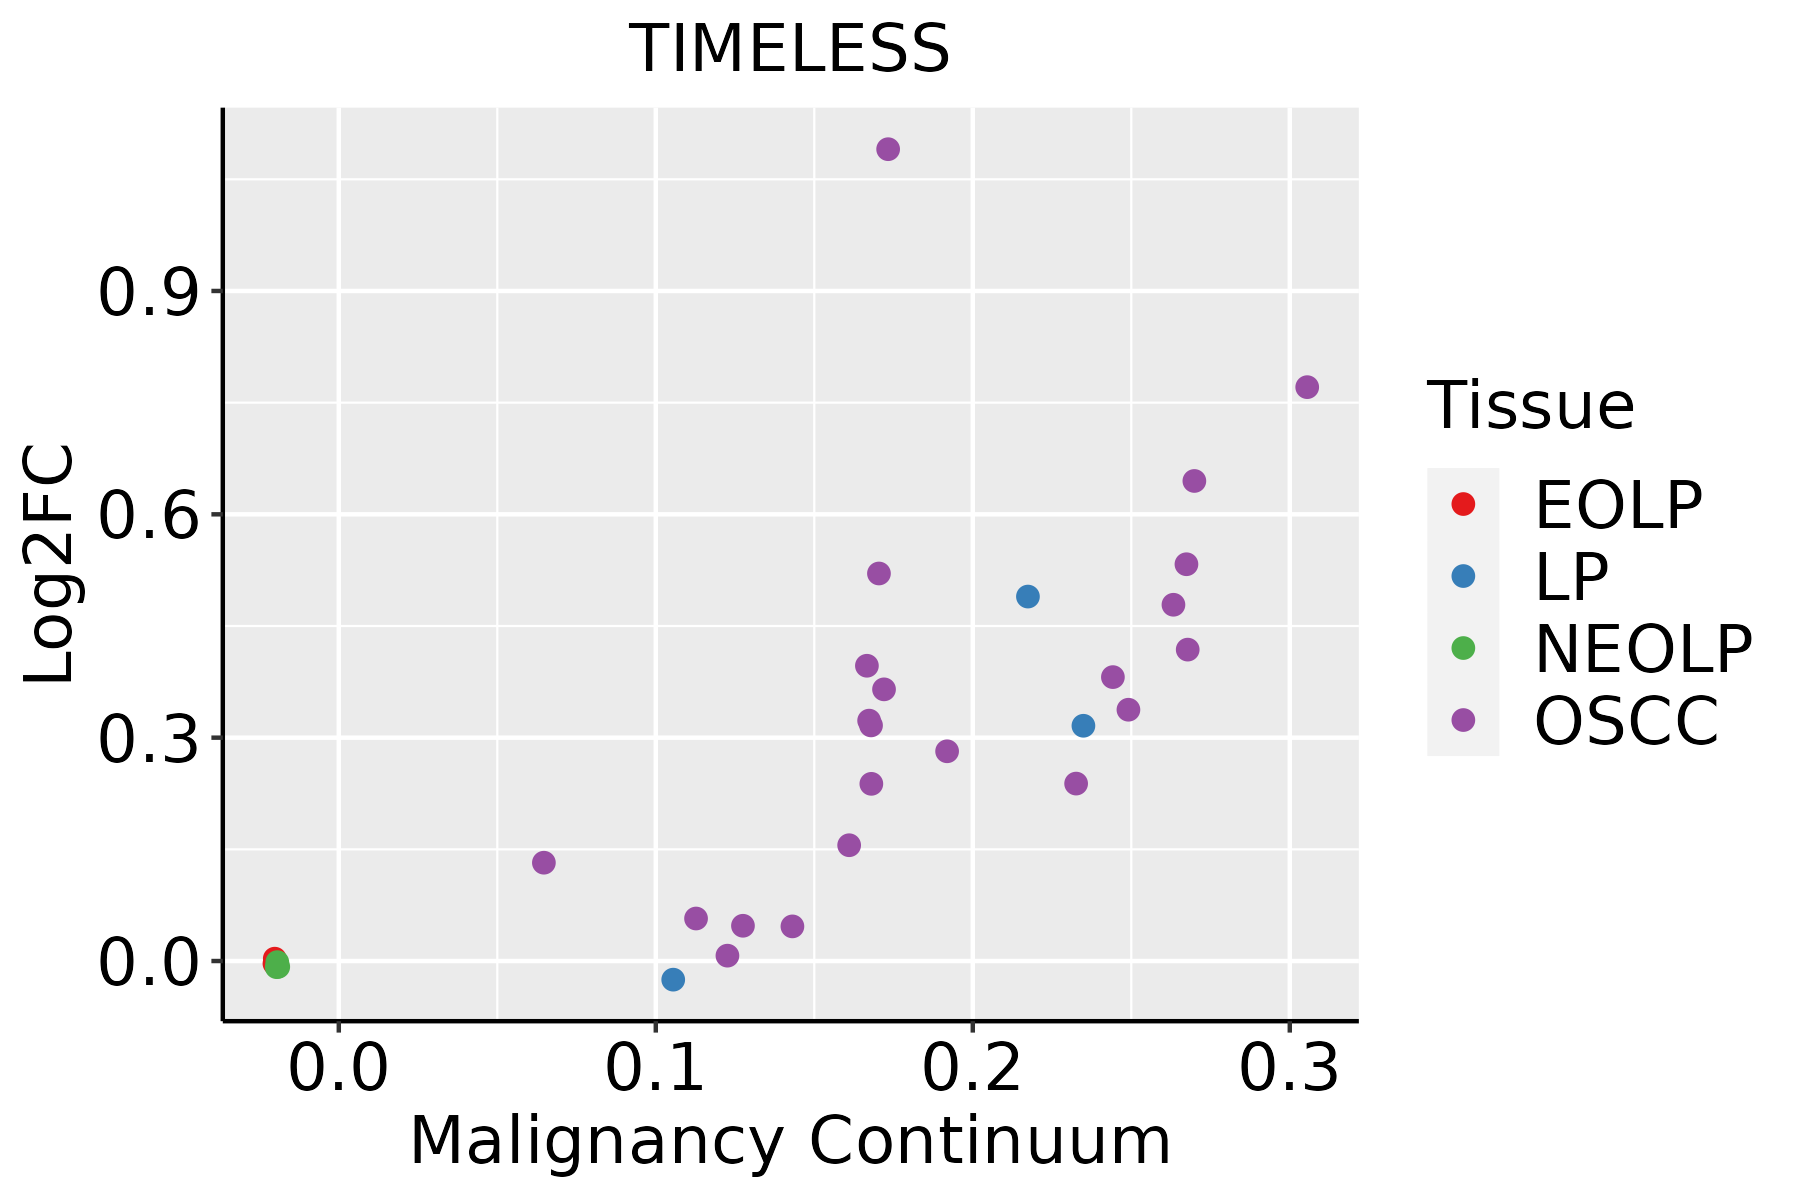
EOLP: Erosive Oral lichen planus
LP: leukoplakia
NEOLP: Non-erosive oral lichen planus
OSCC: Oral squamous cell carcinoma
ThyroidThe image shows the transcriptomic changes along malignancy continuum.log2FC in expression of this searched gene in stem-like cells from each diseased tissue sample relative to stem-like cells in normal samples in each tissue plotted against the malignancy continuum. Samples are colored based on if they are from different disease stage.
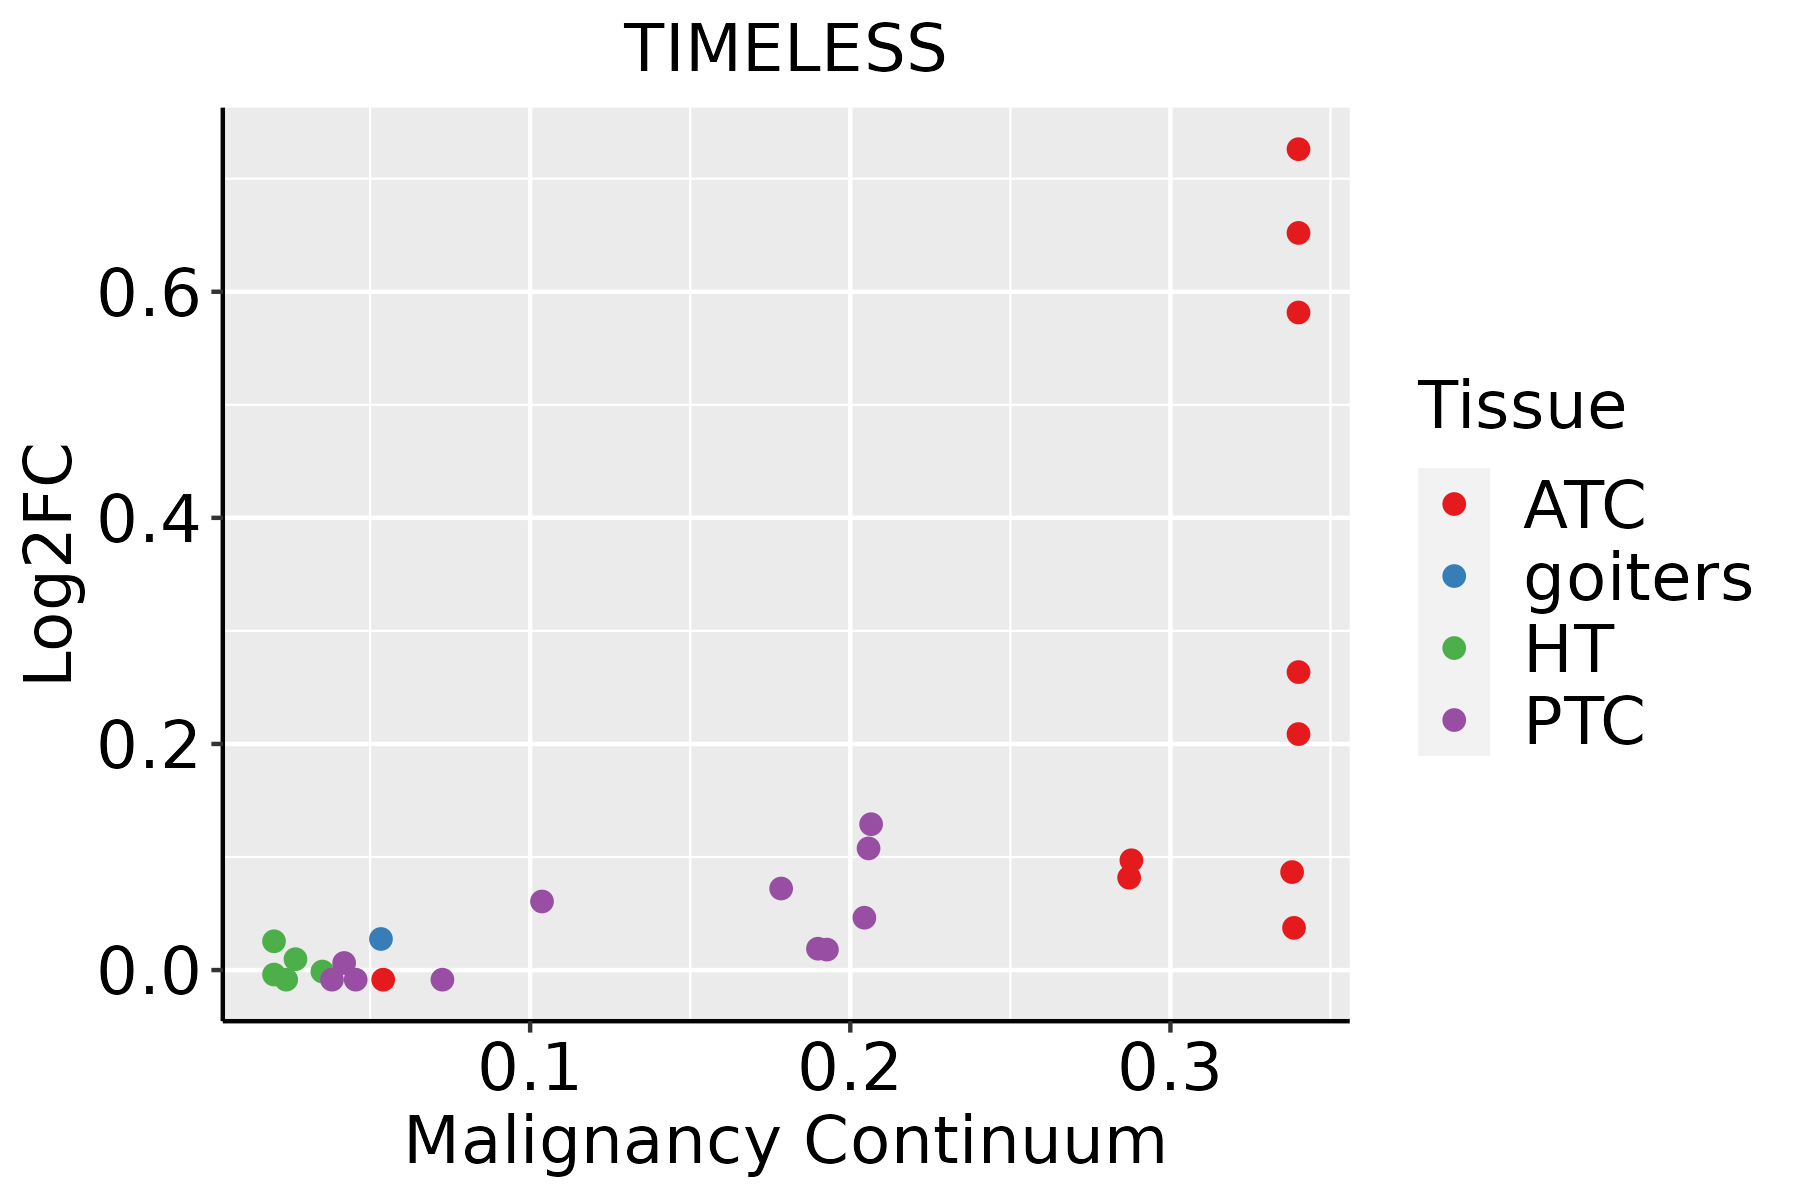
ATC: Anaplastic thyroid cancer
HT: Hashimoto's thyroiditis
PTC: Papillary thyroid cancer
∗log2FC in expression of this searched gene in stem-like cells from each diseased tissue sample relative to stem-like cells in normal samples in each tissue plotted against the malignancy continuum. Samples are colored based on if they are from different disease stage.

Top

Malignant transformation related pathway analysis

check buttonFind out the enriched GO biological processes and KEGG pathways involved in transition from healthy to precancer to cancer
check button Figure of enriched GO biological processes.
TissueDisease StageEnriched GO biological Processes
ColorectumADGO analysis - Figure of enriched GO biological processes: Top 15 enriched GO BP terms are showed in the bar plot of each disease state in each tissue. Each row represents a significant GO biological process which is colored according to the -log10(p.adjust).
ColorectumSERGO analysis - Figure of enriched GO biological processes: Top 15 enriched GO BP terms are showed in the bar plot of each disease state in each tissue. Each row represents a significant GO biological process which is colored according to the -log10(p.adjust).
ColorectumMSSGO analysis - Figure of enriched GO biological processes: Top 15 enriched GO BP terms are showed in the bar plot of each disease state in each tissue. Each row represents a significant GO biological process which is colored according to the -log10(p.adjust).
ColorectumMSI-HGO analysis - Figure of enriched GO biological processes: Top 15 enriched GO BP terms are showed in the bar plot of each disease state in each tissue. Each row represents a significant GO biological process which is colored according to the -log10(p.adjust).
ColorectumFAPGO analysis - Figure of enriched GO biological processes: Top 15 enriched GO BP terms are showed in the bar plot of each disease state in each tissue. Each row represents a significant GO biological process which is colored according to the -log10(p.adjust).
∗Top 15 enriched GO BP terms are showed in the bar plot of each disease state in each tissue. Each row represents a significant GO biological process which is colored according to the -log10(p.adjust).
Page: 1 2 3 4 5 6 7 8 9 

check button Enriched GO biological processes.
GO IDTissueDisease StageDescriptionGene RatioBg Ratiopvaluep.adjustCount
GO:00062604EsophagusESCCDNA replication181/8552260/187233.55e-152.05e-13181
GO:005105215EsophagusESCCregulation of DNA metabolic process232/8552359/187232.40e-131.13e-11232
GO:005105417EsophagusESCCpositive regulation of DNA metabolic process139/8552201/187231.20e-114.33e-10139
GO:190198713EsophagusESCCregulation of cell cycle phase transition242/8552390/187233.86e-111.26e-09242
GO:00457865EsophagusESCCnegative regulation of cell cycle236/8552385/187233.62e-109.93e-09236
GO:00000754EsophagusESCCcell cycle checkpoint117/8552169/187234.47e-101.17e-08117
GO:2001020110EsophagusESCCregulation of response to DNA damage stimulus145/8552219/187235.97e-101.50e-08145
GO:00062612EsophagusESCCDNA-dependent DNA replication100/8552151/187232.61e-073.94e-06100
GO:00109484EsophagusESCCnegative regulation of cell cycle process177/8552294/187233.26e-074.59e-06177
GO:00315705EsophagusESCCDNA integrity checkpoint83/8552123/187238.17e-071.06e-0583
GO:19019883EsophagusESCCnegative regulation of cell cycle phase transition151/8552249/187231.28e-061.57e-05151
GO:00063024EsophagusESCCdouble-strand break repair152/8552251/187231.33e-061.62e-05152
GO:190165319EsophagusESCCcellular response to peptide208/8552359/187231.68e-062.01e-05208
GO:00062754EsophagusESCCregulation of DNA replication73/8552107/187231.97e-062.28e-0573
GO:20010228EsophagusESCCpositive regulation of response to DNA damage stimulus69/8552105/187232.66e-052.22e-0469
GO:00062826EsophagusESCCregulation of DNA repair82/8552130/187234.65e-053.66e-0482
GO:00457395EsophagusESCCpositive regulation of DNA repair49/855273/187231.74e-041.14e-0349
GO:00063101EsophagusESCCDNA recombination168/8552305/187235.58e-043.05e-03168
GO:004851118EsophagusESCCrhythmic process164/8552298/187236.80e-043.57e-03164
GO:000762319EsophagusESCCcircadian rhythm119/8552210/187238.47e-044.36e-03119
Page: 1 2 3 4 5 

check button Enriched KEGG pathways.
Pathway IDTissueDisease StageDescriptionGene RatioBg Ratiopvaluep.adjustqvalueCount
Page: 1 

Top

Cell-cell communication analysis

check buttonIdentification of potential cell-cell interactions between two cell types and their ligand-receptor pairs for different disease states
LigandReceptorLRpairPathwayTissueDisease Stage
Page: 1 

Top

Single-cell gene regulatory network inference analysis

check buttonFind out the significant the regulons (TFs) and the target genes of each regulon across cell types for different disease states
TFCell TypeTissueDisease StageTarget GeneRSSRegulon Activity
∗The dot plots of a searched regulon are shown for all cell subpopulations in each disease state of each tissue based on the regulon specific score inferred using pySCENIC and by calculating the average expression.
Page: 1 

Top

Somatic mutation of malignant transformation related genes

check buttonAnnotation of somatic variants for genes involved in malignant transformation
Hugo SymbolVariant ClassVariant ClassificationdbSNP RSHGVScHGVSpHGVSp ShortSWISSPROTBIOTYPESIFTPolyPhenTumor Sample BarcodeTissueHistologySexAgeStageTherapy TypesDrugsOutcome
TIMELESSSNVMissense_Mutationrs780706303c.2110G>Ap.Val704Ilep.V704IQ9UNS1protein_codingdeleterious(0.04)benign(0.001)TCGA-A8-A06O-01Breastbreast invasive carcinomaFemale<65I/IIHormone TherapyletrozoleSD
TIMELESSSNVMissense_Mutationc.2530N>Tp.Asp844Tyrp.D844YQ9UNS1protein_codingdeleterious(0)probably_damaging(1)TCGA-AN-A0AS-01Breastbreast invasive carcinomaFemale>=65III/IVUnknownUnknownSD
TIMELESSSNVMissense_Mutationrs780869332c.1169N>Ap.Arg390Glnp.R390QQ9UNS1protein_codingdeleterious(0)probably_damaging(0.998)TCGA-AN-A0FT-01Breastbreast invasive carcinomaFemale<65I/IIUnknownUnknownSD
TIMELESSSNVMissense_Mutationc.2404N>Cp.Glu802Glnp.E802QQ9UNS1protein_codingdeleterious(0.02)probably_damaging(0.996)TCGA-D8-A1J8-01Breastbreast invasive carcinomaFemale>=65I/IIHormone TherapynolvadexSD
TIMELESSSNVMissense_Mutationrs751726906c.319C>Tp.Arg107Trpp.R107WQ9UNS1protein_codingdeleterious(0.01)probably_damaging(0.981)TCGA-D8-A1JA-01Breastbreast invasive carcinomaFemale<65III/IVChemotherapyadriamycinPD
TIMELESSSNVMissense_Mutationrs199809988c.721N>Tp.Arg241Cysp.R241CQ9UNS1protein_codingdeleterious(0.01)probably_damaging(0.93)TCGA-E9-A6HE-01Breastbreast invasive carcinomaFemale<65III/IVChemotherapyadriamycinCR
TIMELESSSNVMissense_Mutationrs374201861c.2879C>Tp.Ala960Valp.A960VQ9UNS1protein_codingtolerated(0.26)benign(0.025)TCGA-EW-A1IZ-01Breastbreast invasive carcinomaFemale<65III/IVChemotherapytaxotereSD
TIMELESSinsertionNonsense_Mutationnovelc.1142_1143insGTGTCGGTCTCCAGATCCATAAAGTTGGGATTGTGACAGTTGp.Ala381_Leu382insCysArgSerProAspProTerSerTrpAspCysAspSerCysp.A381_L382insCRSPDP*SWDCDSCQ9UNS1protein_codingTCGA-A8-A07J-01Breastbreast invasive carcinomaFemale<65I/IIChemotherapy5-fluorouracilCR
TIMELESSinsertionFrame_Shift_Insnovelc.3343_3344insCAGCTCTCTGGAGATTTAGTTCTCTTCTTCTAGGAACCp.Val1115AlafsTer33p.V1115Afs*33Q9UNS1protein_codingTCGA-B6-A0I6-01Breastbreast invasive carcinomaFemale<65I/IIUnknownUnknownPD
TIMELESSdeletionFrame_Shift_Delnovelc.956delNp.Pro319LeufsTer20p.P319Lfs*20Q9UNS1protein_codingTCGA-D8-A27V-01Breastbreast invasive carcinomaFemale<65I/IIHormone TherapytamoxiphenSD
Page: 1 2 3 4 5 6 7 8 9 10 11 12 

Top

Related drugs of malignant transformation related genes

check buttonIdentification of chemicals and drugs interact with genes involved in malignant transfromation
(DGIdb 4.0)
Entrez IDSymbolCategoryInteraction TypesDrug Claim NameDrug NamePMIDs
Page: 1