
|
|||||
|
 | |
| |
| |
| |
| |
| |
|
Gene: TIGIT |
Gene summary for TIGIT |
| Gene information | Species | Human | Gene symbol | TIGIT | Gene ID | 201633 |
| Gene name | T cell immunoreceptor with Ig and ITIM domains | |
| Gene Alias | VSIG9 | |
| Cytomap | 3q13.31 | |
| Gene Type | protein-coding | GO ID | GO:0001775 | UniProtAcc | Q495A1 |
Top |
Malignant transformation analysis |
| Identification of the aberrant gene expression in precancerous and cancerous lesions by comparing the gene expression of stem-like cells in diseased tissues with normal stem cells |
| Entrez ID | Symbol | Replicates | Species | Organ | Tissue | Adj P-value | Log2FC | Malignancy |
| 201633 | TIGIT | LZE4T | Human | Esophagus | ESCC | 1.55e-10 | 5.07e-01 | 0.0811 |
| 201633 | TIGIT | LZE7T | Human | Esophagus | ESCC | 2.56e-05 | 3.34e-01 | 0.0667 |
| 201633 | TIGIT | LZE8T | Human | Esophagus | ESCC | 4.41e-02 | 1.56e-01 | 0.067 |
| 201633 | TIGIT | LZE6T | Human | Esophagus | ESCC | 2.95e-13 | 6.27e-01 | 0.0845 |
| 201633 | TIGIT | C21 | Human | Oral cavity | OSCC | 1.56e-10 | 3.29e-01 | 0.2678 |
| 201633 | TIGIT | C30 | Human | Oral cavity | OSCC | 8.19e-05 | 1.86e-01 | 0.3055 |
| 201633 | TIGIT | C38 | Human | Oral cavity | OSCC | 4.07e-13 | 1.35e+00 | 0.172 |
| 201633 | TIGIT | C46 | Human | Oral cavity | OSCC | 1.19e-04 | 1.33e-01 | 0.1673 |
| 201633 | TIGIT | C06 | Human | Oral cavity | OSCC | 1.27e-02 | 5.66e-01 | 0.2699 |
| 201633 | TIGIT | LN22 | Human | Oral cavity | OSCC | 1.09e-03 | 5.25e-01 | 0.1733 |
| 201633 | TIGIT | LN46 | Human | Oral cavity | OSCC | 1.62e-02 | 2.46e-01 | 0.1666 |
| Page: 1 |
| Tissue | Expression Dynamics | Abbreviation |
| Esophagus | 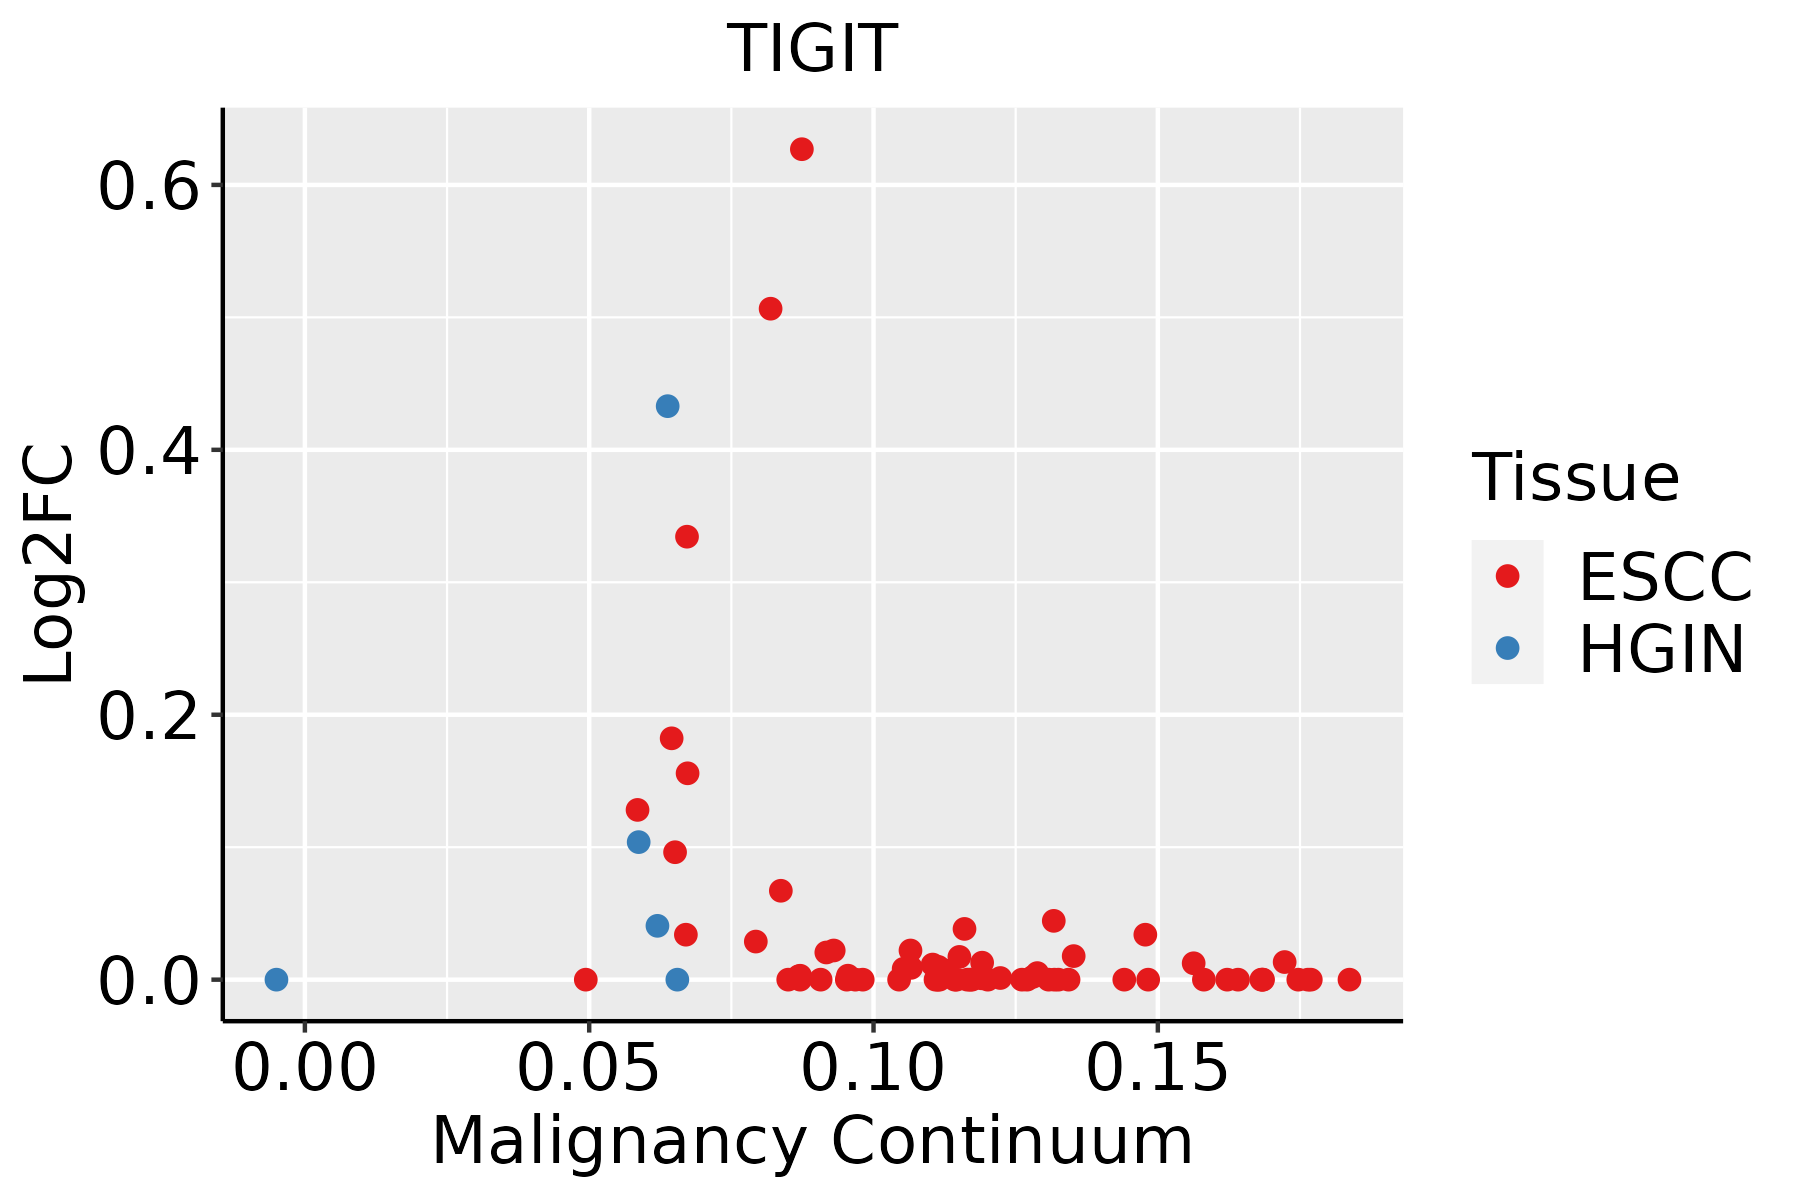 | ESCC: Esophageal squamous cell carcinoma |
| HGIN: High-grade intraepithelial neoplasias | ||
| LGIN: Low-grade intraepithelial neoplasias | ||
| Oral Cavity |  | EOLP: Erosive Oral lichen planus |
| LP: leukoplakia | ||
| NEOLP: Non-erosive oral lichen planus | ||
| OSCC: Oral squamous cell carcinoma |
| ∗log2FC in expression of this searched gene in stem-like cells from each diseased tissue sample relative to stem-like cells in normal samples in each tissue plotted against the malignancy continuum. Samples are colored based on if they are from different disease stage. |
Top |
Malignant transformation related pathway analysis |
| Find out the enriched GO biological processes and KEGG pathways involved in transition from healthy to precancer to cancer |
| Tissue | Disease Stage | Enriched GO biological Processes |
| Colorectum | AD |  |
| Colorectum | SER |  |
| Colorectum | MSS |  |
| Colorectum | MSI-H |  |
| Colorectum | FAP |  |
| ∗Top 15 enriched GO BP terms are showed in the bar plot of each disease state in each tissue. Each row represents a significant GO biological process which is colored according to the -log10(p.adjust). |
| Page: 1 2 3 4 5 6 7 8 9 |
| GO ID | Tissue | Disease Stage | Description | Gene Ratio | Bg Ratio | pvalue | p.adjust | Count |
| GO:002240720 | Esophagus | ESCC | regulation of cell-cell adhesion | 239/8552 | 448/18723 | 5.88e-04 | 3.19e-03 | 239 |
| GO:000268316 | Esophagus | ESCC | negative regulation of immune system process | 231/8552 | 434/18723 | 8.48e-04 | 4.36e-03 | 231 |
| GO:004211018 | Esophagus | ESCC | T cell activation | 256/8552 | 487/18723 | 1.18e-03 | 5.87e-03 | 256 |
| GO:000181916 | Esophagus | ESCC | positive regulation of cytokine production | 244/8552 | 467/18723 | 2.29e-03 | 1.01e-02 | 244 |
| GO:000715918 | Esophagus | ESCC | leukocyte cell-cell adhesion | 192/8552 | 371/18723 | 1.03e-02 | 3.51e-02 | 192 |
| GO:190303717 | Esophagus | ESCC | regulation of leukocyte cell-cell adhesion | 174/8552 | 336/18723 | 1.36e-02 | 4.43e-02 | 174 |
| GO:004211016 | Oral cavity | OSCC | T cell activation | 245/7305 | 487/18723 | 2.00e-07 | 3.22e-06 | 245 |
| GO:002240718 | Oral cavity | OSCC | regulation of cell-cell adhesion | 218/7305 | 448/18723 | 1.71e-05 | 1.68e-04 | 218 |
| GO:005086315 | Oral cavity | OSCC | regulation of T cell activation | 161/7305 | 329/18723 | 1.44e-04 | 1.02e-03 | 161 |
| GO:000715916 | Oral cavity | OSCC | leukocyte cell-cell adhesion | 178/7305 | 371/18723 | 2.44e-04 | 1.57e-03 | 178 |
| GO:190303715 | Oral cavity | OSCC | regulation of leukocyte cell-cell adhesion | 162/7305 | 336/18723 | 3.39e-04 | 2.08e-03 | 162 |
| GO:000268310 | Oral cavity | OSCC | negative regulation of immune system process | 204/7305 | 434/18723 | 3.72e-04 | 2.27e-03 | 204 |
| GO:00071629 | Oral cavity | OSCC | negative regulation of cell adhesion | 145/7305 | 303/18723 | 9.95e-04 | 5.18e-03 | 145 |
| GO:000181910 | Oral cavity | OSCC | positive regulation of cytokine production | 213/7305 | 467/18723 | 1.93e-03 | 8.96e-03 | 213 |
| GO:00224086 | Oral cavity | OSCC | negative regulation of cell-cell adhesion | 92/7305 | 196/18723 | 1.41e-02 | 4.64e-02 | 92 |
| Page: 1 |
| Pathway ID | Tissue | Disease Stage | Description | Gene Ratio | Bg Ratio | pvalue | p.adjust | qvalue | Count |
| Page: 1 |
Top |
Cell-cell communication analysis |
| Identification of potential cell-cell interactions between two cell types and their ligand-receptor pairs for different disease states |
| Ligand | Receptor | LRpair | Pathway | Tissue | Disease Stage |
| NECTIN2 | TIGIT | NECTIN2_TIGIT | NECTIN | Breast | ADJ |
| TIGIT | NECTIN2 | TIGIT_NECTIN2 | TIGIT | Breast | ADJ |
| TIGIT | PVR | TIGIT_PVR | TIGIT | Breast | ADJ |
| PVR | TIGIT | PVR_TIGIT | PVR | Breast | ADJ |
| NECTIN2 | TIGIT | NECTIN2_TIGIT | NECTIN | Breast | DCIS |
| TIGIT | NECTIN2 | TIGIT_NECTIN2 | TIGIT | Breast | DCIS |
| TIGIT | NECTIN2 | TIGIT_NECTIN2 | TIGIT | Breast | Healthy |
| TIGIT | PVR | TIGIT_PVR | TIGIT | Breast | Healthy |
| NECTIN2 | TIGIT | NECTIN2_TIGIT | NECTIN | Breast | Healthy |
| PVR | TIGIT | PVR_TIGIT | PVR | Breast | Healthy |
| NECTIN2 | TIGIT | NECTIN2_TIGIT | NECTIN | Breast | Precancer |
| TIGIT | NECTIN2 | TIGIT_NECTIN2 | TIGIT | Breast | Precancer |
| NECTIN2 | TIGIT | NECTIN2_TIGIT | NECTIN | Cervix | ADJ |
| TIGIT | NECTIN2 | TIGIT_NECTIN2 | TIGIT | Cervix | ADJ |
| NECTIN3 | TIGIT | NECTIN3_TIGIT | NECTIN | Cervix | CC |
| NECTIN2 | TIGIT | NECTIN2_TIGIT | NECTIN | Cervix | CC |
| TIGIT | NECTIN2 | TIGIT_NECTIN2 | TIGIT | Cervix | CC |
| NECTIN2 | TIGIT | NECTIN2_TIGIT | NECTIN | Cervix | Healthy |
| TIGIT | NECTIN2 | TIGIT_NECTIN2 | TIGIT | Cervix | Healthy |
| NECTIN2 | TIGIT | NECTIN2_TIGIT | NECTIN | Cervix | Precancer |
| Page: 1 2 3 |
Top |
Single-cell gene regulatory network inference analysis |
| Find out the significant the regulons (TFs) and the target genes of each regulon across cell types for different disease states |
| TF | Cell Type | Tissue | Disease Stage | Target Gene | RSS | Regulon Activity |
| ∗The dot plots of a searched regulon are shown for all cell subpopulations in each disease state of each tissue based on the regulon specific score inferred using pySCENIC and by calculating the average expression. |
| Page: 1 |
Top |
Somatic mutation of malignant transformation related genes |
| Annotation of somatic variants for genes involved in malignant transformation |
| Hugo Symbol | Variant Class | Variant Classification | dbSNP RS | HGVSc | HGVSp | HGVSp Short | SWISSPROT | BIOTYPE | SIFT | PolyPhen | Tumor Sample Barcode | Tissue | Histology | Sex | Age | Stage | Therapy Types | Drugs | Outcome |
| TIGIT | SNV | Missense_Mutation | c.394N>C | p.Ala132Pro | p.A132P | Q495A1 | protein_coding | tolerated(0.13) | benign(0.033) | TCGA-A2-A0T0-01 | Breast | breast invasive carcinoma | Female | <65 | I/II | Chemotherapy | taxotere | SD | |
| TIGIT | SNV | Missense_Mutation | novel | c.695N>T | p.Arg232Ile | p.R232I | Q495A1 | protein_coding | deleterious(0) | possibly_damaging(0.871) | TCGA-AN-A046-01 | Breast | breast invasive carcinoma | Female | >=65 | I/II | Unknown | Unknown | SD |
| TIGIT | SNV | Missense_Mutation | c.101N>T | p.Ser34Phe | p.S34F | Q495A1 | protein_coding | deleterious(0) | probably_damaging(0.985) | TCGA-E2-A159-01 | Breast | breast invasive carcinoma | Female | <65 | I/II | Chemotherapy | cyclophosphamide | SD | |
| TIGIT | SNV | Missense_Mutation | novel | c.49C>T | p.Pro17Ser | p.P17S | Q495A1 | protein_coding | tolerated(0.48) | benign(0.006) | TCGA-C5-A8YR-01 | Cervix | cervical & endocervical cancer | Female | <65 | I/II | Unknown | Unknown | PD |
| TIGIT | SNV | Missense_Mutation | rs142063959 | c.106N>A | p.Glu36Lys | p.E36K | Q495A1 | protein_coding | tolerated(0.41) | benign(0.005) | TCGA-DS-A0VN-01 | Cervix | cervical & endocervical cancer | Female | <65 | I/II | Chemotherapy | cisplatin | SD |
| TIGIT | SNV | Missense_Mutation | novel | c.685N>A | p.Leu229Met | p.L229M | Q495A1 | protein_coding | deleterious(0.01) | probably_damaging(0.997) | TCGA-A6-2672-01 | Colorectum | colon adenocarcinoma | Female | >=65 | III/IV | Unknown | Unknown | SD |
| TIGIT | SNV | Missense_Mutation | c.362N>T | p.Arg121Ile | p.R121I | Q495A1 | protein_coding | deleterious(0.02) | benign(0.17) | TCGA-A6-6141-01 | Colorectum | colon adenocarcinoma | Male | <65 | I/II | Chemotherapy | 5-fu | SD | |
| TIGIT | SNV | Missense_Mutation | c.356N>G | p.Thr119Ser | p.T119S | Q495A1 | protein_coding | tolerated(0.14) | benign(0.001) | TCGA-AA-3715-01 | Colorectum | colon adenocarcinoma | Male | >=65 | I/II | Unknown | Unknown | PD | |
| TIGIT | SNV | Missense_Mutation | c.362G>T | p.Arg121Ile | p.R121I | Q495A1 | protein_coding | deleterious(0.02) | benign(0.17) | TCGA-AA-A010-01 | Colorectum | colon adenocarcinoma | Female | <65 | I/II | Chemotherapy | folinic | CR | |
| TIGIT | SNV | Missense_Mutation | c.251N>A | p.Arg84Gln | p.R84Q | Q495A1 | protein_coding | tolerated(0.06) | benign(0.288) | TCGA-G4-6309-01 | Colorectum | colon adenocarcinoma | Female | <65 | III/IV | Chemotherapy | xeloda | PD |
| Page: 1 2 3 4 5 |
Top |
Related drugs of malignant transformation related genes |
| Identification of chemicals and drugs interact with genes involved in malignant transfromation |
| (DGIdb 4.0) |
| Entrez ID | Symbol | Category | Interaction Types | Drug Claim Name | Drug Name | PMIDs |
| 201633 | TIGIT | CELL SURFACE, CLINICALLY ACTIONABLE | ASP8374 | ASP-8374 |
| Page: 1 |

Copyright 2023-Present -The University of Texas Health Science Center at Houston |