
|
|||||
|
 | |
| |
| |
| |
| |
| |
|
Gene: TIFA |
Gene summary for TIFA |
| Gene information | Species | Human | Gene symbol | TIFA | Gene ID | 92610 |
| Gene name | TRAF interacting protein with forkhead associated domain | |
| Gene Alias | T2BP | |
| Cytomap | 4q25 | |
| Gene Type | protein-coding | GO ID | GO:0002221 | UniProtAcc | Q96CG3 |
Top |
Malignant transformation analysis |
| Identification of the aberrant gene expression in precancerous and cancerous lesions by comparing the gene expression of stem-like cells in diseased tissues with normal stem cells |
| Entrez ID | Symbol | Replicates | Species | Organ | Tissue | Adj P-value | Log2FC | Malignancy |
| 92610 | TIFA | LZE8T | Human | Esophagus | ESCC | 5.65e-10 | 2.24e-01 | 0.067 |
| 92610 | TIFA | LZE20T | Human | Esophagus | ESCC | 3.84e-04 | -4.12e-02 | 0.0662 |
| 92610 | TIFA | LZE24T | Human | Esophagus | ESCC | 1.02e-08 | 1.33e-01 | 0.0596 |
| 92610 | TIFA | LZE21T | Human | Esophagus | ESCC | 5.06e-06 | 2.15e-01 | 0.0655 |
| 92610 | TIFA | LZE6T | Human | Esophagus | ESCC | 3.64e-06 | 1.97e-01 | 0.0845 |
| 92610 | TIFA | P1T-E | Human | Esophagus | ESCC | 3.86e-03 | 2.27e-01 | 0.0875 |
| 92610 | TIFA | P2T-E | Human | Esophagus | ESCC | 2.64e-50 | 1.03e+00 | 0.1177 |
| 92610 | TIFA | P4T-E | Human | Esophagus | ESCC | 9.51e-14 | 3.93e-01 | 0.1323 |
| 92610 | TIFA | P5T-E | Human | Esophagus | ESCC | 6.73e-09 | 3.76e-02 | 0.1327 |
| 92610 | TIFA | P8T-E | Human | Esophagus | ESCC | 2.01e-11 | 3.27e-01 | 0.0889 |
| 92610 | TIFA | P9T-E | Human | Esophagus | ESCC | 1.43e-03 | 4.94e-02 | 0.1131 |
| 92610 | TIFA | P10T-E | Human | Esophagus | ESCC | 1.25e-11 | 3.36e-02 | 0.116 |
| 92610 | TIFA | P11T-E | Human | Esophagus | ESCC | 8.01e-06 | 1.64e-01 | 0.1426 |
| 92610 | TIFA | P12T-E | Human | Esophagus | ESCC | 6.73e-26 | 3.89e-01 | 0.1122 |
| 92610 | TIFA | P15T-E | Human | Esophagus | ESCC | 1.91e-13 | 2.90e-01 | 0.1149 |
| 92610 | TIFA | P16T-E | Human | Esophagus | ESCC | 8.36e-25 | 5.82e-01 | 0.1153 |
| 92610 | TIFA | P17T-E | Human | Esophagus | ESCC | 5.03e-03 | 1.28e-01 | 0.1278 |
| 92610 | TIFA | P20T-E | Human | Esophagus | ESCC | 3.49e-08 | 9.58e-02 | 0.1124 |
| 92610 | TIFA | P21T-E | Human | Esophagus | ESCC | 4.67e-05 | 1.14e-01 | 0.1617 |
| 92610 | TIFA | P22T-E | Human | Esophagus | ESCC | 5.61e-12 | 1.93e-01 | 0.1236 |
| Page: 1 2 3 4 |
| Tissue | Expression Dynamics | Abbreviation |
| Esophagus | 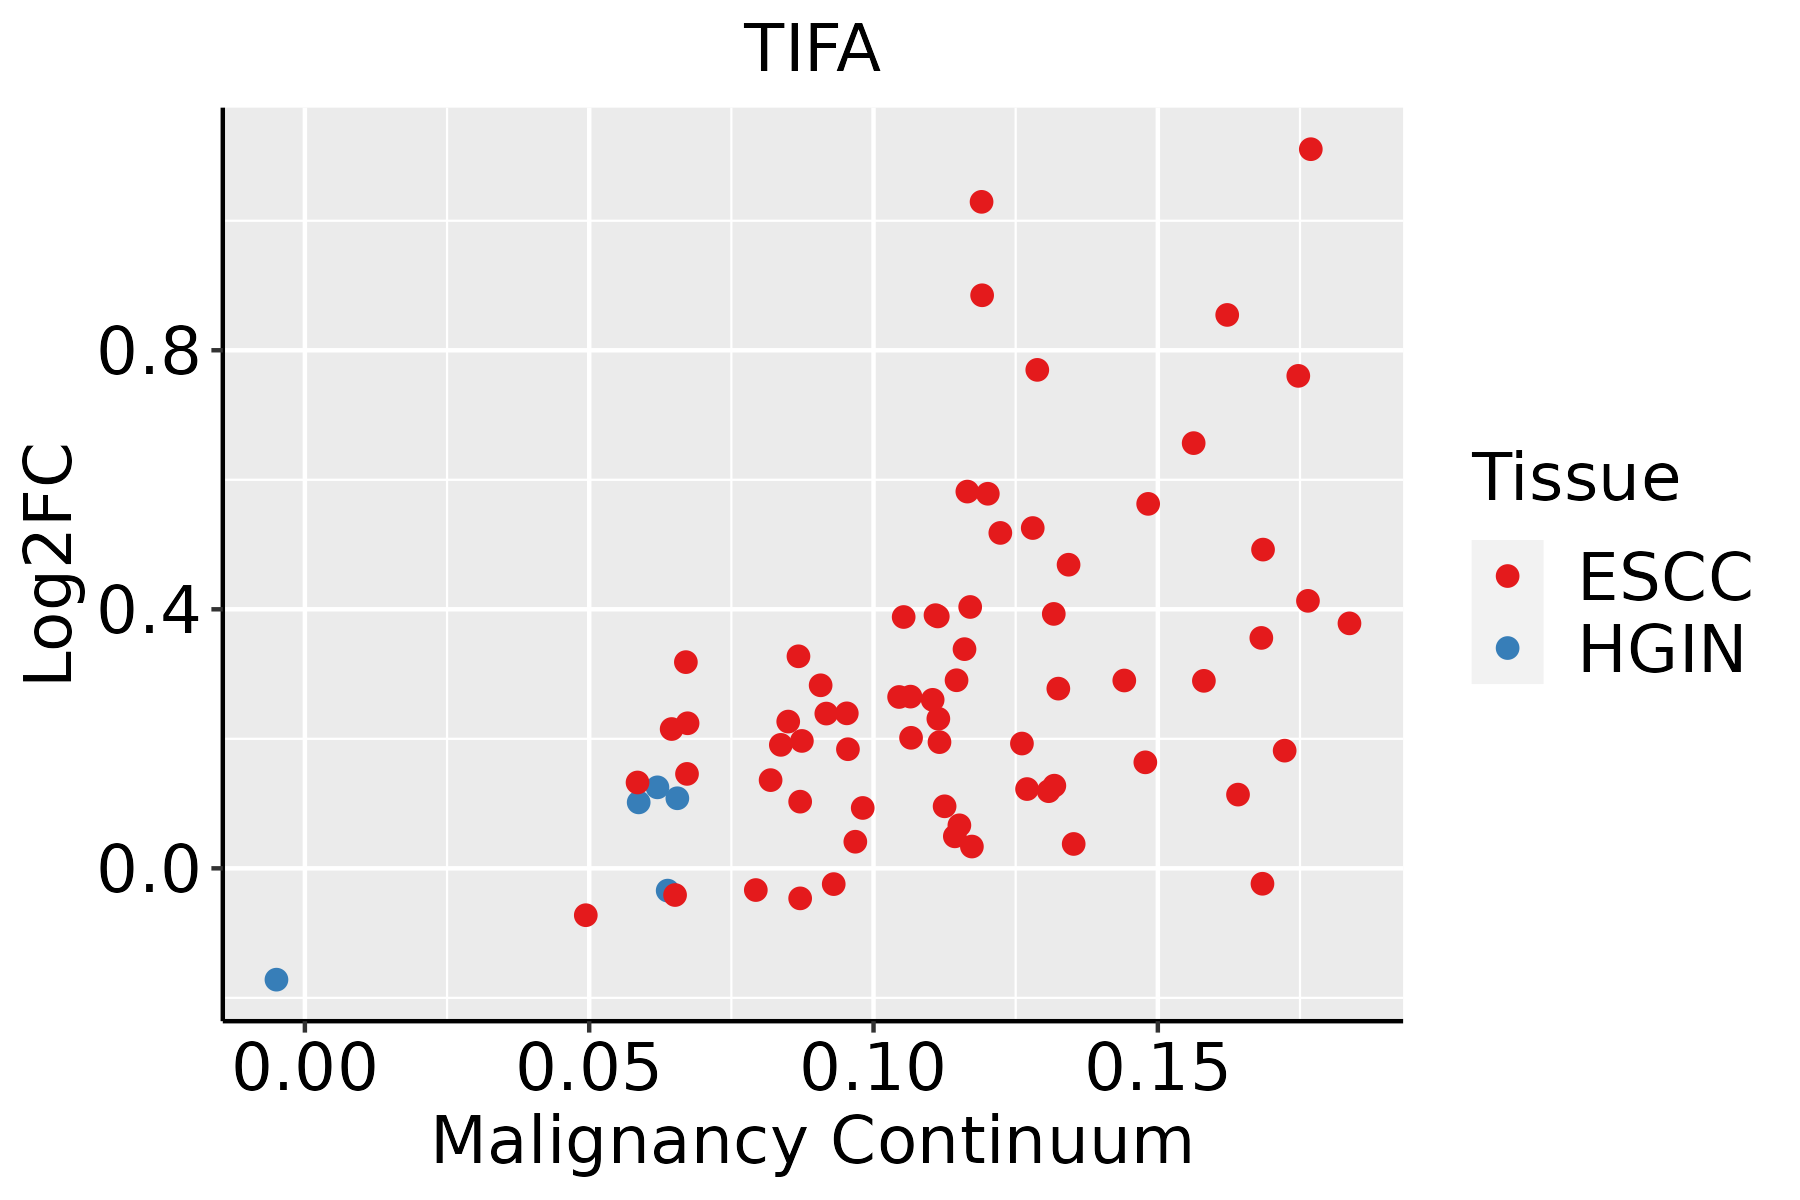 | ESCC: Esophageal squamous cell carcinoma |
| HGIN: High-grade intraepithelial neoplasias | ||
| LGIN: Low-grade intraepithelial neoplasias | ||
| Oral Cavity |  | EOLP: Erosive Oral lichen planus |
| LP: leukoplakia | ||
| NEOLP: Non-erosive oral lichen planus | ||
| OSCC: Oral squamous cell carcinoma |
| ∗log2FC in expression of this searched gene in stem-like cells from each diseased tissue sample relative to stem-like cells in normal samples in each tissue plotted against the malignancy continuum. Samples are colored based on if they are from different disease stage. |
Top |
Malignant transformation related pathway analysis |
| Find out the enriched GO biological processes and KEGG pathways involved in transition from healthy to precancer to cancer |
| Tissue | Disease Stage | Enriched GO biological Processes |
| Colorectum | AD |  |
| Colorectum | SER |  |
| Colorectum | MSS |  |
| Colorectum | MSI-H |  |
| Colorectum | FAP |  |
| ∗Top 15 enriched GO BP terms are showed in the bar plot of each disease state in each tissue. Each row represents a significant GO biological process which is colored according to the -log10(p.adjust). |
| Page: 1 2 3 4 5 6 7 8 9 |
| GO ID | Tissue | Disease Stage | Description | Gene Ratio | Bg Ratio | pvalue | p.adjust | Count |
| GO:004312318 | Esophagus | ESCC | positive regulation of I-kappaB kinase/NF-kappaB signaling | 132/8552 | 186/18723 | 2.07e-12 | 8.58e-11 | 132 |
| GO:0043122110 | Esophagus | ESCC | regulation of I-kappaB kinase/NF-kappaB signaling | 167/8552 | 249/18723 | 6.11e-12 | 2.32e-10 | 167 |
| GO:000724919 | Esophagus | ESCC | I-kappaB kinase/NF-kappaB signaling | 183/8552 | 281/18723 | 3.02e-11 | 1.01e-09 | 183 |
| GO:0030522110 | Esophagus | ESCC | intracellular receptor signaling pathway | 170/8552 | 265/18723 | 8.58e-10 | 2.09e-08 | 170 |
| GO:000275313 | Esophagus | ESCC | cytoplasmic pattern recognition receptor signaling pathway | 41/8552 | 60/18723 | 3.25e-04 | 1.91e-03 | 41 |
| GO:00512592 | Esophagus | ESCC | protein complex oligomerization | 130/8552 | 238/18723 | 3.29e-03 | 1.36e-02 | 130 |
| GO:004312218 | Oral cavity | OSCC | regulation of I-kappaB kinase/NF-kappaB signaling | 155/7305 | 249/18723 | 7.79e-14 | 4.14e-12 | 155 |
| GO:004312310 | Oral cavity | OSCC | positive regulation of I-kappaB kinase/NF-kappaB signaling | 122/7305 | 186/18723 | 1.68e-13 | 8.52e-12 | 122 |
| GO:000724910 | Oral cavity | OSCC | I-kappaB kinase/NF-kappaB signaling | 169/7305 | 281/18723 | 4.69e-13 | 2.25e-11 | 169 |
| GO:003052218 | Oral cavity | OSCC | intracellular receptor signaling pathway | 149/7305 | 265/18723 | 8.69e-09 | 1.81e-07 | 149 |
| GO:00022214 | Oral cavity | OSCC | pattern recognition receptor signaling pathway | 95/7305 | 172/18723 | 1.11e-05 | 1.15e-04 | 95 |
| GO:00027537 | Oral cavity | OSCC | cytoplasmic pattern recognition receptor signaling pathway | 40/7305 | 60/18723 | 1.32e-05 | 1.33e-04 | 40 |
| GO:0051259 | Oral cavity | OSCC | protein complex oligomerization | 121/7305 | 238/18723 | 1.29e-04 | 9.21e-04 | 121 |
| GO:00027646 | Oral cavity | OSCC | immune response-regulating signaling pathway | 212/7305 | 468/18723 | 2.93e-03 | 1.27e-02 | 212 |
| GO:004312316 | Oral cavity | LP | positive regulation of I-kappaB kinase/NF-kappaB signaling | 88/4623 | 186/18723 | 1.58e-11 | 1.13e-09 | 88 |
| GO:004312219 | Oral cavity | LP | regulation of I-kappaB kinase/NF-kappaB signaling | 103/4623 | 249/18723 | 4.48e-09 | 1.90e-07 | 103 |
| GO:000724917 | Oral cavity | LP | I-kappaB kinase/NF-kappaB signaling | 110/4623 | 281/18723 | 4.94e-08 | 1.70e-06 | 110 |
| GO:00512591 | Oral cavity | LP | protein complex oligomerization | 85/4623 | 238/18723 | 8.81e-05 | 1.11e-03 | 85 |
| GO:003052219 | Oral cavity | LP | intracellular receptor signaling pathway | 87/4623 | 265/18723 | 1.63e-03 | 1.25e-02 | 87 |
| Page: 1 |
| Pathway ID | Tissue | Disease Stage | Description | Gene Ratio | Bg Ratio | pvalue | p.adjust | qvalue | Count |
| hsa05131211 | Esophagus | ESCC | Shigellosis | 176/4205 | 247/8465 | 2.27e-12 | 4.01e-11 | 2.05e-11 | 176 |
| hsa05131310 | Esophagus | ESCC | Shigellosis | 176/4205 | 247/8465 | 2.27e-12 | 4.01e-11 | 2.05e-11 | 176 |
| hsa0513130 | Oral cavity | OSCC | Shigellosis | 150/3704 | 247/8465 | 3.96e-08 | 3.12e-07 | 1.59e-07 | 150 |
| hsa05131113 | Oral cavity | OSCC | Shigellosis | 150/3704 | 247/8465 | 3.96e-08 | 3.12e-07 | 1.59e-07 | 150 |
| hsa05131210 | Oral cavity | LP | Shigellosis | 103/2418 | 247/8465 | 4.98e-06 | 4.14e-05 | 2.67e-05 | 103 |
| hsa0513138 | Oral cavity | LP | Shigellosis | 103/2418 | 247/8465 | 4.98e-06 | 4.14e-05 | 2.67e-05 | 103 |
| Page: 1 |
Top |
Cell-cell communication analysis |
| Identification of potential cell-cell interactions between two cell types and their ligand-receptor pairs for different disease states |
| Ligand | Receptor | LRpair | Pathway | Tissue | Disease Stage |
| Page: 1 |
Top |
Single-cell gene regulatory network inference analysis |
| Find out the significant the regulons (TFs) and the target genes of each regulon across cell types for different disease states |
| TF | Cell Type | Tissue | Disease Stage | Target Gene | RSS | Regulon Activity |
| ∗The dot plots of a searched regulon are shown for all cell subpopulations in each disease state of each tissue based on the regulon specific score inferred using pySCENIC and by calculating the average expression. |
| Page: 1 |
Top |
Somatic mutation of malignant transformation related genes |
| Annotation of somatic variants for genes involved in malignant transformation |
| Hugo Symbol | Variant Class | Variant Classification | dbSNP RS | HGVSc | HGVSp | HGVSp Short | SWISSPROT | BIOTYPE | SIFT | PolyPhen | Tumor Sample Barcode | Tissue | Histology | Sex | Age | Stage | Therapy Types | Drugs | Outcome |
| TIFA | SNV | Missense_Mutation | rs772755702 | c.51N>C | p.Gln17His | p.Q17H | Q96CG3 | protein_coding | tolerated(1) | benign(0) | TCGA-A8-A095-01 | Breast | breast invasive carcinoma | Female | <65 | I/II | Chemotherapy | 5-fluorouracil | CR |
| TIFA | SNV | Missense_Mutation | c.433N>T | p.Pro145Ser | p.P145S | Q96CG3 | protein_coding | tolerated(0.51) | benign(0.005) | TCGA-AC-A23H-01 | Breast | breast invasive carcinoma | Female | >=65 | I/II | Unknown | Unknown | PD | |
| TIFA | insertion | In_Frame_Ins | novel | c.88_89insGGAAGATGGCGAGTCATTGGAATTTTTTGAGACTCAATT | p.Ile30delinsArgLysMetAlaSerHisTrpAsnPheLeuArgLeuAsnLeu | p.I30delinsRKMASHWNFLRLNL | Q96CG3 | protein_coding | TCGA-A2-A04T-01 | Breast | breast invasive carcinoma | Female | <65 | I/II | Chemotherapy | cyclophosphamide | SD | ||
| TIFA | SNV | Missense_Mutation | novel | c.524N>A | p.Ser175Tyr | p.S175Y | Q96CG3 | protein_coding | tolerated(1) | benign(0.01) | TCGA-AA-3984-01 | Colorectum | colon adenocarcinoma | Female | <65 | I/II | Unknown | Unknown | SD |
| TIFA | SNV | Missense_Mutation | novel | c.146T>G | p.Phe49Cys | p.F49C | Q96CG3 | protein_coding | deleterious(0) | probably_damaging(0.977) | TCGA-F5-6814-01 | Colorectum | rectum adenocarcinoma | Male | <65 | I/II | Unknown | Unknown | SD |
| TIFA | SNV | Missense_Mutation | novel | c.524N>A | p.Ser175Tyr | p.S175Y | Q96CG3 | protein_coding | tolerated(1) | benign(0.01) | TCGA-AP-A056-01 | Endometrium | uterine corpus endometrioid carcinoma | Female | <65 | I/II | Unknown | Unknown | SD |
| TIFA | SNV | Missense_Mutation | novel | c.23N>G | p.Asp8Gly | p.D8G | Q96CG3 | protein_coding | deleterious(0.03) | probably_damaging(0.941) | TCGA-AP-A056-01 | Endometrium | uterine corpus endometrioid carcinoma | Female | <65 | I/II | Unknown | Unknown | SD |
| TIFA | SNV | Missense_Mutation | novel | c.338N>G | p.Tyr113Cys | p.Y113C | Q96CG3 | protein_coding | tolerated(0.18) | possibly_damaging(0.669) | TCGA-AX-A05Z-01 | Endometrium | uterine corpus endometrioid carcinoma | Female | <65 | III/IV | Chemotherapy | adriamycin | SD |
| TIFA | SNV | Missense_Mutation | novel | c.458N>G | p.Asn153Ser | p.N153S | Q96CG3 | protein_coding | tolerated(0.4) | benign(0) | TCGA-D1-A16X-01 | Endometrium | uterine corpus endometrioid carcinoma | Female | <65 | I/II | Unknown | Unknown | SD |
| TIFA | SNV | Missense_Mutation | novel | c.247N>A | p.Leu83Ile | p.L83I | Q96CG3 | protein_coding | deleterious(0.01) | benign(0.311) | TCGA-EO-A3B0-01 | Endometrium | uterine corpus endometrioid carcinoma | Female | <65 | III/IV | Unknown | Unknown | SD |
| Page: 1 2 |
Top |
Related drugs of malignant transformation related genes |
| Identification of chemicals and drugs interact with genes involved in malignant transfromation |
| (DGIdb 4.0) |
| Entrez ID | Symbol | Category | Interaction Types | Drug Claim Name | Drug Name | PMIDs |
| Page: 1 |

Copyright 2023-Present -The University of Texas Health Science Center at Houston |