
|
|||||
|
 | |
| |
| |
| |
| |
| |
|
Gene: TIAM1 |
Gene summary for TIAM1 |
| Gene information | Species | Human | Gene symbol | TIAM1 | Gene ID | 7074 |
| Gene name | TIAM Rac1 associated GEF 1 | |
| Gene Alias | TIAM-1 | |
| Cytomap | 21q22.11 | |
| Gene Type | protein-coding | GO ID | GO:0000165 | UniProtAcc | Q13009 |
Top |
Malignant transformation analysis |
| Identification of the aberrant gene expression in precancerous and cancerous lesions by comparing the gene expression of stem-like cells in diseased tissues with normal stem cells |
| Entrez ID | Symbol | Replicates | Species | Organ | Tissue | Adj P-value | Log2FC | Malignancy |
| 7074 | TIAM1 | CCI_1 | Human | Cervix | CC | 6.22e-17 | 1.56e+00 | 0.528 |
| 7074 | TIAM1 | CCI_2 | Human | Cervix | CC | 1.25e-05 | 9.57e-01 | 0.5249 |
| 7074 | TIAM1 | CCI_3 | Human | Cervix | CC | 2.01e-07 | 7.55e-01 | 0.516 |
| 7074 | TIAM1 | AEH-subject2 | Human | Endometrium | AEH | 2.67e-03 | 1.57e-01 | -0.2525 |
| 7074 | TIAM1 | AEH-subject4 | Human | Endometrium | AEH | 7.66e-11 | 4.04e-01 | -0.2657 |
| 7074 | TIAM1 | AEH-subject5 | Human | Endometrium | AEH | 3.46e-33 | 7.75e-01 | -0.2953 |
| 7074 | TIAM1 | EEC-subject2 | Human | Endometrium | EEC | 1.59e-10 | 3.41e-01 | -0.2607 |
| 7074 | TIAM1 | P2T-E | Human | Esophagus | ESCC | 1.20e-14 | 6.68e-02 | 0.1177 |
| 7074 | TIAM1 | P4T-E | Human | Esophagus | ESCC | 4.06e-04 | 1.12e-01 | 0.1323 |
| 7074 | TIAM1 | P5T-E | Human | Esophagus | ESCC | 3.41e-07 | 1.05e-02 | 0.1327 |
| 7074 | TIAM1 | P8T-E | Human | Esophagus | ESCC | 7.87e-05 | -2.35e-02 | 0.0889 |
| 7074 | TIAM1 | P9T-E | Human | Esophagus | ESCC | 3.79e-04 | 7.92e-02 | 0.1131 |
| 7074 | TIAM1 | P10T-E | Human | Esophagus | ESCC | 1.07e-49 | 8.69e-01 | 0.116 |
| 7074 | TIAM1 | P11T-E | Human | Esophagus | ESCC | 5.58e-03 | 9.96e-02 | 0.1426 |
| 7074 | TIAM1 | P12T-E | Human | Esophagus | ESCC | 3.03e-05 | 6.09e-02 | 0.1122 |
| 7074 | TIAM1 | P15T-E | Human | Esophagus | ESCC | 8.37e-03 | 1.77e-02 | 0.1149 |
| 7074 | TIAM1 | P16T-E | Human | Esophagus | ESCC | 5.86e-04 | 2.00e-02 | 0.1153 |
| 7074 | TIAM1 | P21T-E | Human | Esophagus | ESCC | 3.49e-03 | -7.68e-02 | 0.1617 |
| 7074 | TIAM1 | P22T-E | Human | Esophagus | ESCC | 3.39e-08 | -4.21e-02 | 0.1236 |
| 7074 | TIAM1 | P23T-E | Human | Esophagus | ESCC | 2.06e-05 | 1.88e-01 | 0.108 |
| Page: 1 2 3 4 5 |
| Tissue | Expression Dynamics | Abbreviation |
| Cervix | 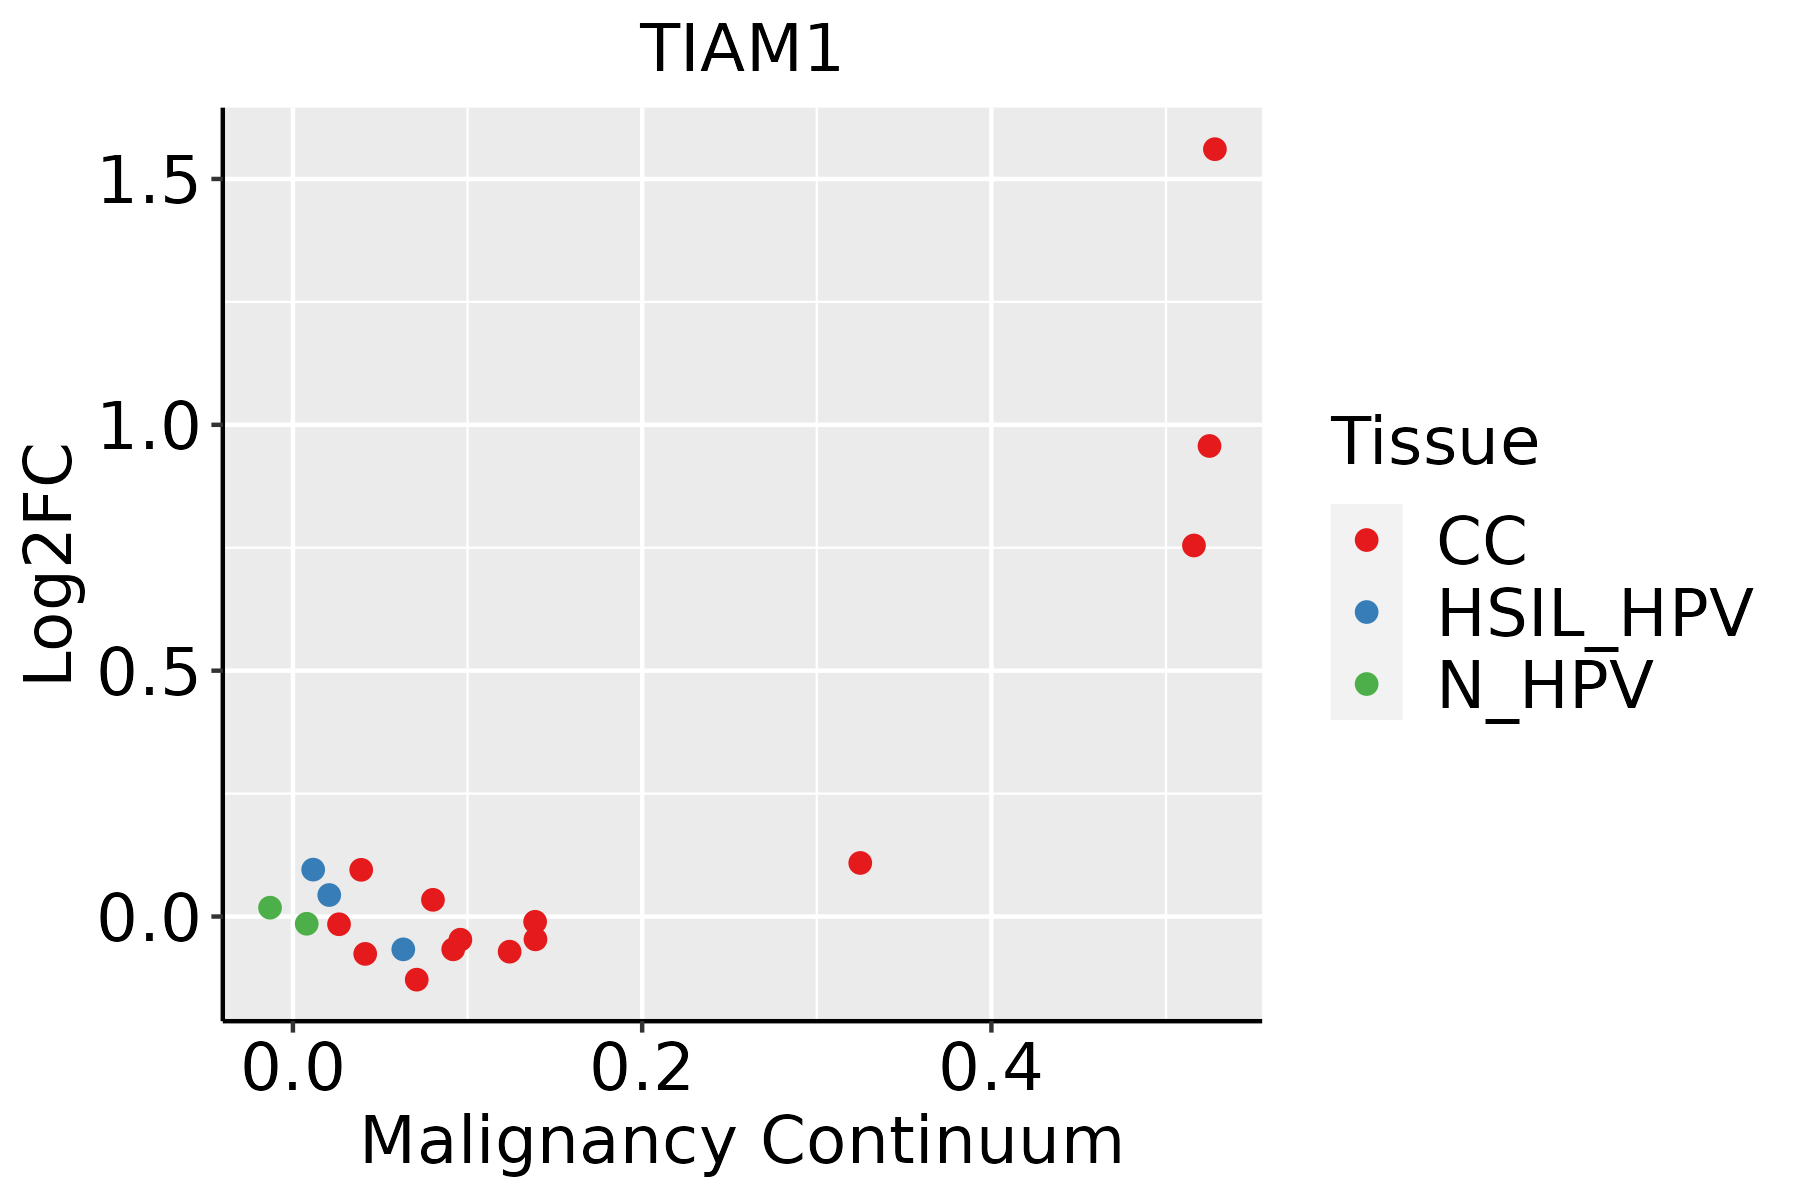 | CC: Cervix cancer |
| HSIL_HPV: HPV-infected high-grade squamous intraepithelial lesions | ||
| N_HPV: HPV-infected normal cervix | ||
| Endometrium | 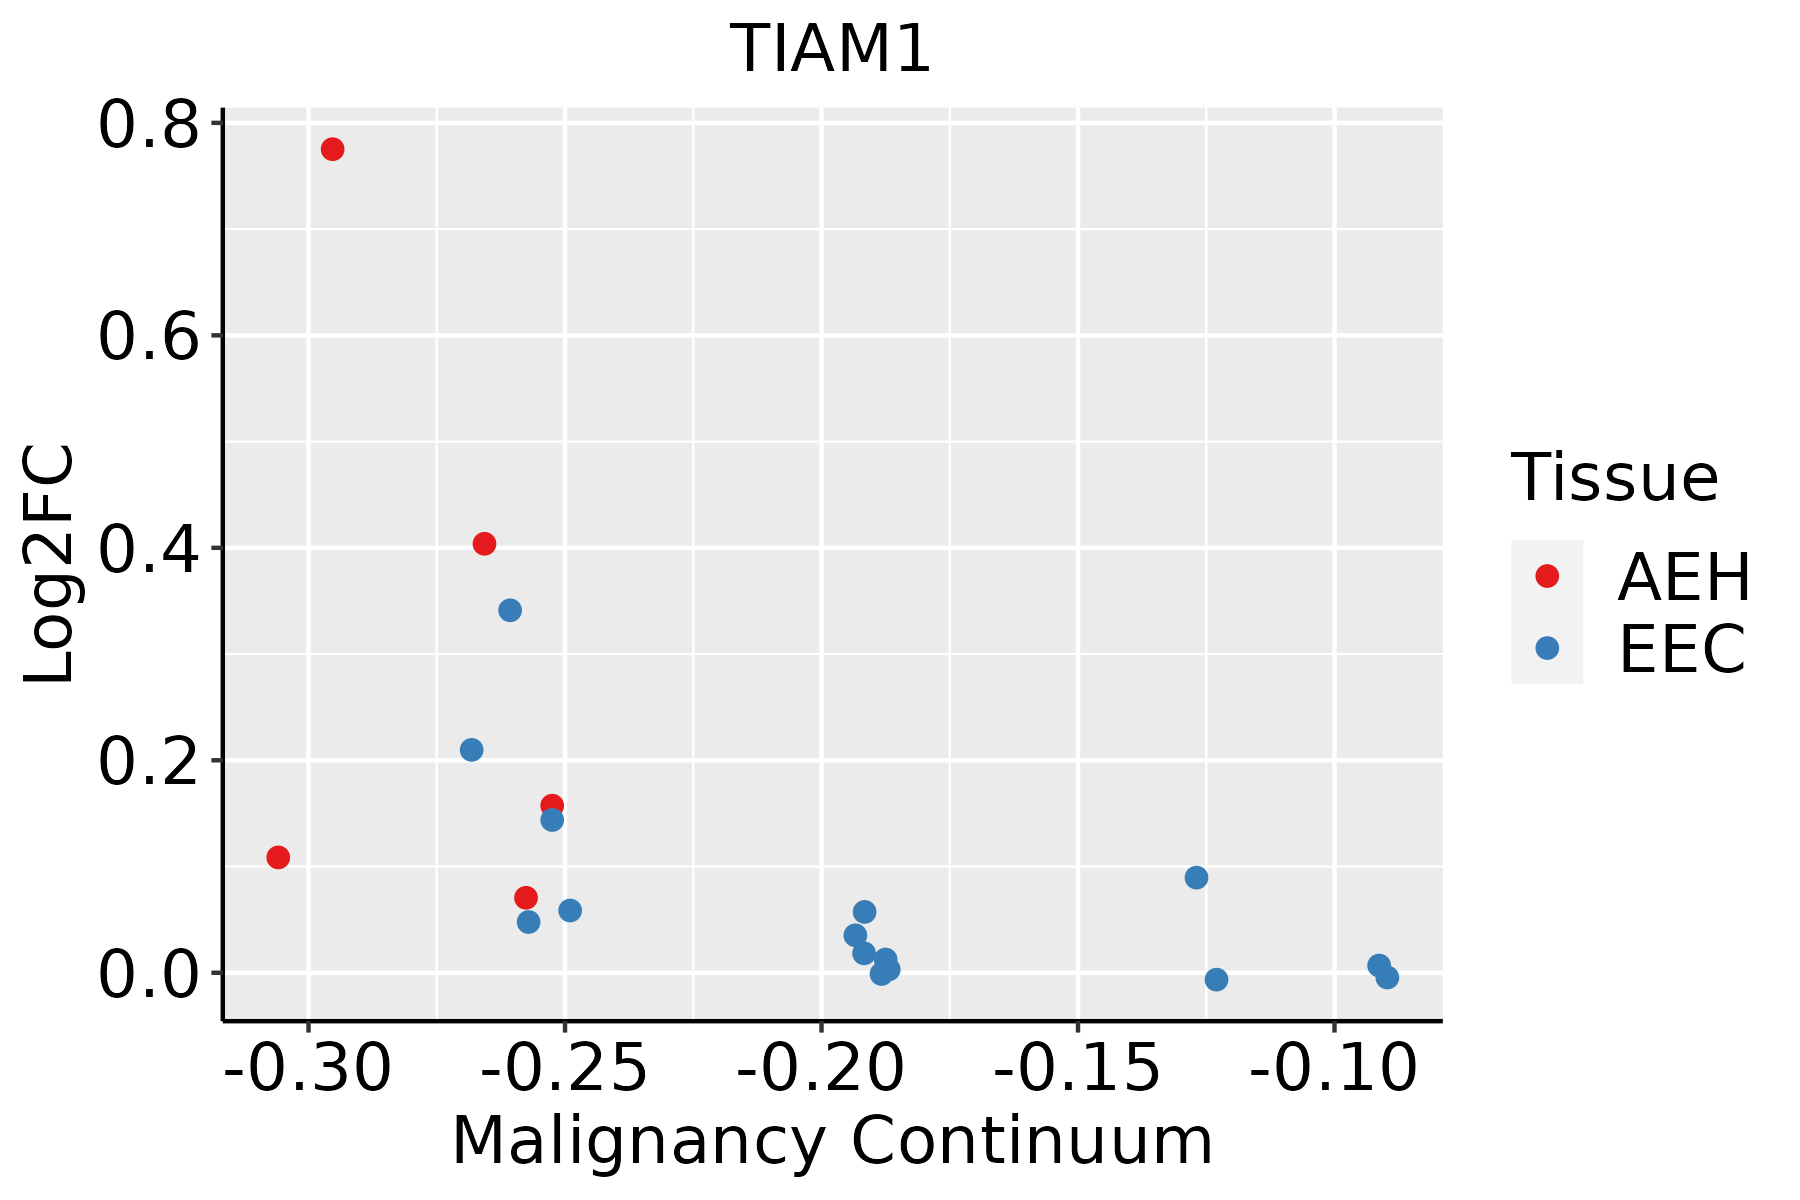 | AEH: Atypical endometrial hyperplasia |
| EEC: Endometrioid Cancer | ||
| Esophagus | 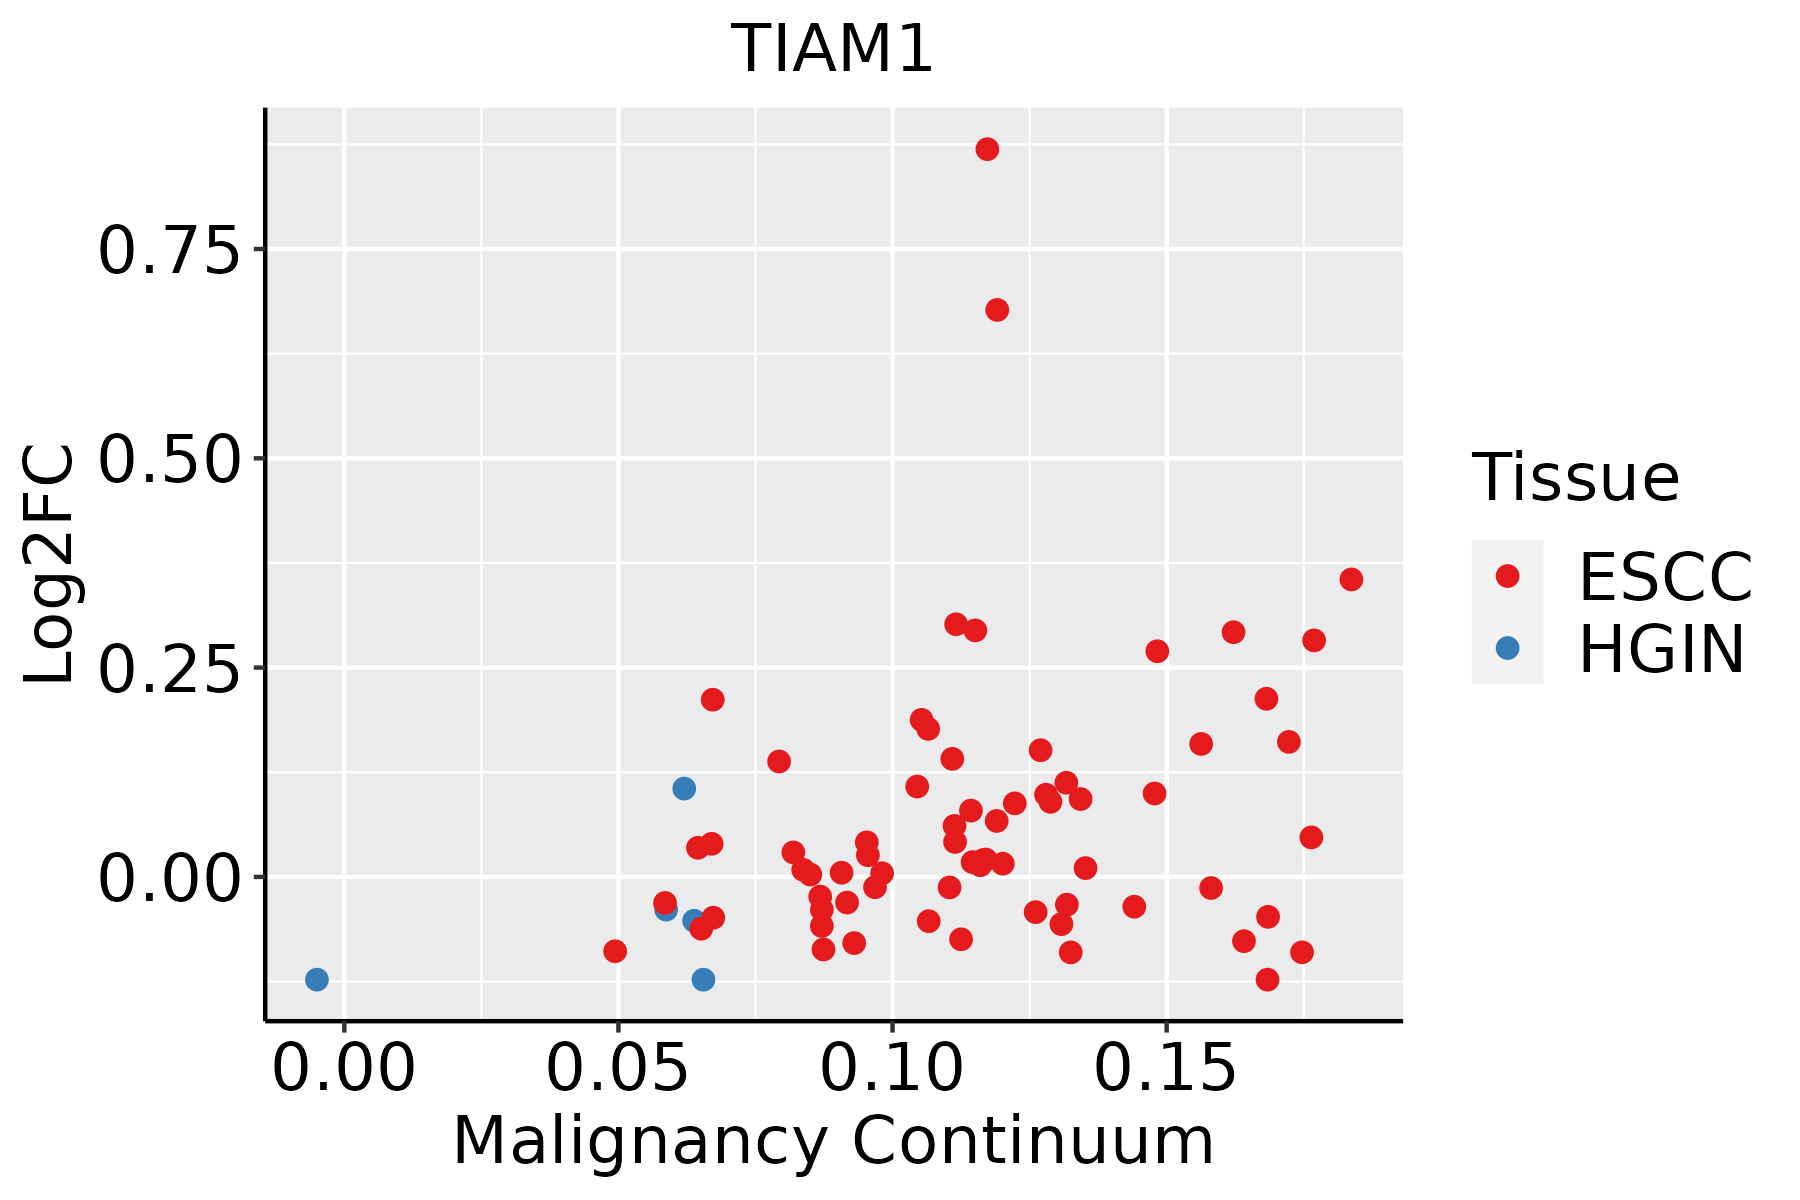 | ESCC: Esophageal squamous cell carcinoma |
| HGIN: High-grade intraepithelial neoplasias | ||
| LGIN: Low-grade intraepithelial neoplasias | ||
| Oral Cavity | 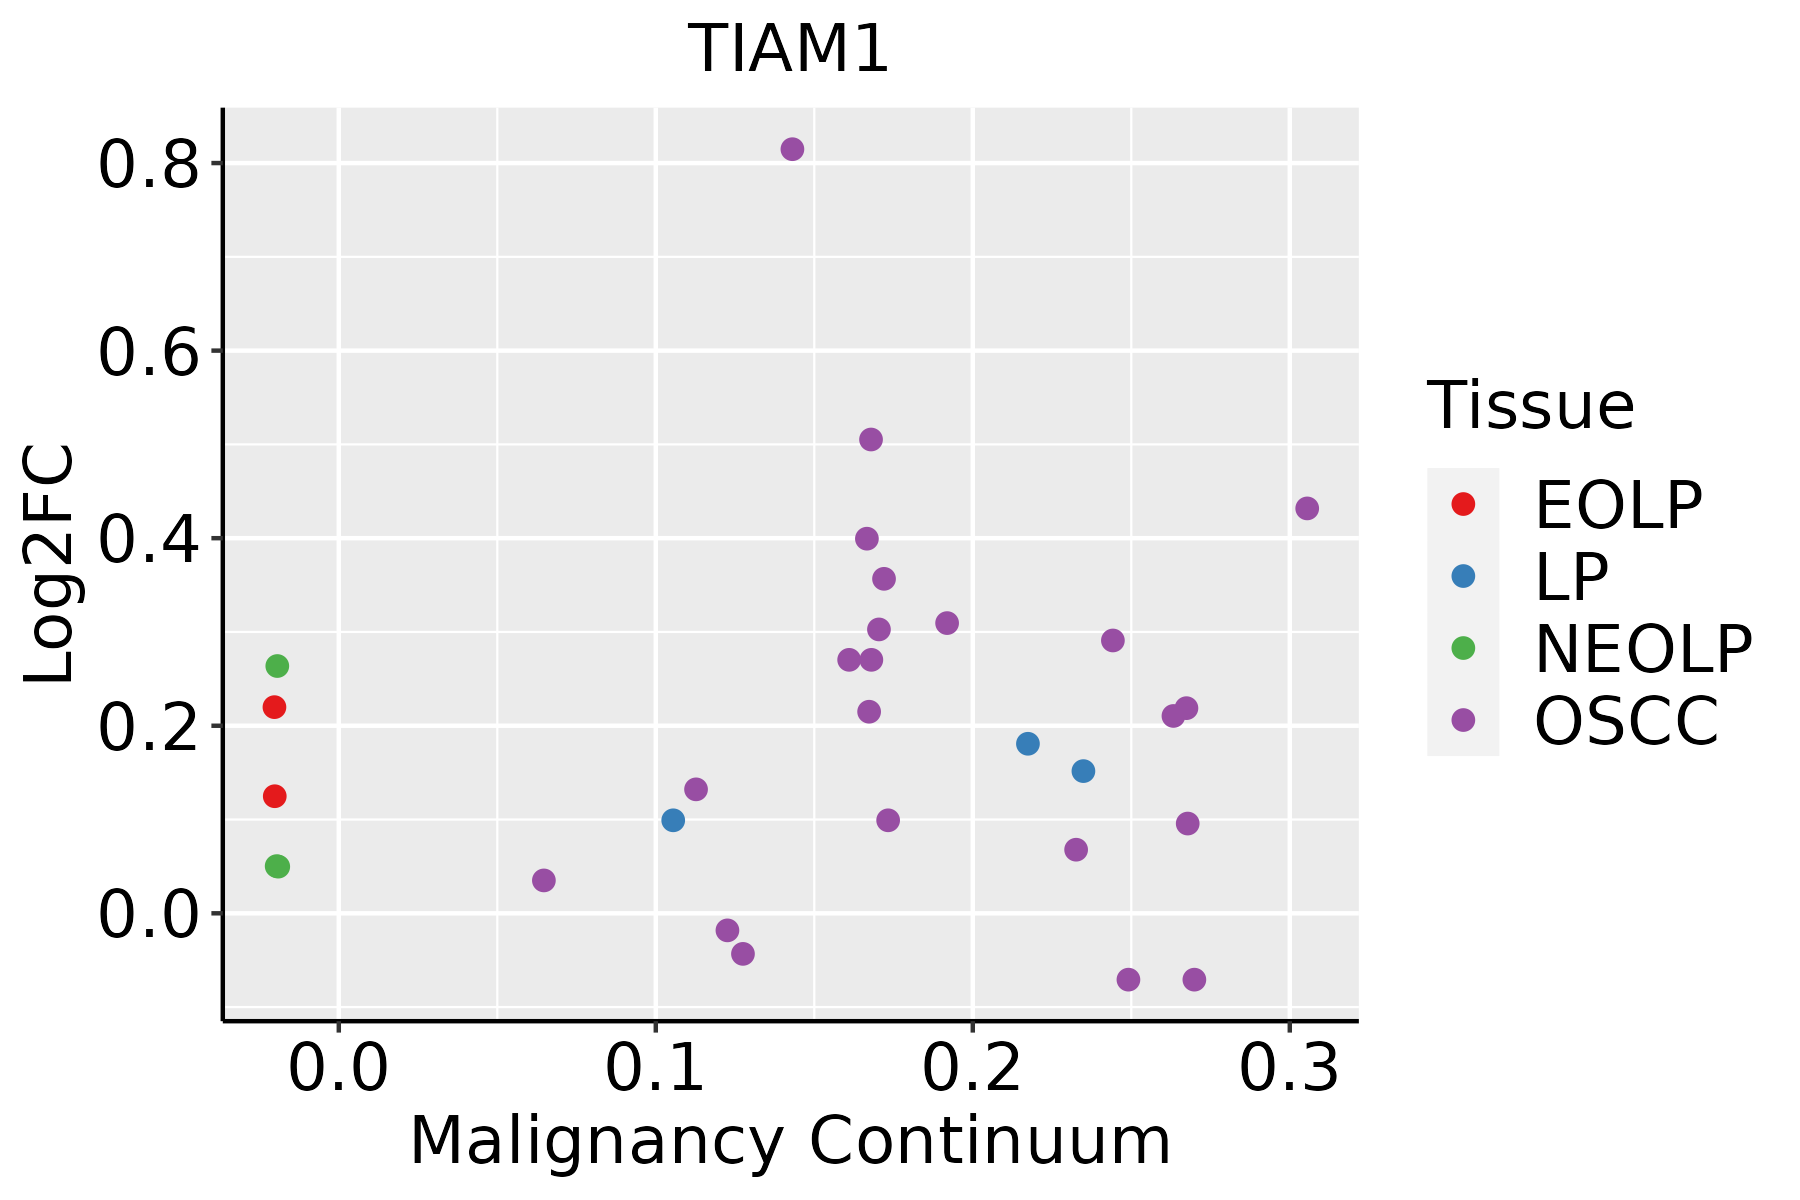 | EOLP: Erosive Oral lichen planus |
| LP: leukoplakia | ||
| NEOLP: Non-erosive oral lichen planus | ||
| OSCC: Oral squamous cell carcinoma | ||
| Prostate |  | BPH: Benign Prostatic Hyperplasia |
| Skin | 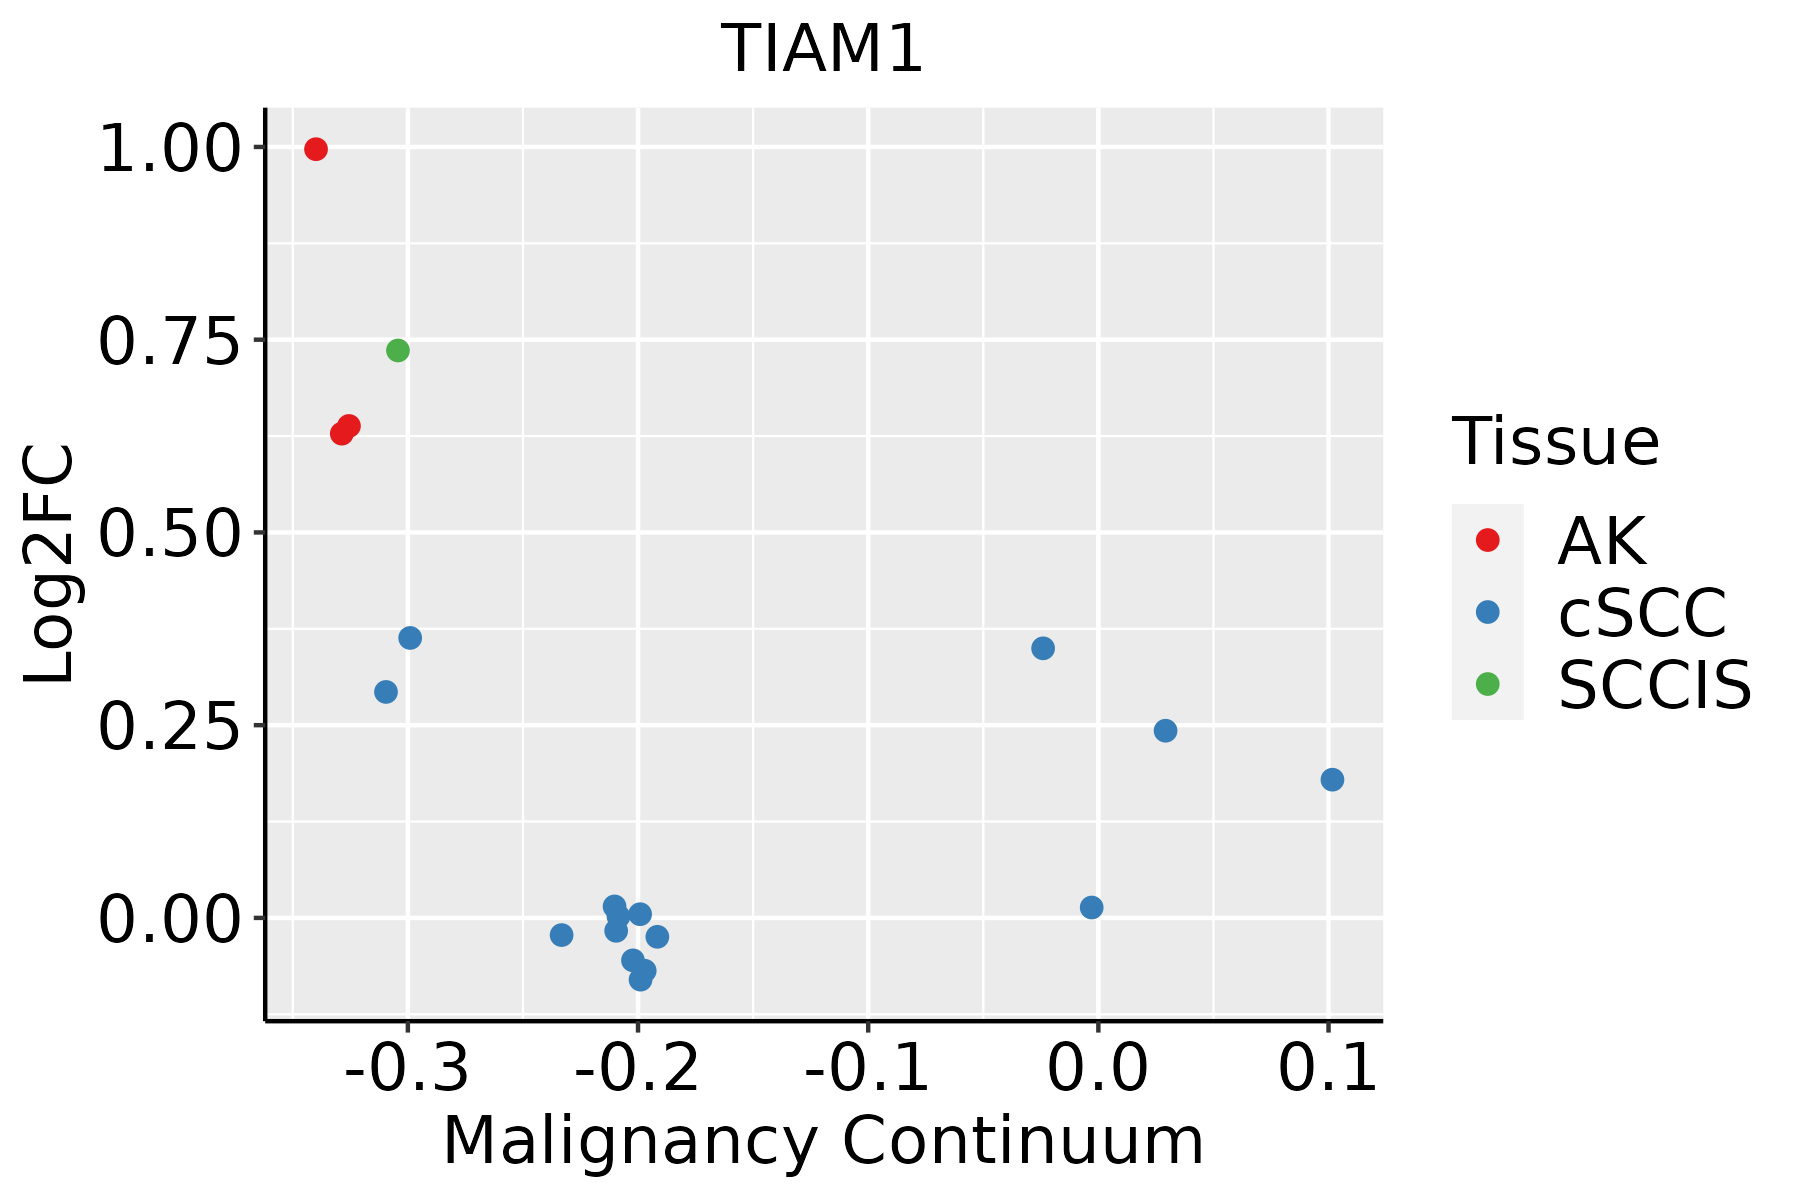 | AK: Actinic keratosis |
| cSCC: Cutaneous squamous cell carcinoma | ||
| SCCIS:squamous cell carcinoma in situ | ||
| Thyroid | 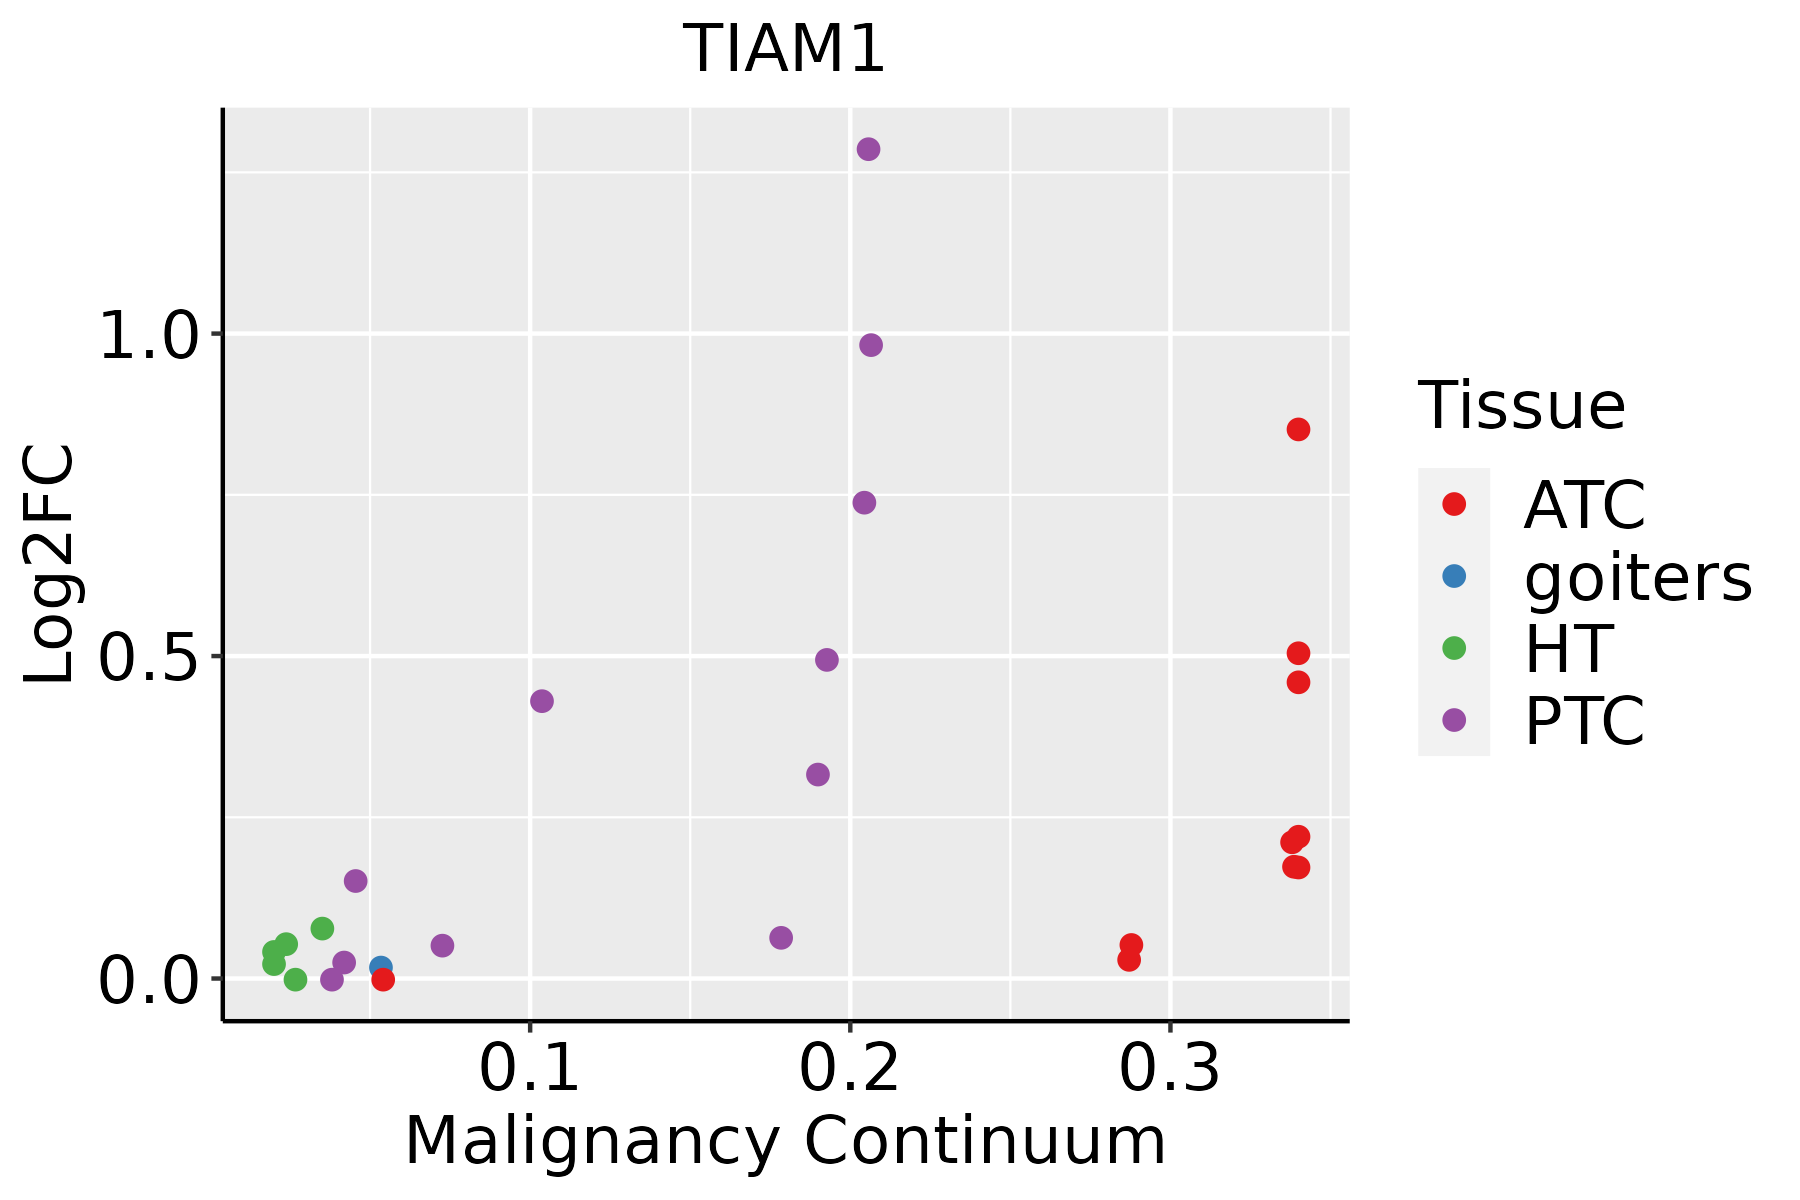 | ATC: Anaplastic thyroid cancer |
| HT: Hashimoto's thyroiditis | ||
| PTC: Papillary thyroid cancer |
| ∗log2FC in expression of this searched gene in stem-like cells from each diseased tissue sample relative to stem-like cells in normal samples in each tissue plotted against the malignancy continuum. Samples are colored based on if they are from different disease stage. |
Top |
Malignant transformation related pathway analysis |
| Find out the enriched GO biological processes and KEGG pathways involved in transition from healthy to precancer to cancer |
| Tissue | Disease Stage | Enriched GO biological Processes |
| Colorectum | AD |  |
| Colorectum | SER |  |
| Colorectum | MSS |  |
| Colorectum | MSI-H |  |
| Colorectum | FAP |  |
| ∗Top 15 enriched GO BP terms are showed in the bar plot of each disease state in each tissue. Each row represents a significant GO biological process which is colored according to the -log10(p.adjust). |
| Page: 1 2 3 4 5 6 7 8 9 |
| GO ID | Tissue | Disease Stage | Description | Gene Ratio | Bg Ratio | pvalue | p.adjust | Count |
| GO:00315898 | Cervix | CC | cell-substrate adhesion | 96/2311 | 363/18723 | 1.48e-13 | 8.85e-11 | 96 |
| GO:002260410 | Cervix | CC | regulation of cell morphogenesis | 84/2311 | 309/18723 | 1.00e-12 | 4.29e-10 | 84 |
| GO:00510566 | Cervix | CC | regulation of small GTPase mediated signal transduction | 75/2311 | 302/18723 | 1.54e-09 | 1.74e-07 | 75 |
| GO:00160557 | Cervix | CC | Wnt signaling pathway | 98/2311 | 444/18723 | 4.82e-09 | 4.65e-07 | 98 |
| GO:00321035 | Cervix | CC | positive regulation of response to external stimulus | 95/2311 | 427/18723 | 5.44e-09 | 5.03e-07 | 95 |
| GO:01987387 | Cervix | CC | cell-cell signaling by wnt | 98/2311 | 446/18723 | 6.16e-09 | 5.58e-07 | 98 |
| GO:003367410 | Cervix | CC | positive regulation of kinase activity | 101/2311 | 467/18723 | 8.66e-09 | 7.22e-07 | 101 |
| GO:00072656 | Cervix | CC | Ras protein signal transduction | 79/2311 | 337/18723 | 9.49e-09 | 7.77e-07 | 79 |
| GO:00071608 | Cervix | CC | cell-matrix adhesion | 60/2311 | 233/18723 | 1.58e-08 | 1.23e-06 | 60 |
| GO:00603267 | Cervix | CC | cell chemotaxis | 73/2311 | 310/18723 | 2.82e-08 | 1.96e-06 | 73 |
| GO:00301117 | Cervix | CC | regulation of Wnt signaling pathway | 76/2311 | 328/18723 | 3.05e-08 | 2.08e-06 | 76 |
| GO:00430877 | Cervix | CC | regulation of GTPase activity | 79/2311 | 348/18723 | 4.21e-08 | 2.60e-06 | 79 |
| GO:00458608 | Cervix | CC | positive regulation of protein kinase activity | 85/2311 | 386/18723 | 5.61e-08 | 3.29e-06 | 85 |
| GO:005109810 | Cervix | CC | regulation of binding | 80/2311 | 363/18723 | 1.32e-07 | 6.42e-06 | 80 |
| GO:00107699 | Cervix | CC | regulation of cell morphogenesis involved in differentiation | 31/2311 | 96/18723 | 2.43e-07 | 1.05e-05 | 31 |
| GO:00163587 | Cervix | CC | dendrite development | 58/2311 | 243/18723 | 4.52e-07 | 1.76e-05 | 58 |
| GO:00719007 | Cervix | CC | regulation of protein serine/threonine kinase activity | 75/2311 | 359/18723 | 2.76e-06 | 8.02e-05 | 75 |
| GO:00109757 | Cervix | CC | regulation of neuron projection development | 88/2311 | 445/18723 | 4.26e-06 | 1.09e-04 | 88 |
| GO:00107206 | Cervix | CC | positive regulation of cell development | 64/2311 | 298/18723 | 5.69e-06 | 1.41e-04 | 64 |
| GO:00509203 | Cervix | CC | regulation of chemotaxis | 51/2311 | 223/18723 | 8.03e-06 | 1.86e-04 | 51 |
| Page: 1 2 3 4 5 6 7 8 9 10 11 12 13 14 15 16 17 18 19 20 21 22 23 24 25 26 27 28 29 30 31 32 33 34 35 36 37 38 39 40 41 42 43 |
| Pathway ID | Tissue | Disease Stage | Description | Gene Ratio | Bg Ratio | pvalue | p.adjust | qvalue | Count |
| hsa0520516 | Cervix | CC | Proteoglycans in cancer | 60/1267 | 205/8465 | 9.13e-08 | 1.18e-06 | 7.00e-07 | 60 |
| hsa0481016 | Cervix | CC | Regulation of actin cytoskeleton | 64/1267 | 229/8465 | 2.24e-07 | 2.59e-06 | 1.53e-06 | 64 |
| hsa0453020 | Cervix | CC | Tight junction | 49/1267 | 169/8465 | 1.87e-06 | 1.78e-05 | 1.05e-05 | 49 |
| hsa0401512 | Cervix | CC | Rap1 signaling pathway | 56/1267 | 210/8465 | 6.23e-06 | 5.61e-05 | 3.32e-05 | 56 |
| hsa040142 | Cervix | CC | Ras signaling pathway | 51/1267 | 236/8465 | 3.55e-03 | 1.34e-02 | 7.91e-03 | 51 |
| hsa04062 | Cervix | CC | Chemokine signaling pathway | 43/1267 | 192/8465 | 3.60e-03 | 1.34e-02 | 7.91e-03 | 43 |
| hsa0520517 | Cervix | CC | Proteoglycans in cancer | 60/1267 | 205/8465 | 9.13e-08 | 1.18e-06 | 7.00e-07 | 60 |
| hsa0481017 | Cervix | CC | Regulation of actin cytoskeleton | 64/1267 | 229/8465 | 2.24e-07 | 2.59e-06 | 1.53e-06 | 64 |
| hsa04530110 | Cervix | CC | Tight junction | 49/1267 | 169/8465 | 1.87e-06 | 1.78e-05 | 1.05e-05 | 49 |
| hsa0401513 | Cervix | CC | Rap1 signaling pathway | 56/1267 | 210/8465 | 6.23e-06 | 5.61e-05 | 3.32e-05 | 56 |
| hsa0401411 | Cervix | CC | Ras signaling pathway | 51/1267 | 236/8465 | 3.55e-03 | 1.34e-02 | 7.91e-03 | 51 |
| hsa040621 | Cervix | CC | Chemokine signaling pathway | 43/1267 | 192/8465 | 3.60e-03 | 1.34e-02 | 7.91e-03 | 43 |
| hsa0453026 | Endometrium | AEH | Tight junction | 54/1197 | 169/8465 | 1.99e-09 | 3.80e-08 | 2.78e-08 | 54 |
| hsa0520518 | Endometrium | AEH | Proteoglycans in cancer | 53/1197 | 205/8465 | 5.43e-06 | 6.53e-05 | 4.78e-05 | 53 |
| hsa0401514 | Endometrium | AEH | Rap1 signaling pathway | 49/1197 | 210/8465 | 2.03e-04 | 1.78e-03 | 1.30e-03 | 49 |
| hsa0481018 | Endometrium | AEH | Regulation of actin cytoskeleton | 50/1197 | 229/8465 | 9.08e-04 | 5.78e-03 | 4.23e-03 | 50 |
| hsa04530112 | Endometrium | AEH | Tight junction | 54/1197 | 169/8465 | 1.99e-09 | 3.80e-08 | 2.78e-08 | 54 |
| hsa0520519 | Endometrium | AEH | Proteoglycans in cancer | 53/1197 | 205/8465 | 5.43e-06 | 6.53e-05 | 4.78e-05 | 53 |
| hsa0401515 | Endometrium | AEH | Rap1 signaling pathway | 49/1197 | 210/8465 | 2.03e-04 | 1.78e-03 | 1.30e-03 | 49 |
| hsa0481019 | Endometrium | AEH | Regulation of actin cytoskeleton | 50/1197 | 229/8465 | 9.08e-04 | 5.78e-03 | 4.23e-03 | 50 |
| Page: 1 2 3 |
Top |
Cell-cell communication analysis |
| Identification of potential cell-cell interactions between two cell types and their ligand-receptor pairs for different disease states |
| Ligand | Receptor | LRpair | Pathway | Tissue | Disease Stage |
| Page: 1 |
Top |
Single-cell gene regulatory network inference analysis |
| Find out the significant the regulons (TFs) and the target genes of each regulon across cell types for different disease states |
| TF | Cell Type | Tissue | Disease Stage | Target Gene | RSS | Regulon Activity |
| ∗The dot plots of a searched regulon are shown for all cell subpopulations in each disease state of each tissue based on the regulon specific score inferred using pySCENIC and by calculating the average expression. |
| Page: 1 |
Top |
Somatic mutation of malignant transformation related genes |
| Annotation of somatic variants for genes involved in malignant transformation |
| Hugo Symbol | Variant Class | Variant Classification | dbSNP RS | HGVSc | HGVSp | HGVSp Short | SWISSPROT | BIOTYPE | SIFT | PolyPhen | Tumor Sample Barcode | Tissue | Histology | Sex | Age | Stage | Therapy Types | Drugs | Outcome |
| TIAM1 | SNV | Missense_Mutation | novel | c.58A>G | p.Ser20Gly | p.S20G | Q13009 | protein_coding | tolerated_low_confidence(0.52) | benign(0) | TCGA-A2-A4RW-01 | Breast | breast invasive carcinoma | Female | <65 | III/IV | Unknown | Unknown | SD |
| TIAM1 | SNV | Missense_Mutation | c.3413N>A | p.Arg1138His | p.R1138H | Q13009 | protein_coding | tolerated(0.84) | probably_damaging(0.999) | TCGA-AN-A046-01 | Breast | breast invasive carcinoma | Female | >=65 | I/II | Unknown | Unknown | SD | |
| TIAM1 | SNV | Missense_Mutation | novel | c.175N>G | p.Ser59Gly | p.S59G | Q13009 | protein_coding | deleterious_low_confidence(0) | probably_damaging(0.97) | TCGA-AN-A046-01 | Breast | breast invasive carcinoma | Female | >=65 | I/II | Unknown | Unknown | SD |
| TIAM1 | SNV | Missense_Mutation | novel | c.845N>G | p.Pro282Arg | p.P282R | Q13009 | protein_coding | tolerated(0.39) | benign(0.024) | TCGA-GM-A3XL-01 | Breast | breast invasive carcinoma | Female | <65 | I/II | Chemotherapy | fluorouracil | CR |
| TIAM1 | SNV | Missense_Mutation | novel | c.1105N>A | p.Asp369Asn | p.D369N | Q13009 | protein_coding | tolerated(0.07) | probably_damaging(0.996) | TCGA-PE-A5DC-01 | Breast | breast invasive carcinoma | Female | >=65 | III/IV | Unknown | Unknown | SD |
| TIAM1 | insertion | Frame_Shift_Ins | novel | c.1826_1827insTTATAGGCATGAGCCACCATGCCCAGCCTATTTTCTTT | p.Gln609HisfsTer14 | p.Q609Hfs*14 | Q13009 | protein_coding | TCGA-A7-A0CG-01 | Breast | breast invasive carcinoma | Female | >=65 | I/II | Unknown | Unknown | SD | ||
| TIAM1 | insertion | Nonsense_Mutation | novel | c.2636_2637insCTGATTGAGCCCATTACCCTGGGGCTGGTG | p.Lys879delinsAsnTerLeuSerProLeuProTrpGlyTrpTrp | p.K879delinsN*LSPLPWGWW | Q13009 | protein_coding | TCGA-A8-A07U-01 | Breast | breast invasive carcinoma | Female | >=65 | III/IV | Chemotherapy | 5-fluorouracil | SD | ||
| TIAM1 | insertion | Nonsense_Mutation | novel | c.1972_1973insGGGAGAGAAGGGTAAGAAATAAGTAAACAATTAACTAGAC | p.Ser658TrpfsTer9 | p.S658Wfs*9 | Q13009 | protein_coding | TCGA-A8-A0A4-01 | Breast | breast invasive carcinoma | Female | >=65 | I/II | Hormone Therapy | tamoxiphen | CR | ||
| TIAM1 | deletion | Frame_Shift_Del | novel | c.1152delN | p.Tyr384Ter | p.Y384* | Q13009 | protein_coding | TCGA-EW-A2FV-01 | Breast | breast invasive carcinoma | Female | <65 | III/IV | Chemotherapy | docetaxel | SD | ||
| TIAM1 | SNV | Missense_Mutation | c.4355N>A | p.Arg1452Gln | p.R1452Q | Q13009 | protein_coding | deleterious(0.05) | probably_damaging(0.994) | TCGA-2W-A8YY-01 | Cervix | cervical & endocervical cancer | Female | <65 | I/II | Chemotherapy | cisplatin | CR |
| Page: 1 2 3 4 5 6 7 8 9 10 11 12 13 14 15 16 17 18 19 20 21 22 23 24 25 26 27 28 |
Top |
Related drugs of malignant transformation related genes |
| Identification of chemicals and drugs interact with genes involved in malignant transfromation |
| (DGIdb 4.0) |
| Entrez ID | Symbol | Category | Interaction Types | Drug Claim Name | Drug Name | PMIDs |
| Page: 1 |

Copyright 2023-Present -The University of Texas Health Science Center at Houston |