
|
|||||
|
 | |
| |
| |
| |
| |
| |
|
Gene: TIAL1 |
Gene summary for TIAL1 |
| Gene information | Species | Human | Gene symbol | TIAL1 | Gene ID | 7073 |
| Gene name | TIA1 cytotoxic granule associated RNA binding protein like 1 | |
| Gene Alias | TCBP | |
| Cytomap | 10q26.11 | |
| Gene Type | protein-coding | GO ID | GO:0000003 | UniProtAcc | Q01085 |
Top |
Malignant transformation analysis |
| Identification of the aberrant gene expression in precancerous and cancerous lesions by comparing the gene expression of stem-like cells in diseased tissues with normal stem cells |
| Entrez ID | Symbol | Replicates | Species | Organ | Tissue | Adj P-value | Log2FC | Malignancy |
| 7073 | TIAL1 | LZE4T | Human | Esophagus | ESCC | 8.26e-11 | 3.71e-01 | 0.0811 |
| 7073 | TIAL1 | LZE5T | Human | Esophagus | ESCC | 4.34e-02 | 1.89e-01 | 0.0514 |
| 7073 | TIAL1 | LZE7T | Human | Esophagus | ESCC | 8.14e-06 | 2.47e-01 | 0.0667 |
| 7073 | TIAL1 | LZE8T | Human | Esophagus | ESCC | 2.09e-11 | 3.26e-01 | 0.067 |
| 7073 | TIAL1 | LZE20T | Human | Esophagus | ESCC | 8.59e-10 | 1.00e-01 | 0.0662 |
| 7073 | TIAL1 | LZE22T | Human | Esophagus | ESCC | 1.12e-06 | 4.44e-01 | 0.068 |
| 7073 | TIAL1 | LZE24T | Human | Esophagus | ESCC | 4.01e-23 | 8.66e-01 | 0.0596 |
| 7073 | TIAL1 | LZE21T | Human | Esophagus | ESCC | 4.65e-03 | 1.36e-01 | 0.0655 |
| 7073 | TIAL1 | LZE6T | Human | Esophagus | ESCC | 4.43e-03 | 3.68e-01 | 0.0845 |
| 7073 | TIAL1 | P1T-E | Human | Esophagus | ESCC | 4.97e-12 | 5.02e-01 | 0.0875 |
| 7073 | TIAL1 | P2T-E | Human | Esophagus | ESCC | 2.88e-51 | 1.03e+00 | 0.1177 |
| 7073 | TIAL1 | P4T-E | Human | Esophagus | ESCC | 2.47e-24 | 8.10e-01 | 0.1323 |
| 7073 | TIAL1 | P5T-E | Human | Esophagus | ESCC | 1.66e-22 | 6.88e-01 | 0.1327 |
| 7073 | TIAL1 | P8T-E | Human | Esophagus | ESCC | 9.43e-21 | 5.18e-01 | 0.0889 |
| 7073 | TIAL1 | P9T-E | Human | Esophagus | ESCC | 1.47e-13 | 2.59e-01 | 0.1131 |
| 7073 | TIAL1 | P10T-E | Human | Esophagus | ESCC | 1.91e-17 | 2.73e-01 | 0.116 |
| 7073 | TIAL1 | P11T-E | Human | Esophagus | ESCC | 1.20e-19 | 7.58e-01 | 0.1426 |
| 7073 | TIAL1 | P12T-E | Human | Esophagus | ESCC | 1.55e-34 | 7.59e-01 | 0.1122 |
| 7073 | TIAL1 | P15T-E | Human | Esophagus | ESCC | 1.67e-34 | 8.69e-01 | 0.1149 |
| 7073 | TIAL1 | P16T-E | Human | Esophagus | ESCC | 4.73e-36 | 8.67e-01 | 0.1153 |
| Page: 1 2 3 4 5 6 |
| Tissue | Expression Dynamics | Abbreviation |
| Esophagus | 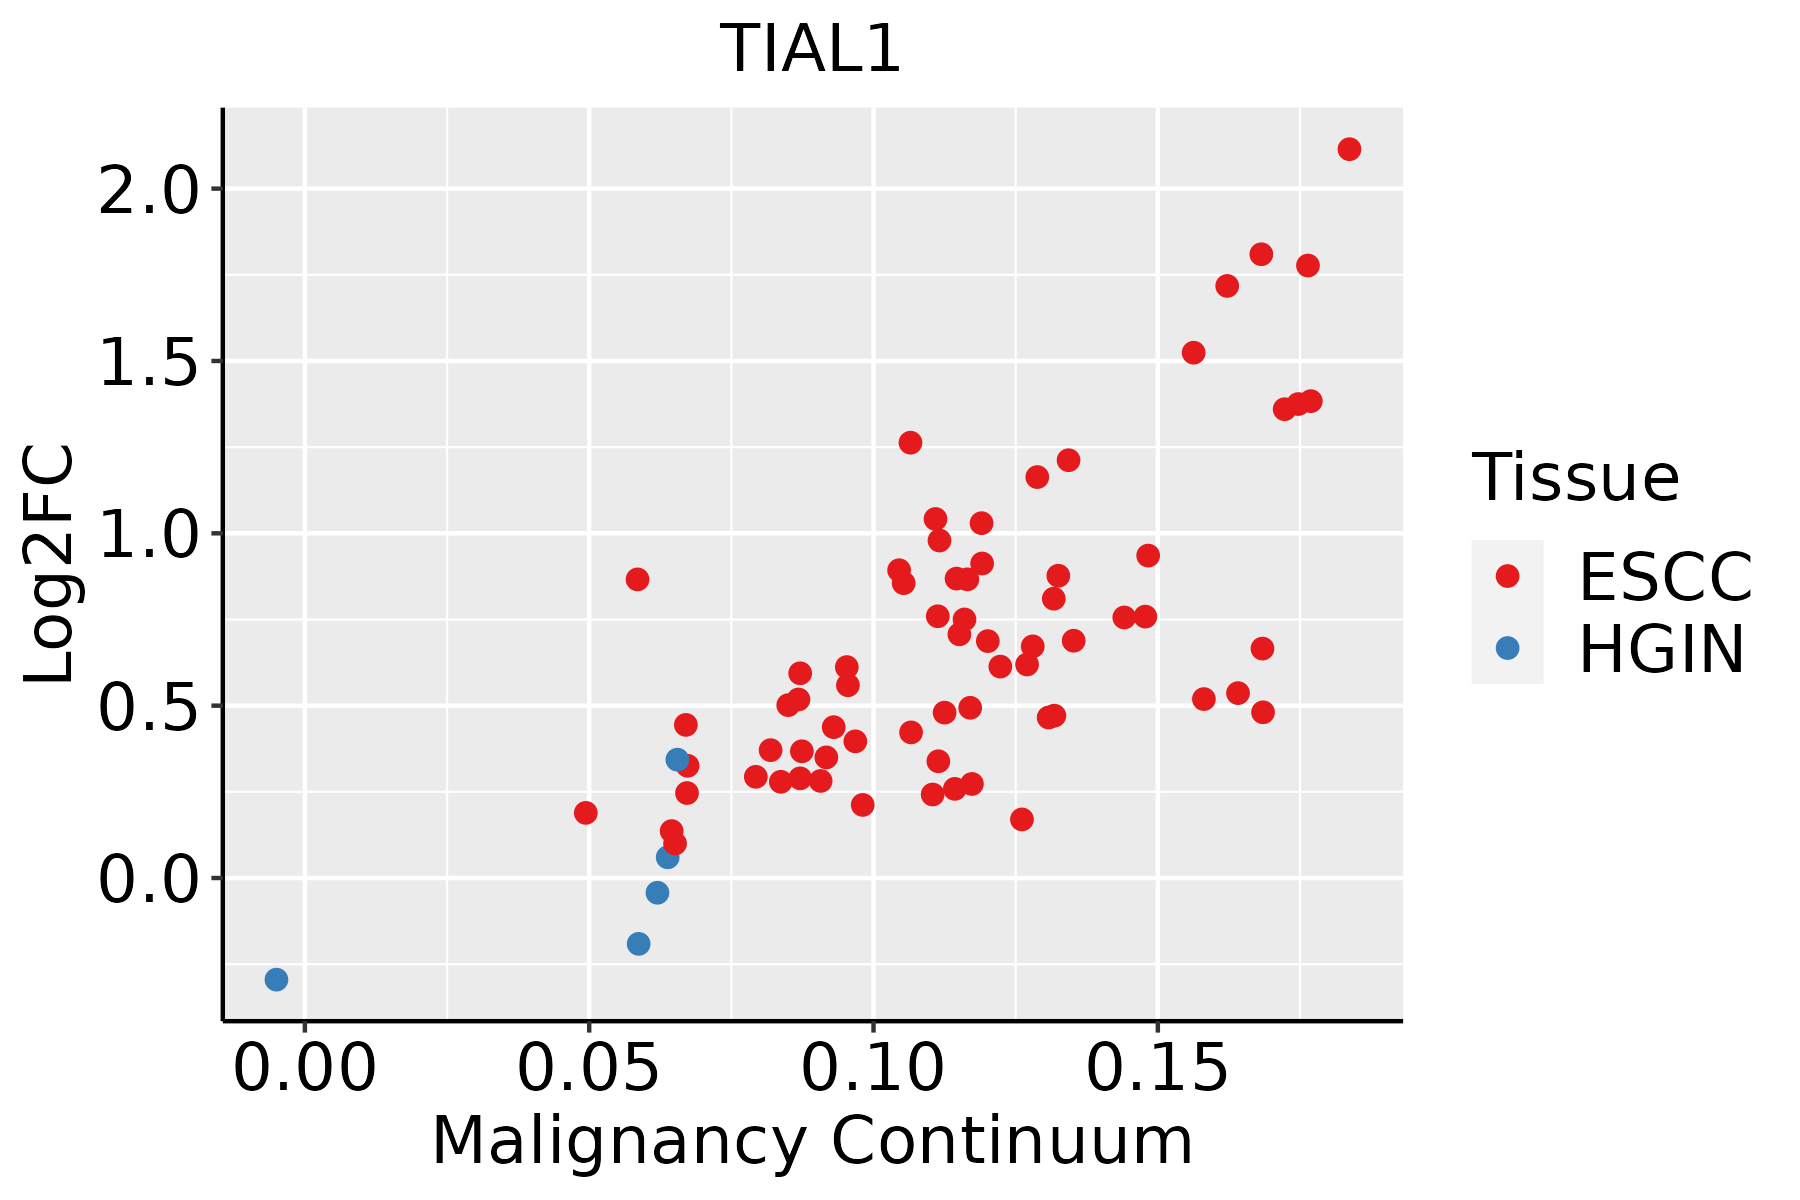 | ESCC: Esophageal squamous cell carcinoma |
| HGIN: High-grade intraepithelial neoplasias | ||
| LGIN: Low-grade intraepithelial neoplasias | ||
| Liver | 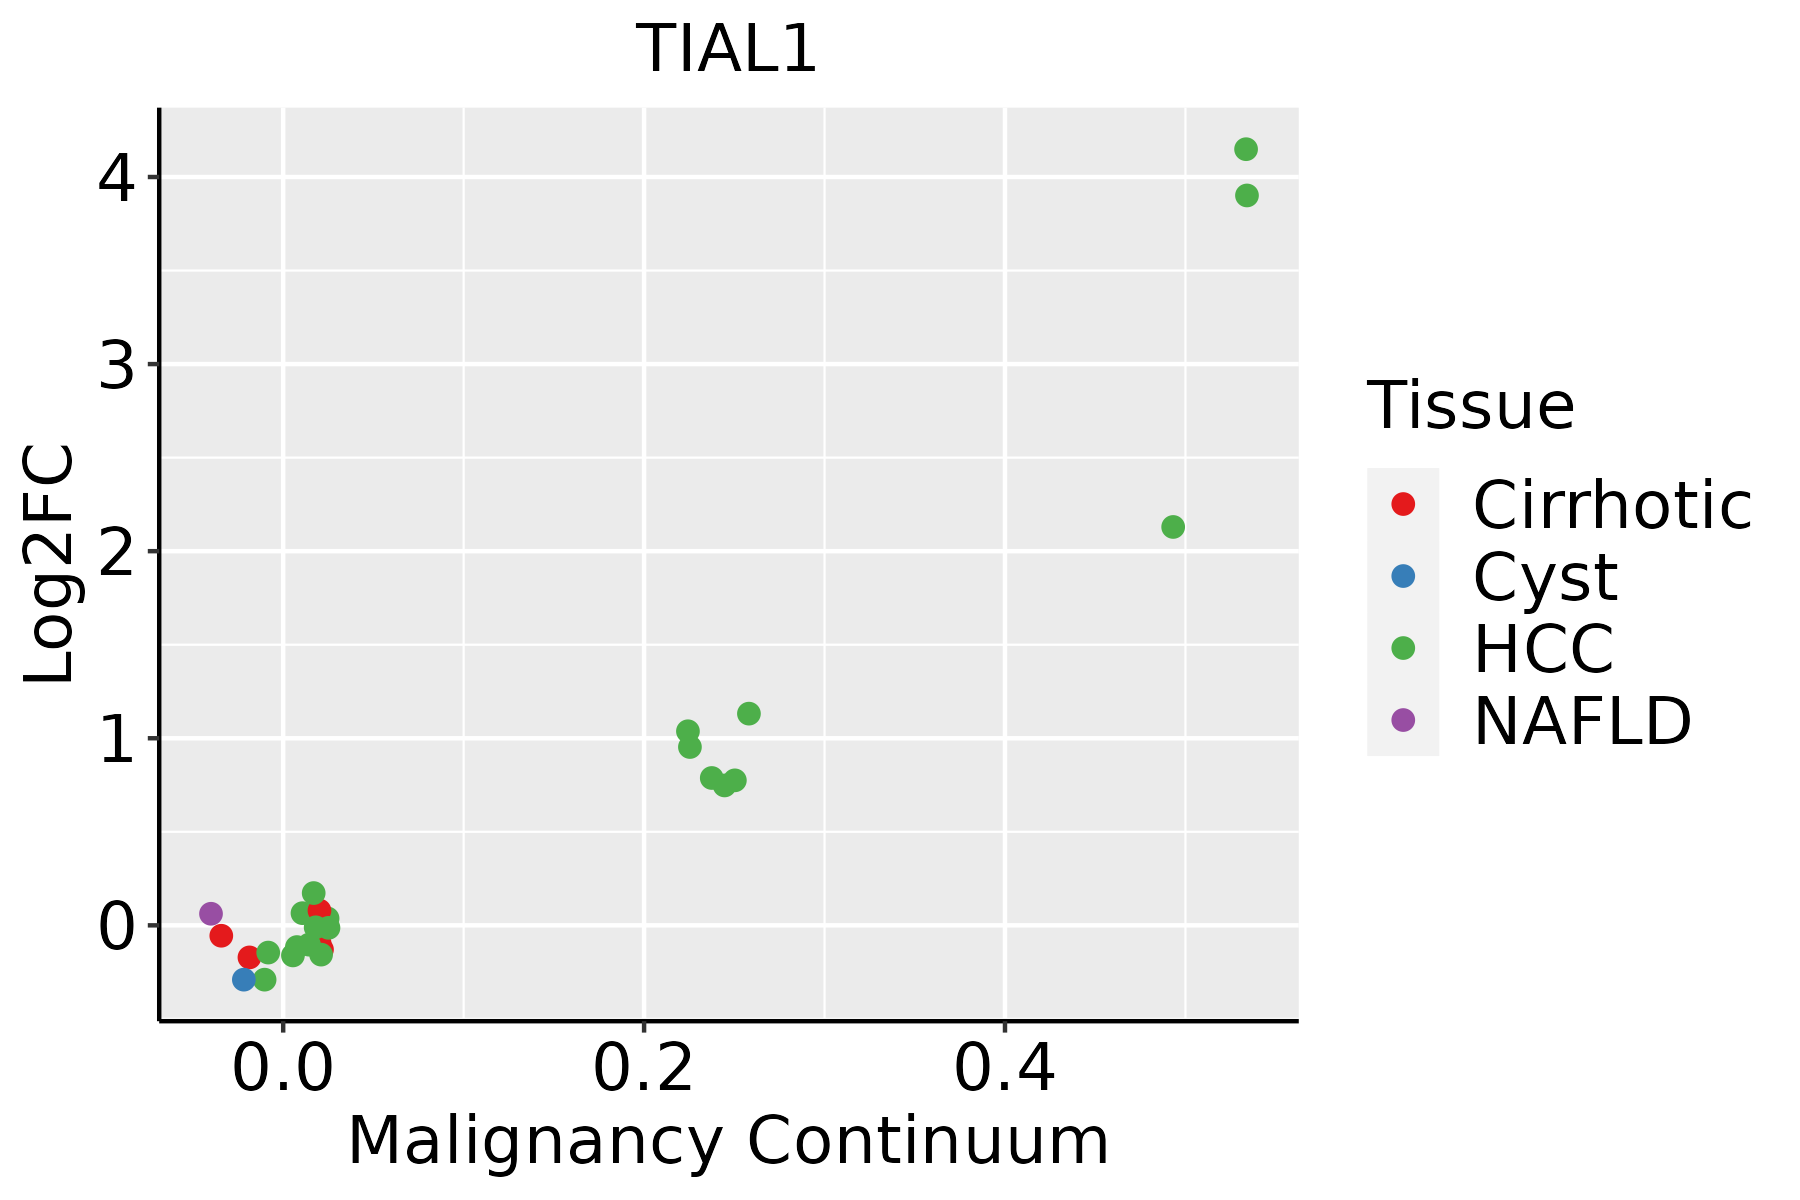 | HCC: Hepatocellular carcinoma |
| NAFLD: Non-alcoholic fatty liver disease | ||
| Oral Cavity | 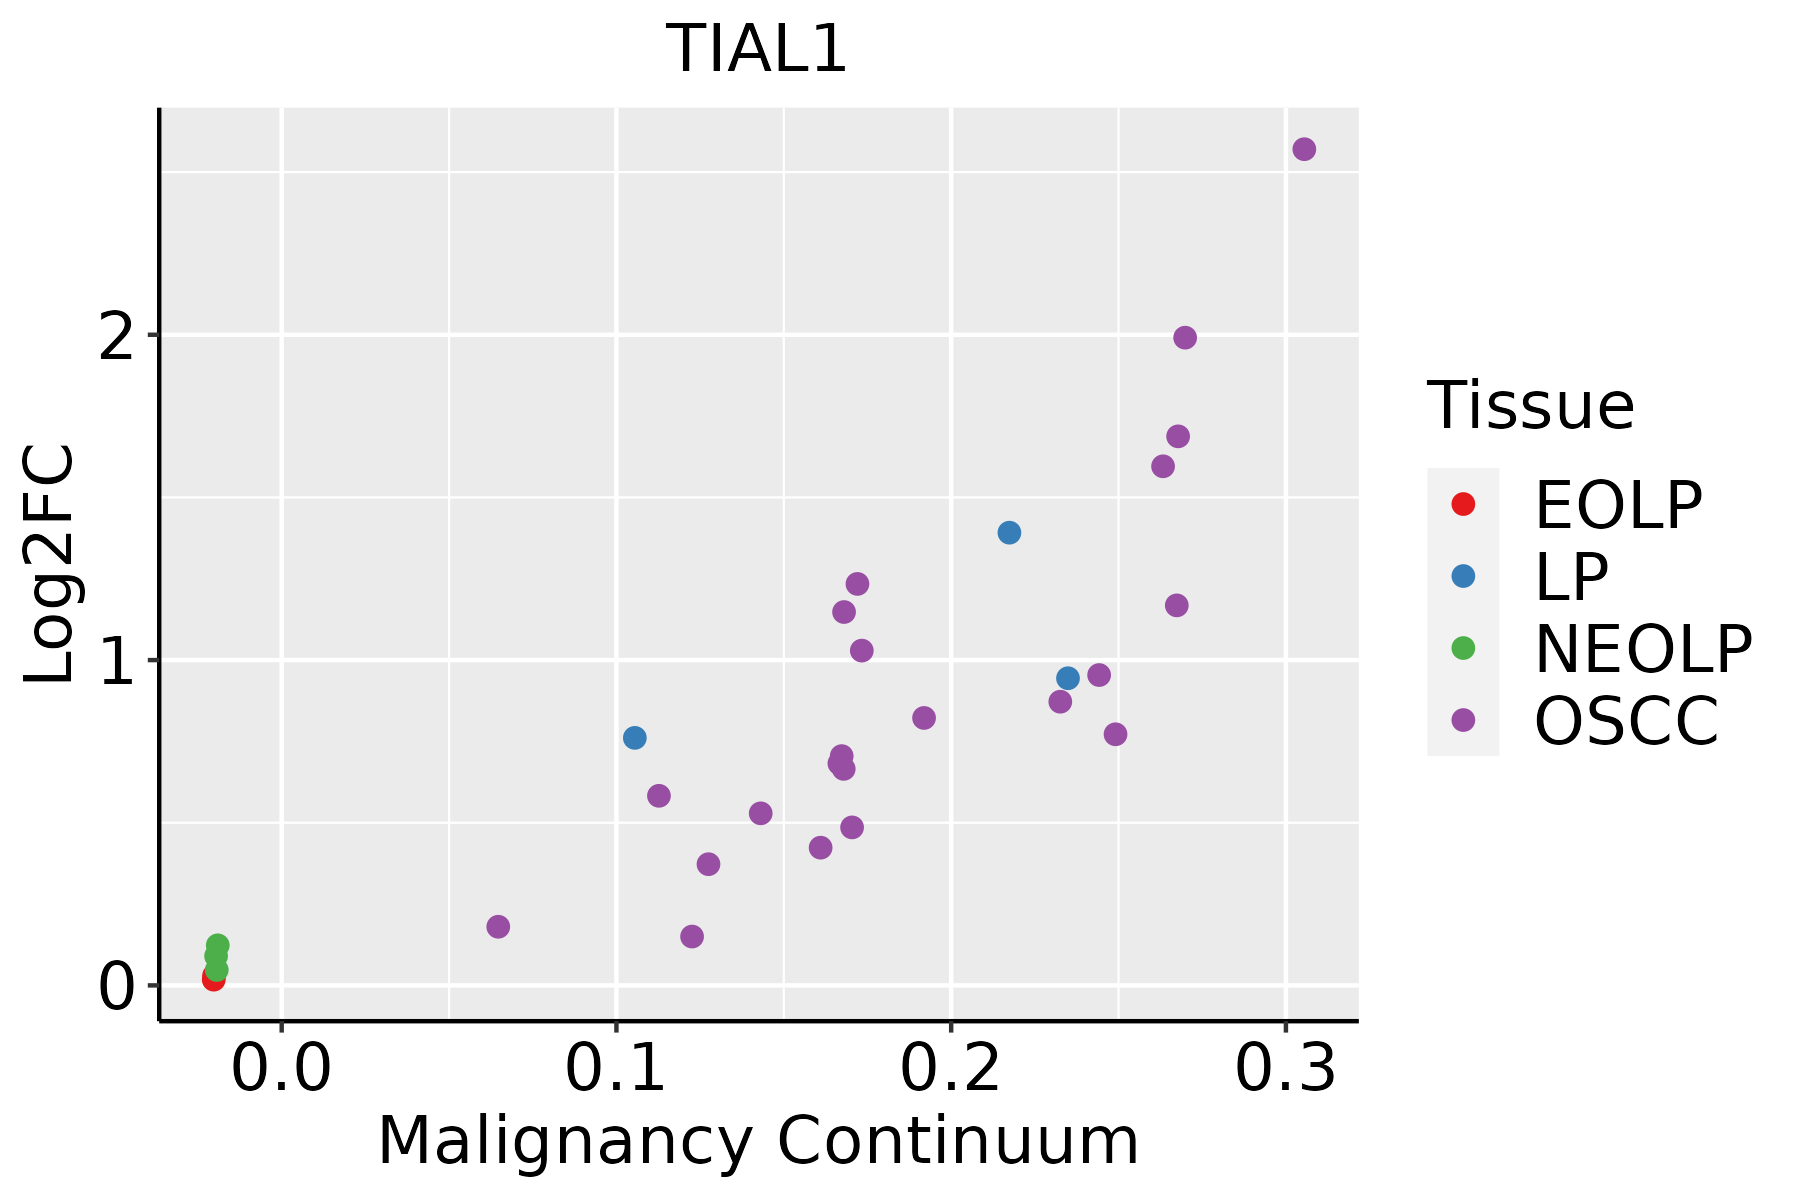 | EOLP: Erosive Oral lichen planus |
| LP: leukoplakia | ||
| NEOLP: Non-erosive oral lichen planus | ||
| OSCC: Oral squamous cell carcinoma | ||
| Skin | 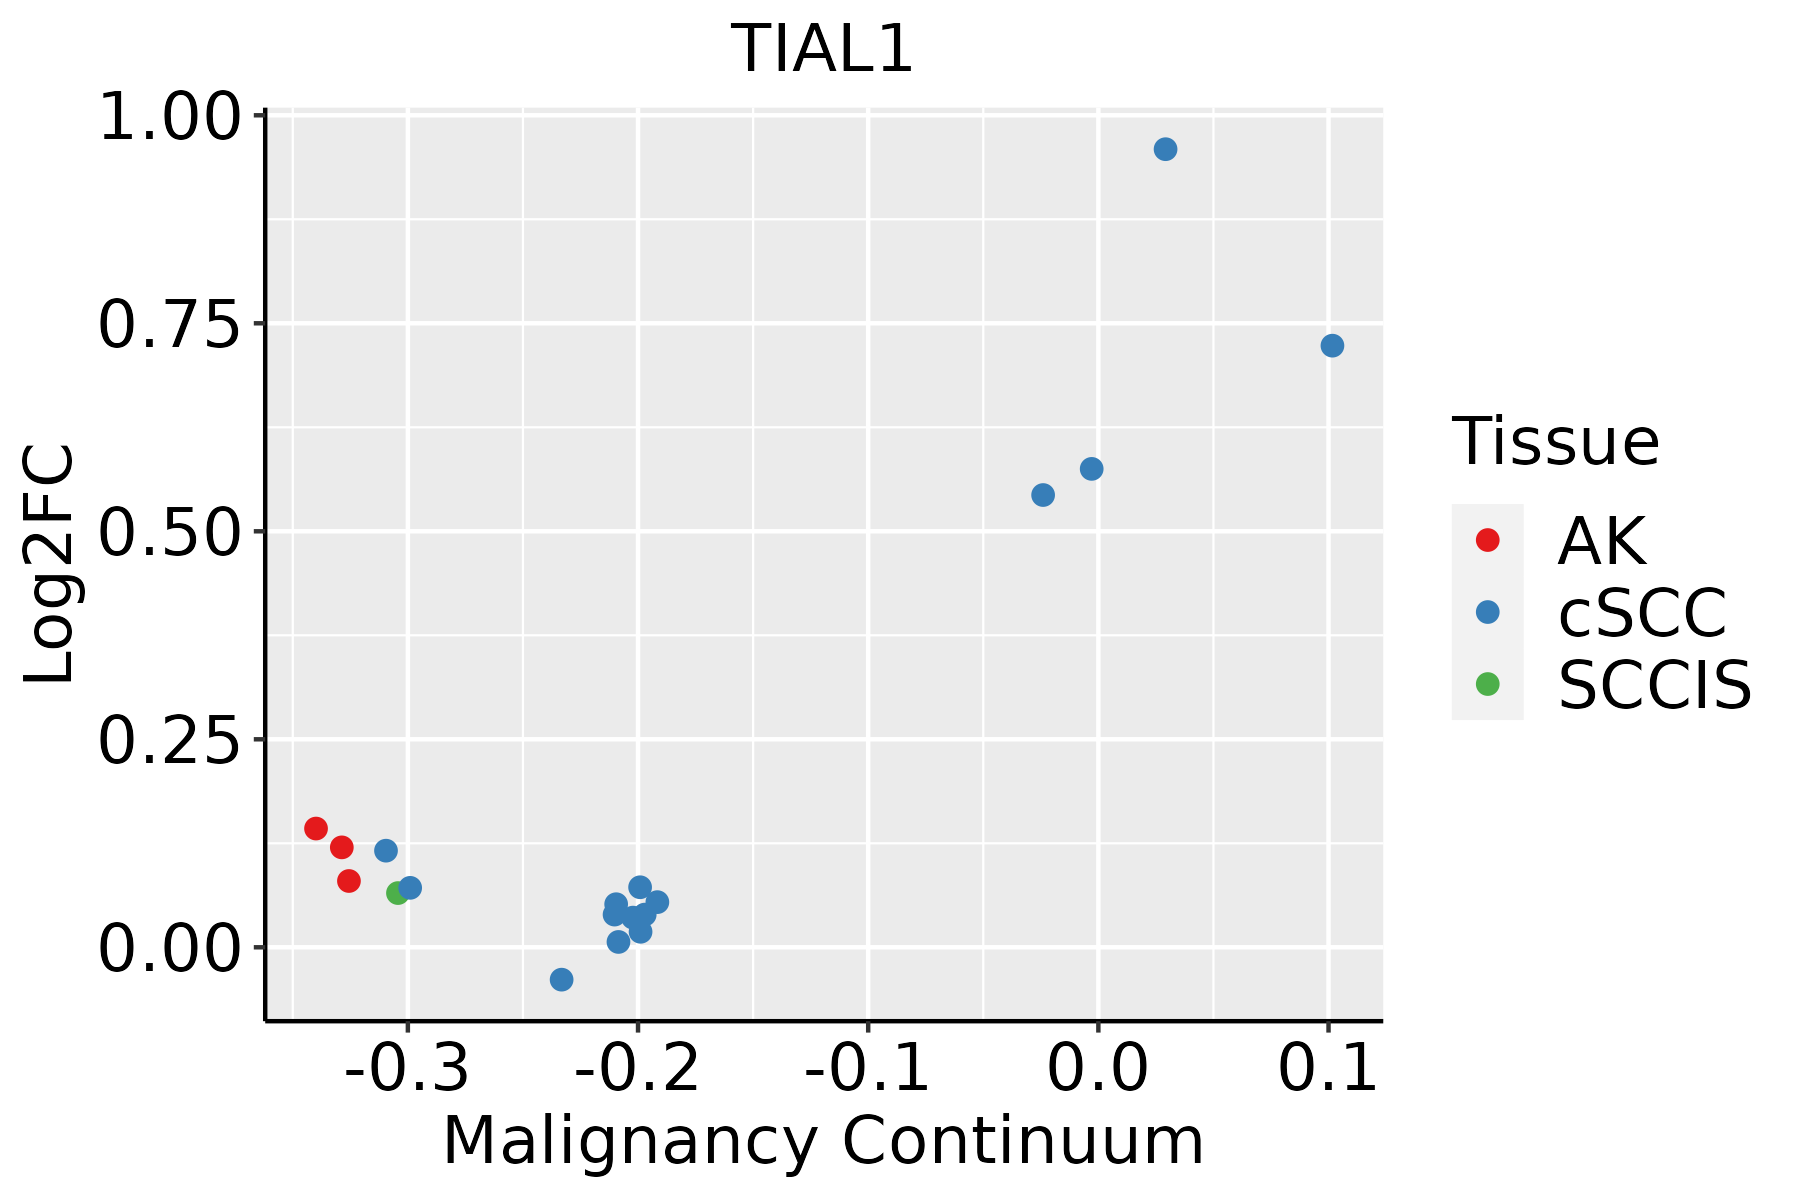 | AK: Actinic keratosis |
| cSCC: Cutaneous squamous cell carcinoma | ||
| SCCIS:squamous cell carcinoma in situ | ||
| Thyroid |  | ATC: Anaplastic thyroid cancer |
| HT: Hashimoto's thyroiditis | ||
| PTC: Papillary thyroid cancer |
| ∗log2FC in expression of this searched gene in stem-like cells from each diseased tissue sample relative to stem-like cells in normal samples in each tissue plotted against the malignancy continuum. Samples are colored based on if they are from different disease stage. |
Top |
Malignant transformation related pathway analysis |
| Find out the enriched GO biological processes and KEGG pathways involved in transition from healthy to precancer to cancer |
| Tissue | Disease Stage | Enriched GO biological Processes |
| Colorectum | AD |  |
| Colorectum | SER |  |
| Colorectum | MSS |  |
| Colorectum | MSI-H |  |
| Colorectum | FAP |  |
| ∗Top 15 enriched GO BP terms are showed in the bar plot of each disease state in each tissue. Each row represents a significant GO biological process which is colored according to the -log10(p.adjust). |
| Page: 1 2 3 4 5 6 7 8 9 |
| GO ID | Tissue | Disease Stage | Description | Gene Ratio | Bg Ratio | pvalue | p.adjust | Count |
| GO:00601487 | Esophagus | ESCC | positive regulation of posttranscriptional gene silencing | 24/8552 | 31/18723 | 3.19e-04 | 1.89e-03 | 24 |
| GO:00609667 | Esophagus | ESCC | regulation of gene silencing by RNA | 37/8552 | 53/18723 | 3.25e-04 | 1.92e-03 | 37 |
| GO:00601479 | Esophagus | ESCC | regulation of posttranscriptional gene silencing | 36/8552 | 52/18723 | 5.05e-04 | 2.79e-03 | 36 |
| GO:20006377 | Esophagus | ESCC | positive regulation of gene silencing by miRNA | 23/8552 | 30/18723 | 5.47e-04 | 3.00e-03 | 23 |
| GO:006096410 | Esophagus | ESCC | regulation of gene silencing by miRNA | 34/8552 | 49/18723 | 6.74e-04 | 3.56e-03 | 34 |
| GO:00609686 | Esophagus | ESCC | regulation of gene silencing | 48/8552 | 81/18723 | 9.54e-03 | 3.30e-02 | 48 |
| GO:00353297 | Esophagus | ESCC | hippo signaling | 26/8552 | 40/18723 | 1.08e-02 | 3.66e-02 | 26 |
| GO:200063711 | Liver | Cirrhotic | positive regulation of gene silencing by miRNA | 18/4634 | 30/18723 | 4.27e-05 | 5.03e-04 | 18 |
| GO:00609645 | Liver | Cirrhotic | regulation of gene silencing by miRNA | 25/4634 | 49/18723 | 6.57e-05 | 7.47e-04 | 25 |
| GO:006014711 | Liver | Cirrhotic | regulation of posttranscriptional gene silencing | 26/4634 | 52/18723 | 7.35e-05 | 8.23e-04 | 26 |
| GO:006014811 | Liver | Cirrhotic | positive regulation of posttranscriptional gene silencing | 18/4634 | 31/18723 | 7.83e-05 | 8.61e-04 | 18 |
| GO:006096611 | Liver | Cirrhotic | regulation of gene silencing by RNA | 26/4634 | 53/18723 | 1.11e-04 | 1.12e-03 | 26 |
| GO:00609681 | Liver | Cirrhotic | regulation of gene silencing | 31/4634 | 81/18723 | 4.76e-03 | 2.50e-02 | 31 |
| GO:00601482 | Liver | HCC | positive regulation of posttranscriptional gene silencing | 23/7958 | 31/18723 | 3.47e-04 | 2.42e-03 | 23 |
| GO:006096621 | Liver | HCC | regulation of gene silencing by RNA | 35/7958 | 53/18723 | 4.59e-04 | 3.04e-03 | 35 |
| GO:200063721 | Liver | HCC | positive regulation of gene silencing by miRNA | 22/7958 | 30/18723 | 6.14e-04 | 3.82e-03 | 22 |
| GO:006014721 | Liver | HCC | regulation of posttranscriptional gene silencing | 34/7958 | 52/18723 | 7.24e-04 | 4.42e-03 | 34 |
| GO:006096411 | Liver | HCC | regulation of gene silencing by miRNA | 31/7958 | 49/18723 | 2.70e-03 | 1.29e-02 | 31 |
| GO:20006376 | Oral cavity | OSCC | positive regulation of gene silencing by miRNA | 21/7305 | 30/18723 | 5.75e-04 | 3.30e-03 | 21 |
| GO:00601486 | Oral cavity | OSCC | positive regulation of posttranscriptional gene silencing | 21/7305 | 31/18723 | 1.13e-03 | 5.75e-03 | 21 |
| Page: 1 2 3 |
| Pathway ID | Tissue | Disease Stage | Description | Gene Ratio | Bg Ratio | pvalue | p.adjust | qvalue | Count |
| Page: 1 |
Top |
Cell-cell communication analysis |
| Identification of potential cell-cell interactions between two cell types and their ligand-receptor pairs for different disease states |
| Ligand | Receptor | LRpair | Pathway | Tissue | Disease Stage |
| Page: 1 |
Top |
Single-cell gene regulatory network inference analysis |
| Find out the significant the regulons (TFs) and the target genes of each regulon across cell types for different disease states |
| TF | Cell Type | Tissue | Disease Stage | Target Gene | RSS | Regulon Activity |
| ∗The dot plots of a searched regulon are shown for all cell subpopulations in each disease state of each tissue based on the regulon specific score inferred using pySCENIC and by calculating the average expression. |
| Page: 1 |
Top |
Somatic mutation of malignant transformation related genes |
| Annotation of somatic variants for genes involved in malignant transformation |
| Hugo Symbol | Variant Class | Variant Classification | dbSNP RS | HGVSc | HGVSp | HGVSp Short | SWISSPROT | BIOTYPE | SIFT | PolyPhen | Tumor Sample Barcode | Tissue | Histology | Sex | Age | Stage | Therapy Types | Drugs | Outcome |
| TIAL1 | SNV | Missense_Mutation | c.136N>A | p.Asp46Asn | p.D46N | Q01085 | protein_coding | tolerated(0.16) | probably_damaging(0.948) | TCGA-AN-A046-01 | Breast | breast invasive carcinoma | Female | >=65 | I/II | Unknown | Unknown | SD | |
| TIAL1 | SNV | Missense_Mutation | c.746T>G | p.Met249Arg | p.M249R | Q01085 | protein_coding | tolerated(0.05) | benign(0.044) | TCGA-BH-A1F8-01 | Breast | breast invasive carcinoma | Female | >=65 | III/IV | Unknown | Unknown | PD | |
| TIAL1 | SNV | Missense_Mutation | c.91N>G | p.Gln31Glu | p.Q31E | Q01085 | protein_coding | deleterious(0.03) | possibly_damaging(0.8) | TCGA-EW-A1PD-01 | Breast | breast invasive carcinoma | Male | <65 | I/II | Chemotherapy | docetaxel | SD | |
| TIAL1 | SNV | Missense_Mutation | rs866256086 | c.1001C>T | p.Pro334Leu | p.P334L | Q01085 | protein_coding | deleterious(0) | probably_damaging(0.999) | TCGA-2W-A8YY-01 | Cervix | cervical & endocervical cancer | Female | <65 | I/II | Chemotherapy | cisplatin | CR |
| TIAL1 | SNV | Missense_Mutation | c.227N>C | p.Arg76Thr | p.R76T | Q01085 | protein_coding | tolerated(0.25) | benign(0.015) | TCGA-IR-A3LK-01 | Cervix | cervical & endocervical cancer | Female | >=65 | I/II | Chemotherapy | cisplatin | PD | |
| TIAL1 | SNV | Missense_Mutation | novel | c.1069N>T | p.Ala357Ser | p.A357S | Q01085 | protein_coding | tolerated(0.08) | benign(0.114) | TCGA-VS-A950-01 | Cervix | cervical & endocervical cancer | Female | <65 | III/IV | Unknown | Unknown | SD |
| TIAL1 | SNV | Missense_Mutation | novel | c.755N>C | p.Arg252Thr | p.R252T | Q01085 | protein_coding | deleterious(0) | probably_damaging(0.98) | TCGA-ZJ-AAXU-01 | Cervix | cervical & endocervical cancer | Female | <65 | I/II | Unknown | Unknown | SD |
| TIAL1 | SNV | Missense_Mutation | c.298N>A | p.Ala100Thr | p.A100T | Q01085 | protein_coding | deleterious(0) | possibly_damaging(0.642) | TCGA-AA-3715-01 | Colorectum | colon adenocarcinoma | Male | >=65 | I/II | Unknown | Unknown | PD | |
| TIAL1 | SNV | Missense_Mutation | c.448N>A | p.Ala150Thr | p.A150T | Q01085 | protein_coding | tolerated(0.54) | benign(0.003) | TCGA-AA-3864-01 | Colorectum | colon adenocarcinoma | Male | >=65 | I/II | Unknown | Unknown | SD | |
| TIAL1 | SNV | Missense_Mutation | c.629N>C | p.Phe210Ser | p.F210S | Q01085 | protein_coding | tolerated(0.2) | possibly_damaging(0.519) | TCGA-AZ-6599-01 | Colorectum | colon adenocarcinoma | Male | >=65 | I/II | Unknown | Unknown | SD |
| Page: 1 2 3 4 5 6 |
Top |
Related drugs of malignant transformation related genes |
| Identification of chemicals and drugs interact with genes involved in malignant transfromation |
| (DGIdb 4.0) |
| Entrez ID | Symbol | Category | Interaction Types | Drug Claim Name | Drug Name | PMIDs |
| Page: 1 |

Copyright 2023-Present -The University of Texas Health Science Center at Houston |