Schematic overview of the cellular and molecular mechanisms involved in the cancer progression, including the proposed cellular and molecular mechanisms in cancer cells trajectory. AT1: alveolar type 1 cells; AT2: alveolar type 2 cells; AAH: atypical adenomatous hyperplasia; AIS: adenocarcinoma in situ; MIA: minimally invasive adenocarcinoma; IA: invasive adenocarcinoma; EMT: epithelial-mesenchymal transition

Home

Download

Statistics

Help

Contact

Center for Computational Systems Medicine
leaf

Gene summary

leaf

Malignant transformation analysis

leaf

Malignant transformation related pathway analysis

leaf

Cell-cell communication analysis

leaf

Single-cell gene regulatory network inference analysis

leaf

Somatic mutation of malignant transformation related genes

leaf

Related drugs of malignant transformation related genes

Gene: TIA1

Gene summary for TIA1

check button Gene summary.

Gene informationSpeciesHuman
Gene symbol

TIA1

Gene ID

7072

Gene nameTIA1 cytotoxic granule associated RNA binding protein
Gene AliasALS26
Cytomap2p13.3
Gene Typeprotein-coding
GO ID

GO:0000375

UniProtAcc

P31483


Top

Malignant transformation analysis

check button Identification of the aberrant gene expression in precancerous and cancerous lesions by comparing the gene expression of stem-like cells in diseased tissues with normal stem cells
check button Malignant transformation involving gene list.
Entrez IDSymbolReplicatesSpeciesOrganTissueAdj P-valueLog2FCMalignancy
7072TIA1HTA11_3410_2000001011HumanColorectumAD2.84e-041.21e-010.0155
7072TIA1HTA11_2487_2000001011HumanColorectumSER2.03e-062.22e-01-0.1808
7072TIA1HTA11_2951_2000001011HumanColorectumAD3.40e-021.90e-010.0216
7072TIA1HTA11_1938_2000001011HumanColorectumAD3.41e-164.68e-01-0.0811
7072TIA1HTA11_78_2000001011HumanColorectumAD8.17e-123.03e-01-0.1088
7072TIA1HTA11_347_2000001011HumanColorectumAD6.17e-173.14e-01-0.1954
7072TIA1HTA11_83_2000001011HumanColorectumSER8.73e-041.75e-01-0.1526
7072TIA1HTA11_866_2000001011HumanColorectumAD3.77e-021.25e-01-0.1001
7072TIA1HTA11_1391_2000001011HumanColorectumAD6.96e-052.11e-01-0.059
7072TIA1HTA11_866_3004761011HumanColorectumAD3.01e-092.09e-010.096
7072TIA1HTA11_10623_2000001011HumanColorectumAD1.36e-032.23e-01-0.0177
7072TIA1HTA11_6801_2000001011HumanColorectumSER2.21e-022.67e-010.0171
7072TIA1HTA11_7696_3000711011HumanColorectumAD8.55e-041.60e-010.0674
7072TIA1HTA11_6818_2000001021HumanColorectumAD2.64e-031.43e-010.0588
7072TIA1HTA11_99999970781_79442HumanColorectumMSS4.40e-387.54e-010.294
7072TIA1HTA11_99999965062_69753HumanColorectumMSI-H3.42e-043.76e-010.3487
7072TIA1HTA11_99999965104_69814HumanColorectumMSS1.31e-255.87e-010.281
7072TIA1HTA11_99999971662_82457HumanColorectumMSS2.83e-143.57e-010.3859
7072TIA1HTA11_99999973899_84307HumanColorectumMSS2.92e-031.82e-010.2585
7072TIA1HTA11_99999974143_84620HumanColorectumMSS2.09e-082.30e-010.3005
Page: 1 2 3 4 5 6 7 8 

check button Transcriptomic changes along malignancy continuum.
TissueExpression DynamicsAbbreviation
Colorectum (GSE201348)The image shows the transcriptomic changes along malignancy continuum.log2FC in expression of this searched gene in stem-like cells from each diseased tissue sample relative to stem-like cells in normal samples in each tissue plotted against the malignancy continuum. Samples are colored based on if they are from different disease stage.
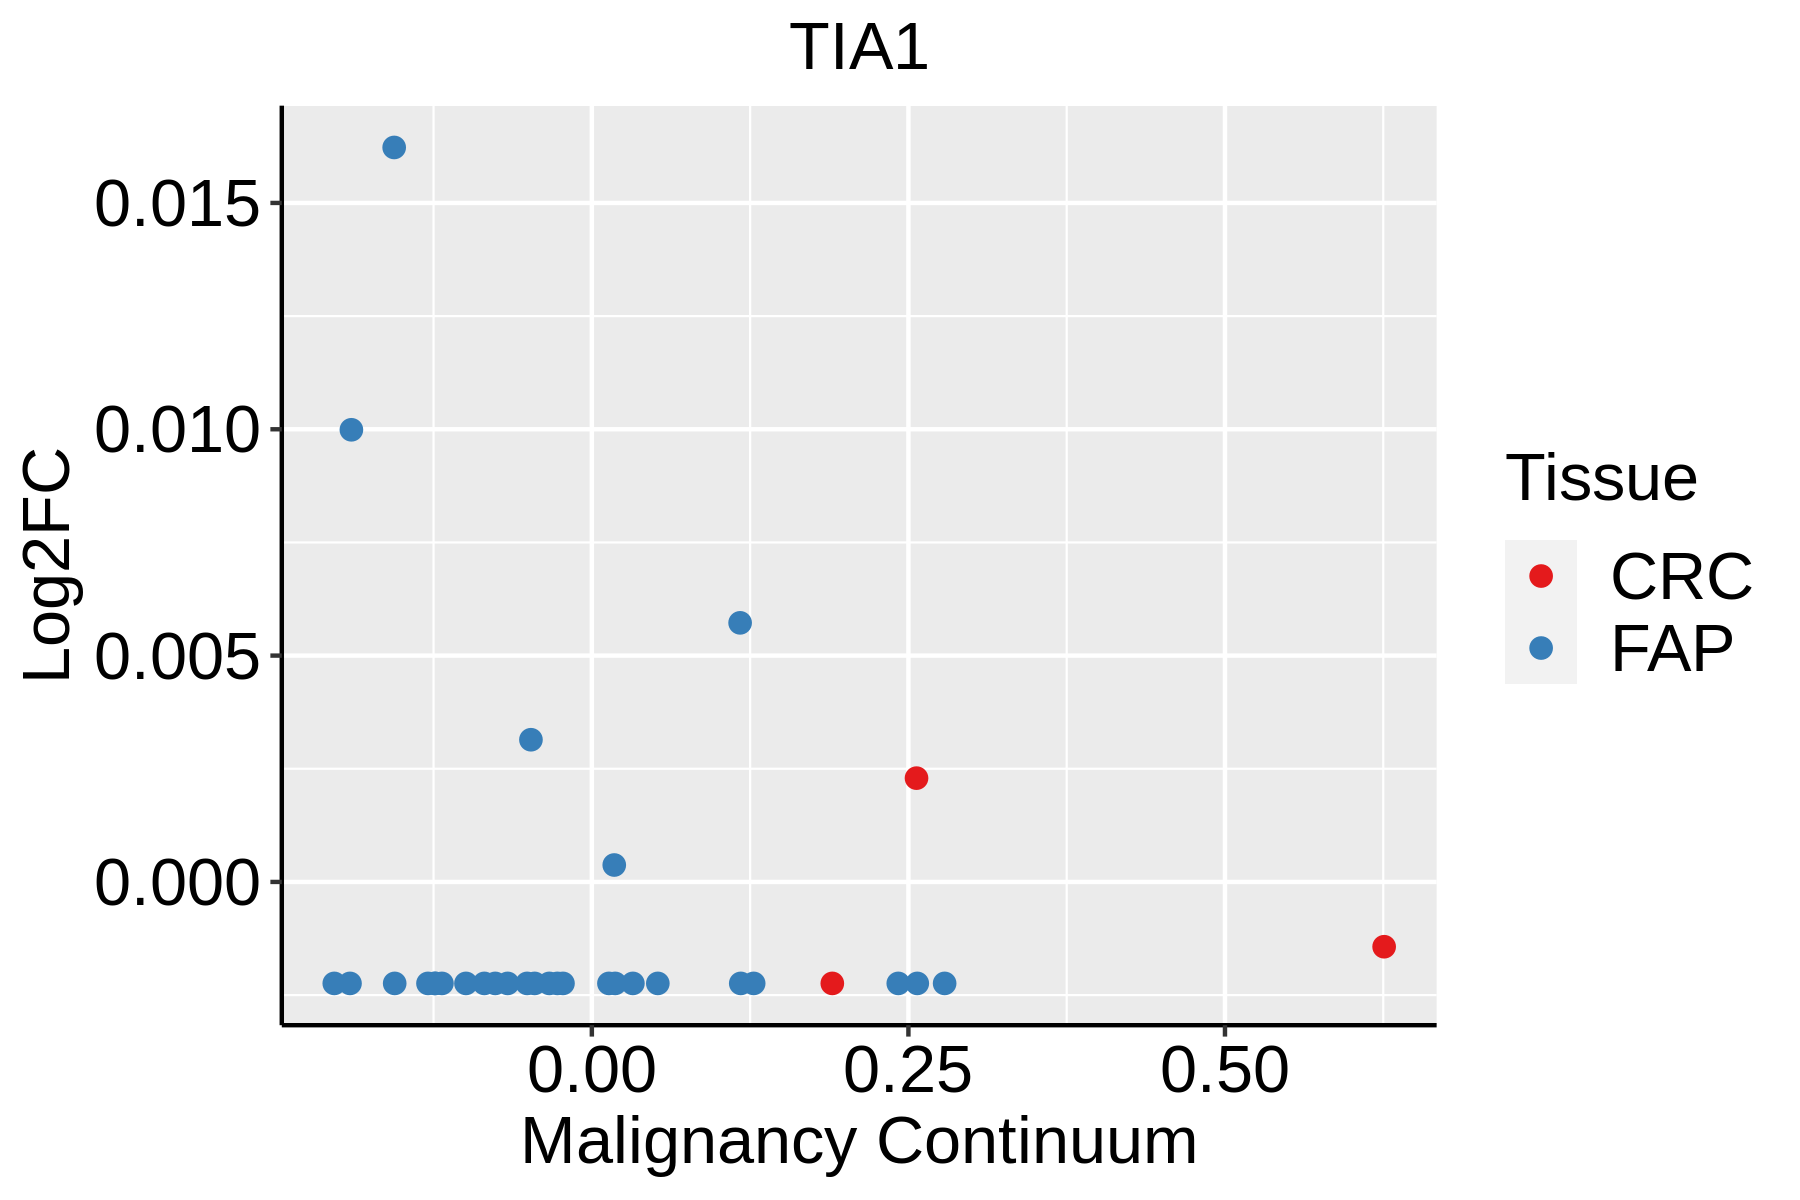
FAP: Familial adenomatous polyposis
CRC: Colorectal cancer
Colorectum (HTA11)The image shows the transcriptomic changes along malignancy continuum.log2FC in expression of this searched gene in stem-like cells from each diseased tissue sample relative to stem-like cells in normal samples in each tissue plotted against the malignancy continuum. Samples are colored based on if they are from different disease stage.AD: Adenomas
SER: Sessile serrated lesions
MSI-H: Microsatellite-high colorectal cancer
MSS: Microsatellite stable colorectal cancer
EsophagusThe image shows the transcriptomic changes along malignancy continuum.log2FC in expression of this searched gene in stem-like cells from each diseased tissue sample relative to stem-like cells in normal samples in each tissue plotted against the malignancy continuum. Samples are colored based on if they are from different disease stage.ESCC: Esophageal squamous cell carcinoma
HGIN: High-grade intraepithelial neoplasias
LGIN: Low-grade intraepithelial neoplasias
LiverThe image shows the transcriptomic changes along malignancy continuum.log2FC in expression of this searched gene in stem-like cells from each diseased tissue sample relative to stem-like cells in normal samples in each tissue plotted against the malignancy continuum. Samples are colored based on if they are from different disease stage.
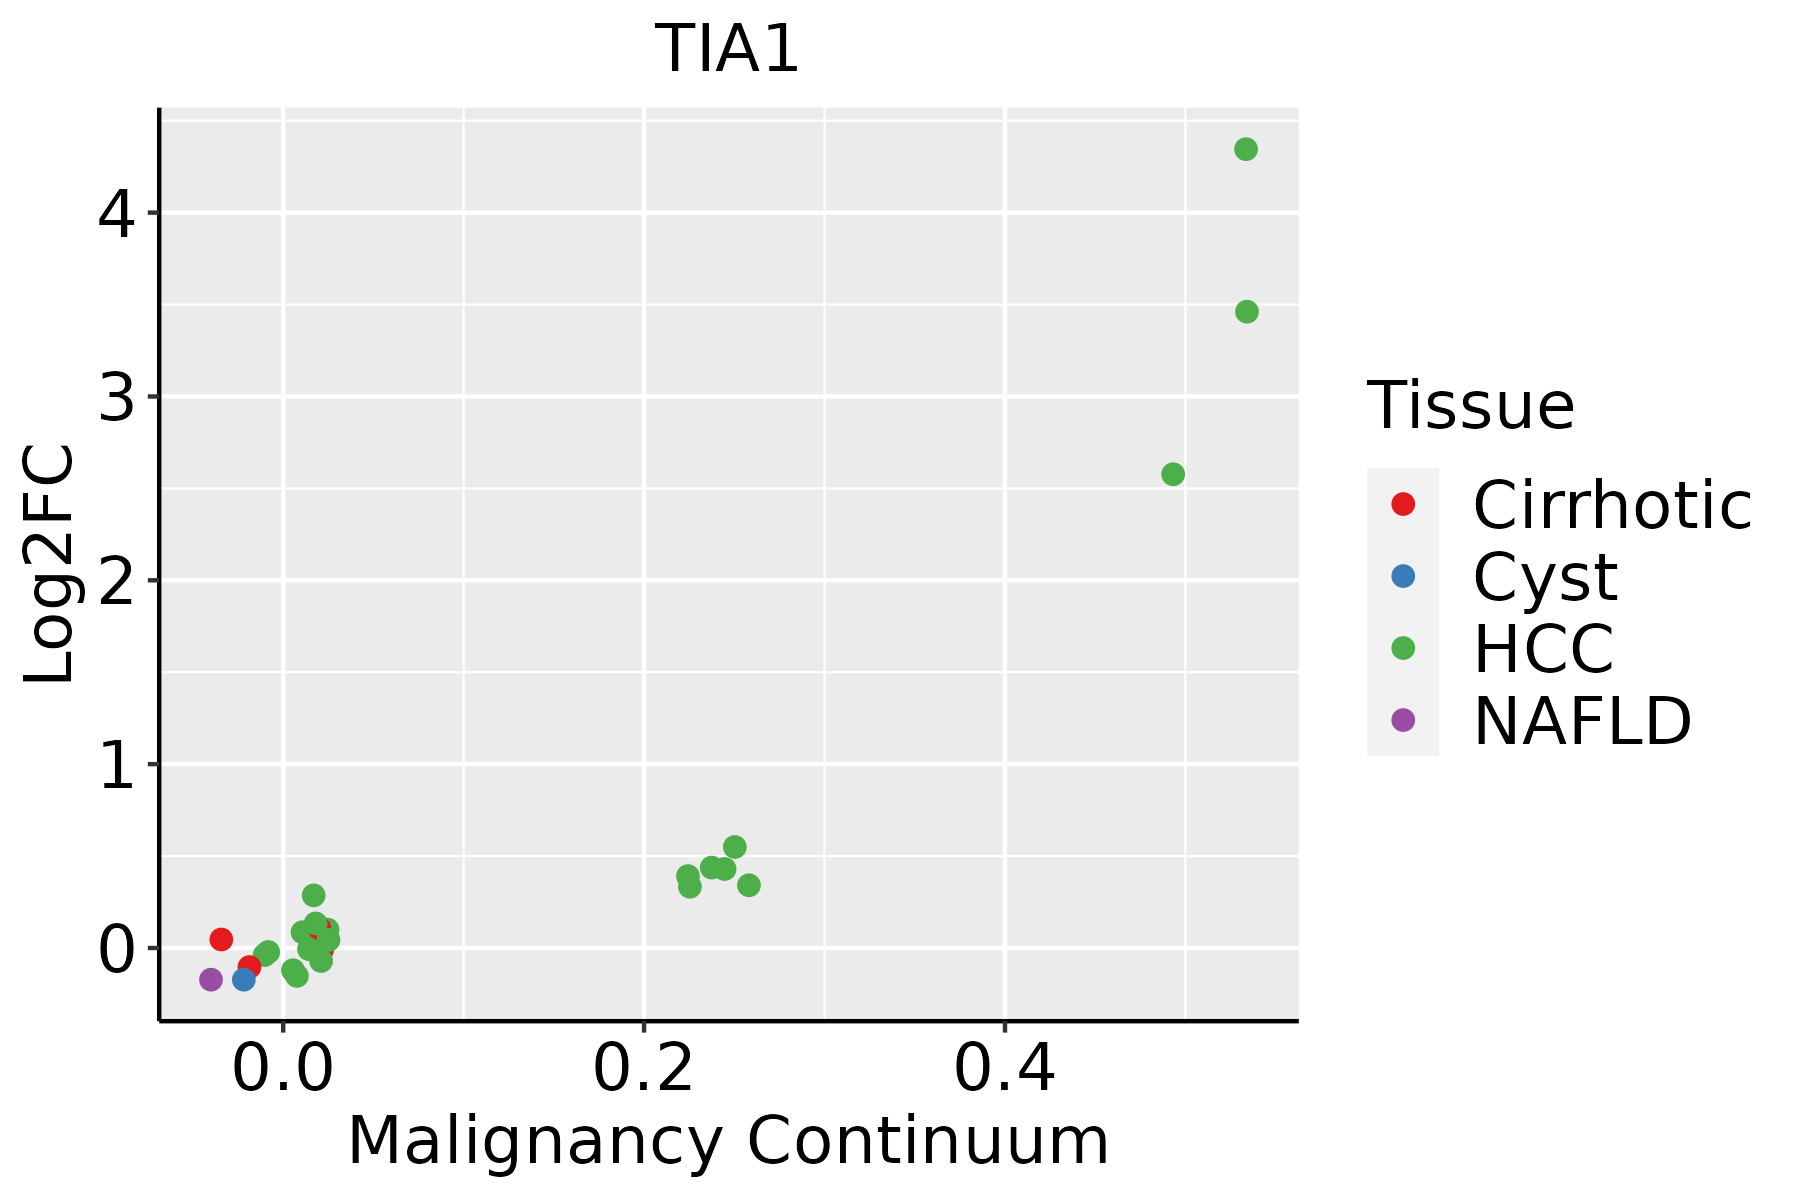
HCC: Hepatocellular carcinoma
NAFLD: Non-alcoholic fatty liver disease
Oral CavityThe image shows the transcriptomic changes along malignancy continuum.log2FC in expression of this searched gene in stem-like cells from each diseased tissue sample relative to stem-like cells in normal samples in each tissue plotted against the malignancy continuum. Samples are colored based on if they are from different disease stage.
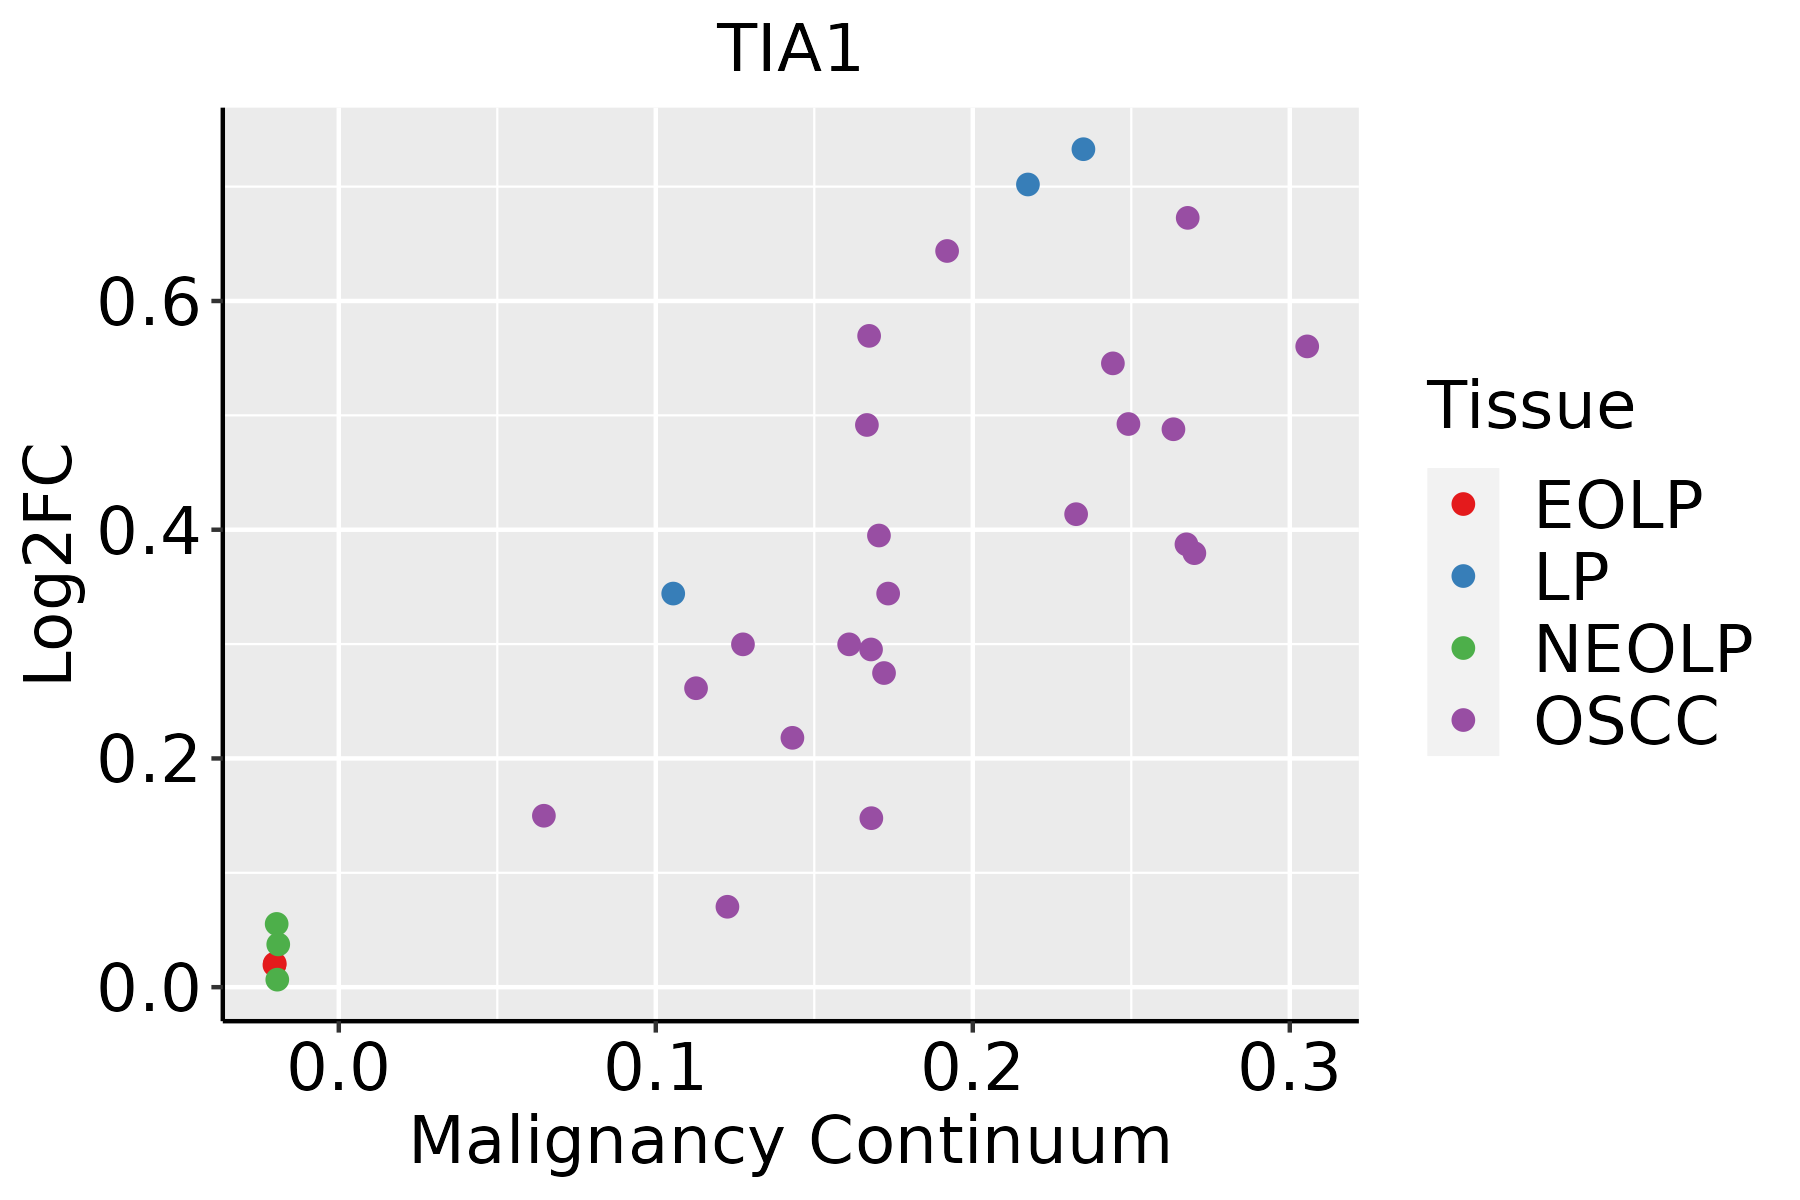
EOLP: Erosive Oral lichen planus
LP: leukoplakia
NEOLP: Non-erosive oral lichen planus
OSCC: Oral squamous cell carcinoma
ProstateThe image shows the transcriptomic changes along malignancy continuum.log2FC in expression of this searched gene in stem-like cells from each diseased tissue sample relative to stem-like cells in normal samples in each tissue plotted against the malignancy continuum. Samples are colored based on if they are from different disease stage.
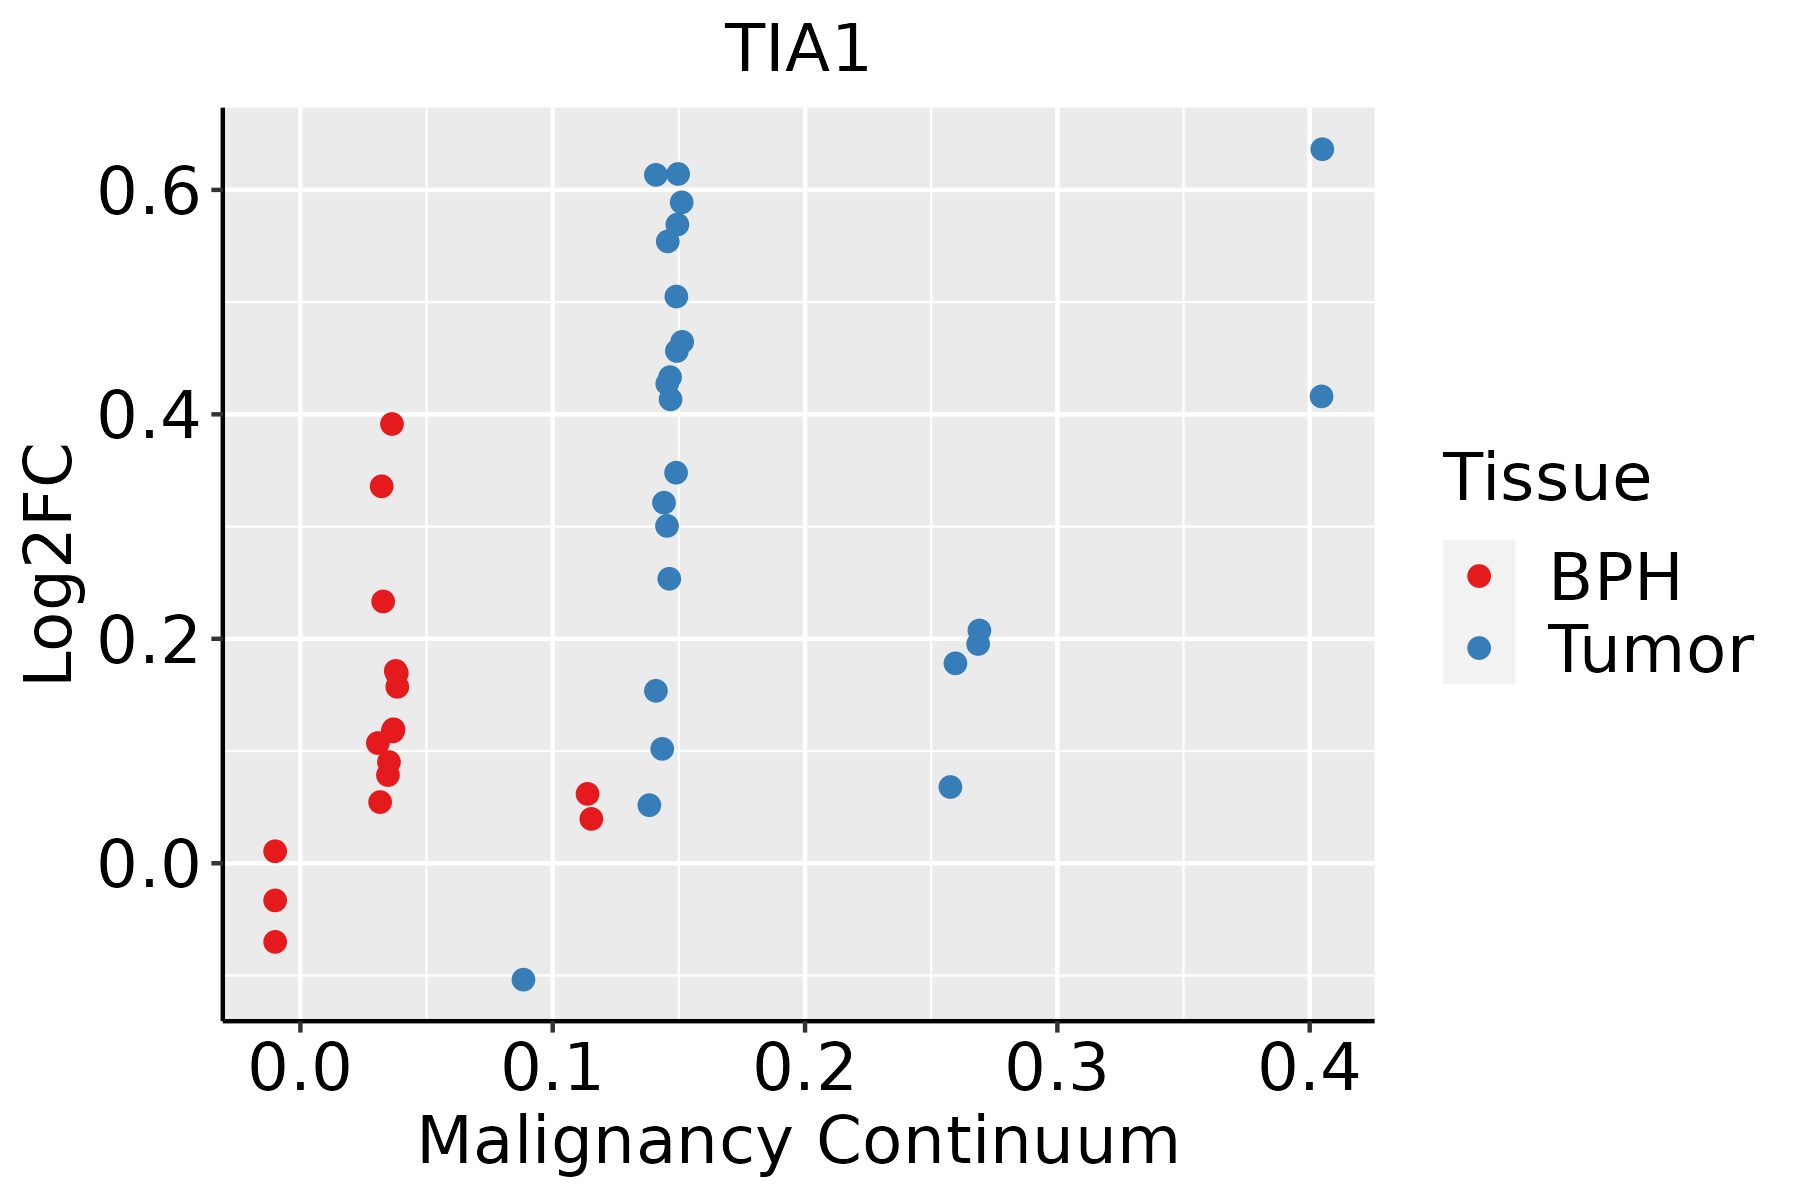
BPH: Benign Prostatic Hyperplasia
SkinThe image shows the transcriptomic changes along malignancy continuum.log2FC in expression of this searched gene in stem-like cells from each diseased tissue sample relative to stem-like cells in normal samples in each tissue plotted against the malignancy continuum. Samples are colored based on if they are from different disease stage.AK: Actinic keratosis
cSCC: Cutaneous squamous cell carcinoma
SCCIS:squamous cell carcinoma in situ
ThyroidThe image shows the transcriptomic changes along malignancy continuum.log2FC in expression of this searched gene in stem-like cells from each diseased tissue sample relative to stem-like cells in normal samples in each tissue plotted against the malignancy continuum. Samples are colored based on if they are from different disease stage.
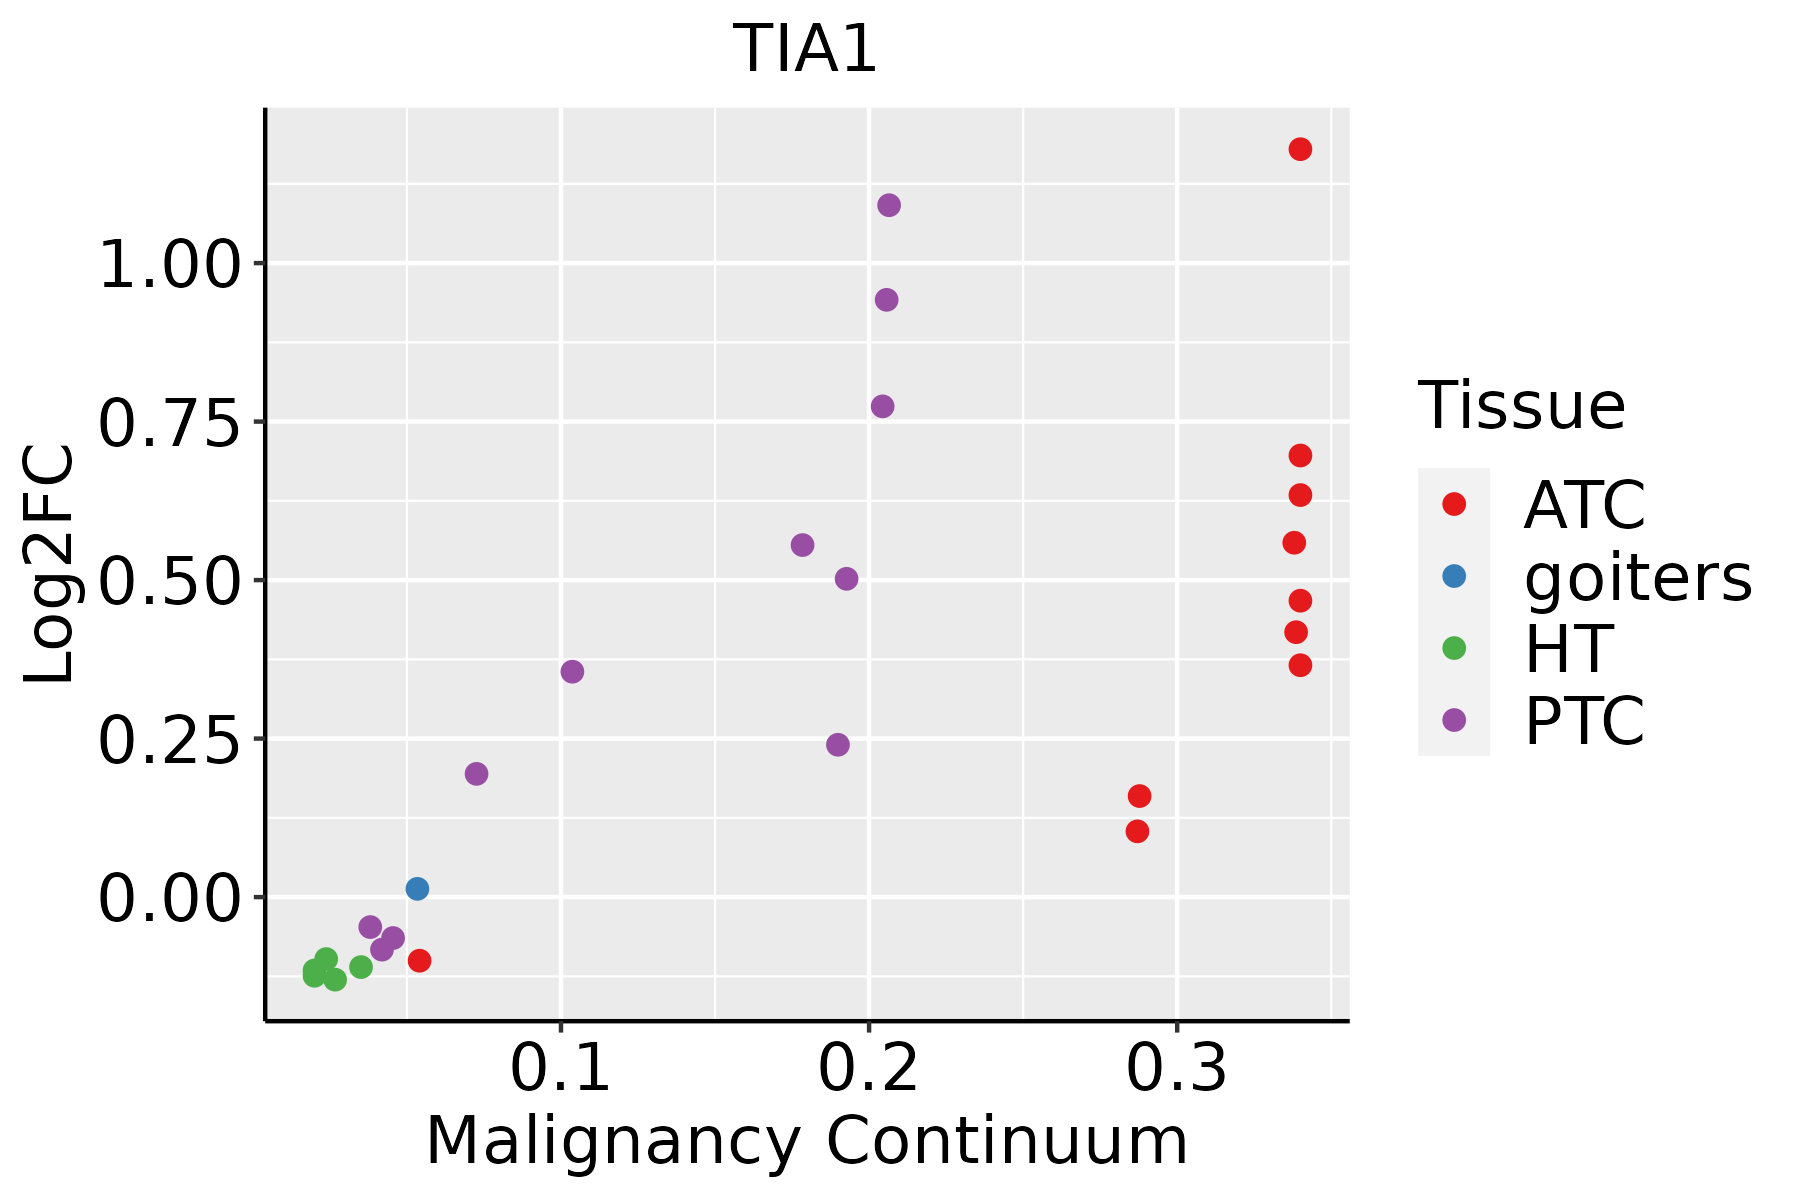
ATC: Anaplastic thyroid cancer
HT: Hashimoto's thyroiditis
PTC: Papillary thyroid cancer
∗log2FC in expression of this searched gene in stem-like cells from each diseased tissue sample relative to stem-like cells in normal samples in each tissue plotted against the malignancy continuum. Samples are colored based on if they are from different disease stage.

Top

Malignant transformation related pathway analysis

check buttonFind out the enriched GO biological processes and KEGG pathways involved in transition from healthy to precancer to cancer
check button Figure of enriched GO biological processes.
TissueDisease StageEnriched GO biological Processes
ColorectumADGO analysis - Figure of enriched GO biological processes: Top 15 enriched GO BP terms are showed in the bar plot of each disease state in each tissue. Each row represents a significant GO biological process which is colored according to the -log10(p.adjust).
ColorectumSERGO analysis - Figure of enriched GO biological processes: Top 15 enriched GO BP terms are showed in the bar plot of each disease state in each tissue. Each row represents a significant GO biological process which is colored according to the -log10(p.adjust).
ColorectumMSSGO analysis - Figure of enriched GO biological processes: Top 15 enriched GO BP terms are showed in the bar plot of each disease state in each tissue. Each row represents a significant GO biological process which is colored according to the -log10(p.adjust).
ColorectumMSI-HGO analysis - Figure of enriched GO biological processes: Top 15 enriched GO BP terms are showed in the bar plot of each disease state in each tissue. Each row represents a significant GO biological process which is colored according to the -log10(p.adjust).
ColorectumFAPGO analysis - Figure of enriched GO biological processes: Top 15 enriched GO BP terms are showed in the bar plot of each disease state in each tissue. Each row represents a significant GO biological process which is colored according to the -log10(p.adjust).
∗Top 15 enriched GO BP terms are showed in the bar plot of each disease state in each tissue. Each row represents a significant GO biological process which is colored according to the -log10(p.adjust).
Page: 1 2 3 4 5 6 7 8 9 

check button Enriched GO biological processes.
GO IDTissueDisease StageDescriptionGene RatioBg Ratiopvaluep.adjustCount
GO:0008380ColorectumADRNA splicing169/3918434/187233.59e-182.04e-15169
GO:0000377ColorectumADRNA splicing, via transesterification reactions with bulged adenosine as nucleophile130/3918320/187235.88e-162.16e-13130
GO:0000398ColorectumADmRNA splicing, via spliceosome130/3918320/187235.88e-162.16e-13130
GO:0000375ColorectumADRNA splicing, via transesterification reactions131/3918324/187237.11e-162.22e-13131
GO:1903311ColorectumADregulation of mRNA metabolic process117/3918288/187231.69e-144.23e-12117
GO:0043484ColorectumADregulation of RNA splicing70/3918148/187236.47e-131.16e-1070
GO:0048024ColorectumADregulation of mRNA splicing, via spliceosome50/3918101/187231.62e-101.56e-0850
GO:0050684ColorectumADregulation of mRNA processing61/3918137/187234.23e-103.58e-0861
GO:0006417ColorectumADregulation of translation141/3918468/187231.32e-064.22e-05141
GO:00083801ColorectumSERRNA splicing123/2897434/187233.84e-128.41e-10123
GO:00003751ColorectumSERRNA splicing, via transesterification reactions90/2897324/187238.68e-097.50e-0790
GO:00003771ColorectumSERRNA splicing, via transesterification reactions with bulged adenosine as nucleophile89/2897320/187239.82e-098.14e-0789
GO:00003981ColorectumSERmRNA splicing, via spliceosome89/2897320/187239.82e-098.14e-0789
GO:00434841ColorectumSERregulation of RNA splicing49/2897148/187237.02e-084.49e-0649
GO:19033111ColorectumSERregulation of mRNA metabolic process78/2897288/187232.61e-071.43e-0578
GO:00480241ColorectumSERregulation of mRNA splicing, via spliceosome35/2897101/187231.52e-066.85e-0535
GO:00506841ColorectumSERregulation of mRNA processing42/2897137/187235.57e-062.01e-0442
GO:00064171ColorectumSERregulation of translation100/2897468/187233.76e-045.74e-03100
GO:00083802ColorectumMSSRNA splicing159/3467434/187231.75e-191.22e-16159
GO:19033112ColorectumMSSregulation of mRNA metabolic process115/3467288/187231.23e-176.41e-15115
Page: 1 2 3 4 5 6 7 8 

check button Enriched KEGG pathways.
Pathway IDTissueDisease StageDescriptionGene RatioBg Ratiopvaluep.adjustqvalueCount
Page: 1 

Top

Cell-cell communication analysis

check buttonIdentification of potential cell-cell interactions between two cell types and their ligand-receptor pairs for different disease states
LigandReceptorLRpairPathwayTissueDisease Stage
Page: 1 

Top

Single-cell gene regulatory network inference analysis

check buttonFind out the significant the regulons (TFs) and the target genes of each regulon across cell types for different disease states
TFCell TypeTissueDisease StageTarget GeneRSSRegulon Activity
∗The dot plots of a searched regulon are shown for all cell subpopulations in each disease state of each tissue based on the regulon specific score inferred using pySCENIC and by calculating the average expression.
Page: 1 

Top

Somatic mutation of malignant transformation related genes

check buttonAnnotation of somatic variants for genes involved in malignant transformation
Hugo SymbolVariant ClassVariant ClassificationdbSNP RSHGVScHGVSpHGVSp ShortSWISSPROTBIOTYPESIFTPolyPhenTumor Sample BarcodeTissueHistologySexAgeStageTherapy TypesDrugsOutcome
TIA1SNVMissense_Mutationnovelc.920G>Tp.Gly307Valp.G307VP31483protein_codingdeleterious(0.01)possibly_damaging(0.548)TCGA-3C-AALI-01Breastbreast invasive carcinomaFemale<65I/IIUnspecificPoly EComplete Response
TIA1SNVMissense_Mutationc.319N>Tp.His107Tyrp.H107YP31483protein_codingdeleterious(0)probably_damaging(0.986)TCGA-A7-A0DA-01Breastbreast invasive carcinomaFemale<65I/IIChemotherapyadriamycinSD
TIA1SNVMissense_Mutationc.865N>Cp.Asp289Hisp.D289HP31483protein_codingdeleterious(0)probably_damaging(0.984)TCGA-AR-A24Q-01Breastbreast invasive carcinomaFemale<65I/IIChemotherapydoxorubicinSD
TIA1SNVMissense_Mutationc.1059G>Cp.Trp353Cysp.W353CP31483protein_codingdeleterious(0.03)benign(0.006)TCGA-EW-A1J5-01Breastbreast invasive carcinomaFemale<65I/IIChemotherapyadriamycinSD
TIA1insertionNonsense_Mutationnovelc.981_982insATTTAAAACATGTAATATAAAGATGTTAAAAAAAAAAACp.Trp327_Gln328insIleTerAsnMetTerTyrLysAspValLysLysLysAsnp.W327_Q328insI*NM*YKDVKKKNP31483protein_codingTCGA-AN-A0FN-01Breastbreast invasive carcinomaFemale<65I/IIUnknownUnknownSD
TIA1insertionFrame_Shift_Insnovelc.257_258insACAATTAp.Ser86ArgfsTer11p.S86Rfs*11P31483protein_codingTCGA-AR-A0U0-01Breastbreast invasive carcinomaFemale>=65I/IIUnknownUnknownSD
TIA1SNVMissense_Mutationnovelc.1107N>Ap.Ser369Argp.S369RP31483protein_codingdeleterious(0.02)benign(0.051)TCGA-C5-A8ZZ-01Cervixcervical & endocervical cancerFemale<65I/IIUnspecificCisplatinSD
TIA1SNVMissense_Mutationnovelc.29N>Gp.Tyr10Cysp.Y10CP31483protein_codingdeleterious(0)probably_damaging(0.999)TCGA-AA-A022-01Colorectumcolon adenocarcinomaFemale>=65I/IIUnknownUnknownSD
TIA1SNVMissense_Mutationrs756853891c.562G>Ap.Ala188Thrp.A188TP31483protein_codingtolerated(0.29)benign(0.015)TCGA-AD-A5EJ-01Colorectumcolon adenocarcinomaFemale>=65I/IIUnknownUnknownSD
TIA1SNVMissense_Mutationc.763N>Tp.Arg255Trpp.R255WP31483protein_codingdeleterious(0)probably_damaging(1)TCGA-AG-A002-01Colorectumrectum adenocarcinomaMale<65I/IIUnknownUnknownSD
Page: 1 2 3 4 

Top

Related drugs of malignant transformation related genes

check buttonIdentification of chemicals and drugs interact with genes involved in malignant transfromation
(DGIdb 4.0)
Entrez IDSymbolCategoryInteraction TypesDrug Claim NameDrug NamePMIDs
Page: 1