
|
|||||
|
 | |
| |
| |
| |
| |
| |
|
Gene: THY1 |
Gene summary for THY1 |
| Gene information | Species | Human | Gene symbol | THY1 | Gene ID | 7070 |
| Gene name | Thy-1 cell surface antigen | |
| Gene Alias | CD90 | |
| Cytomap | 11q23.3 | |
| Gene Type | protein-coding | GO ID | GO:0000902 | UniProtAcc | B0YJA4 |
Top |
Malignant transformation analysis |
| Identification of the aberrant gene expression in precancerous and cancerous lesions by comparing the gene expression of stem-like cells in diseased tissues with normal stem cells |
| Entrez ID | Symbol | Replicates | Species | Organ | Tissue | Adj P-value | Log2FC | Malignancy |
| 7070 | THY1 | AEH-subject1 | Human | Endometrium | AEH | 2.58e-26 | -6.71e-01 | -0.3059 |
| 7070 | THY1 | AEH-subject2 | Human | Endometrium | AEH | 2.21e-31 | -6.81e-01 | -0.2525 |
| 7070 | THY1 | AEH-subject3 | Human | Endometrium | AEH | 2.97e-23 | -6.09e-01 | -0.2576 |
| 7070 | THY1 | AEH-subject4 | Human | Endometrium | AEH | 6.10e-10 | -4.56e-01 | -0.2657 |
| 7070 | THY1 | AEH-subject5 | Human | Endometrium | AEH | 1.42e-31 | -6.69e-01 | -0.2953 |
| 7070 | THY1 | EEC-subject1 | Human | Endometrium | EEC | 2.81e-38 | -7.04e-01 | -0.2682 |
| 7070 | THY1 | EEC-subject2 | Human | Endometrium | EEC | 7.90e-36 | -6.97e-01 | -0.2607 |
| 7070 | THY1 | EEC-subject3 | Human | Endometrium | EEC | 5.88e-35 | -6.52e-01 | -0.2525 |
| 7070 | THY1 | EEC-subject4 | Human | Endometrium | EEC | 2.11e-27 | -6.57e-01 | -0.2571 |
| 7070 | THY1 | EEC-subject5 | Human | Endometrium | EEC | 4.66e-30 | -6.76e-01 | -0.249 |
| 7070 | THY1 | GSM5276934 | Human | Endometrium | EEC | 2.45e-28 | -6.49e-01 | -0.0913 |
| 7070 | THY1 | GSM5276935 | Human | Endometrium | EEC | 2.84e-37 | -7.03e-01 | -0.123 |
| 7070 | THY1 | GSM5276937 | Human | Endometrium | EEC | 2.30e-15 | -5.60e-01 | -0.0897 |
| 7070 | THY1 | GSM6177620_NYU_UCEC1_lib1_lib1 | Human | Endometrium | EEC | 3.44e-29 | -6.98e-01 | -0.1869 |
| 7070 | THY1 | GSM6177620_NYU_UCEC1_lib2_lib2 | Human | Endometrium | EEC | 6.29e-29 | -7.11e-01 | -0.1875 |
| 7070 | THY1 | GSM6177620_NYU_UCEC1_lib3_lib3 | Human | Endometrium | EEC | 2.64e-30 | -6.98e-01 | -0.1883 |
| 7070 | THY1 | GSM6177621_NYU_UCEC2_lib1_lib1 | Human | Endometrium | EEC | 2.08e-38 | -7.06e-01 | -0.1934 |
| 7070 | THY1 | GSM6177622_NYU_UCEC3_lib1_lib1 | Human | Endometrium | EEC | 3.43e-39 | -6.98e-01 | -0.1917 |
| 7070 | THY1 | GSM6177622_NYU_UCEC3_lib2_lib2 | Human | Endometrium | EEC | 6.07e-41 | -6.80e-01 | -0.1916 |
| 7070 | THY1 | GSM6177623_NYU_UCEC3_Vis | Human | Endometrium | EEC | 6.82e-15 | -5.39e-01 | -0.1269 |
| Page: 1 2 3 4 |
| Tissue | Expression Dynamics | Abbreviation |
| Endometrium |  | AEH: Atypical endometrial hyperplasia |
| EEC: Endometrioid Cancer | ||
| Esophagus | 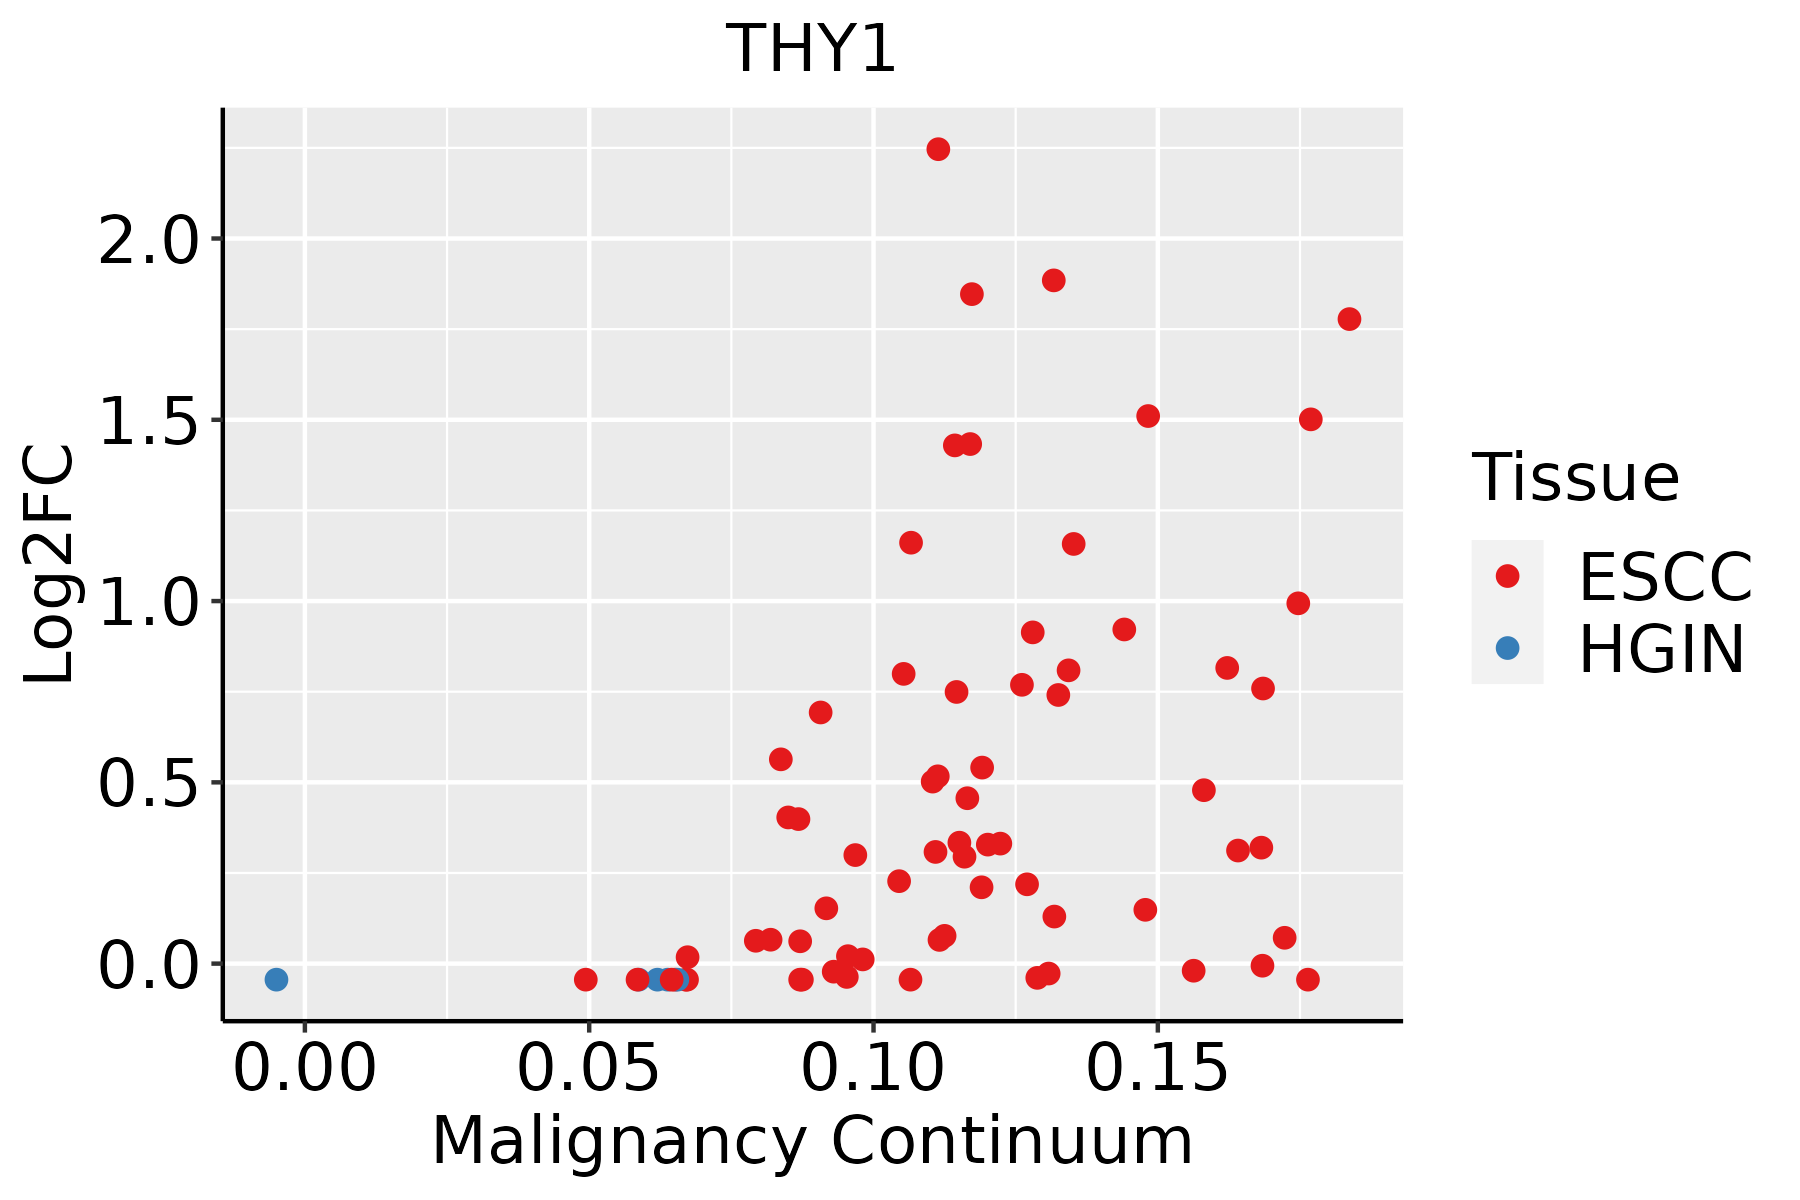 | ESCC: Esophageal squamous cell carcinoma |
| HGIN: High-grade intraepithelial neoplasias | ||
| LGIN: Low-grade intraepithelial neoplasias | ||
| Liver | 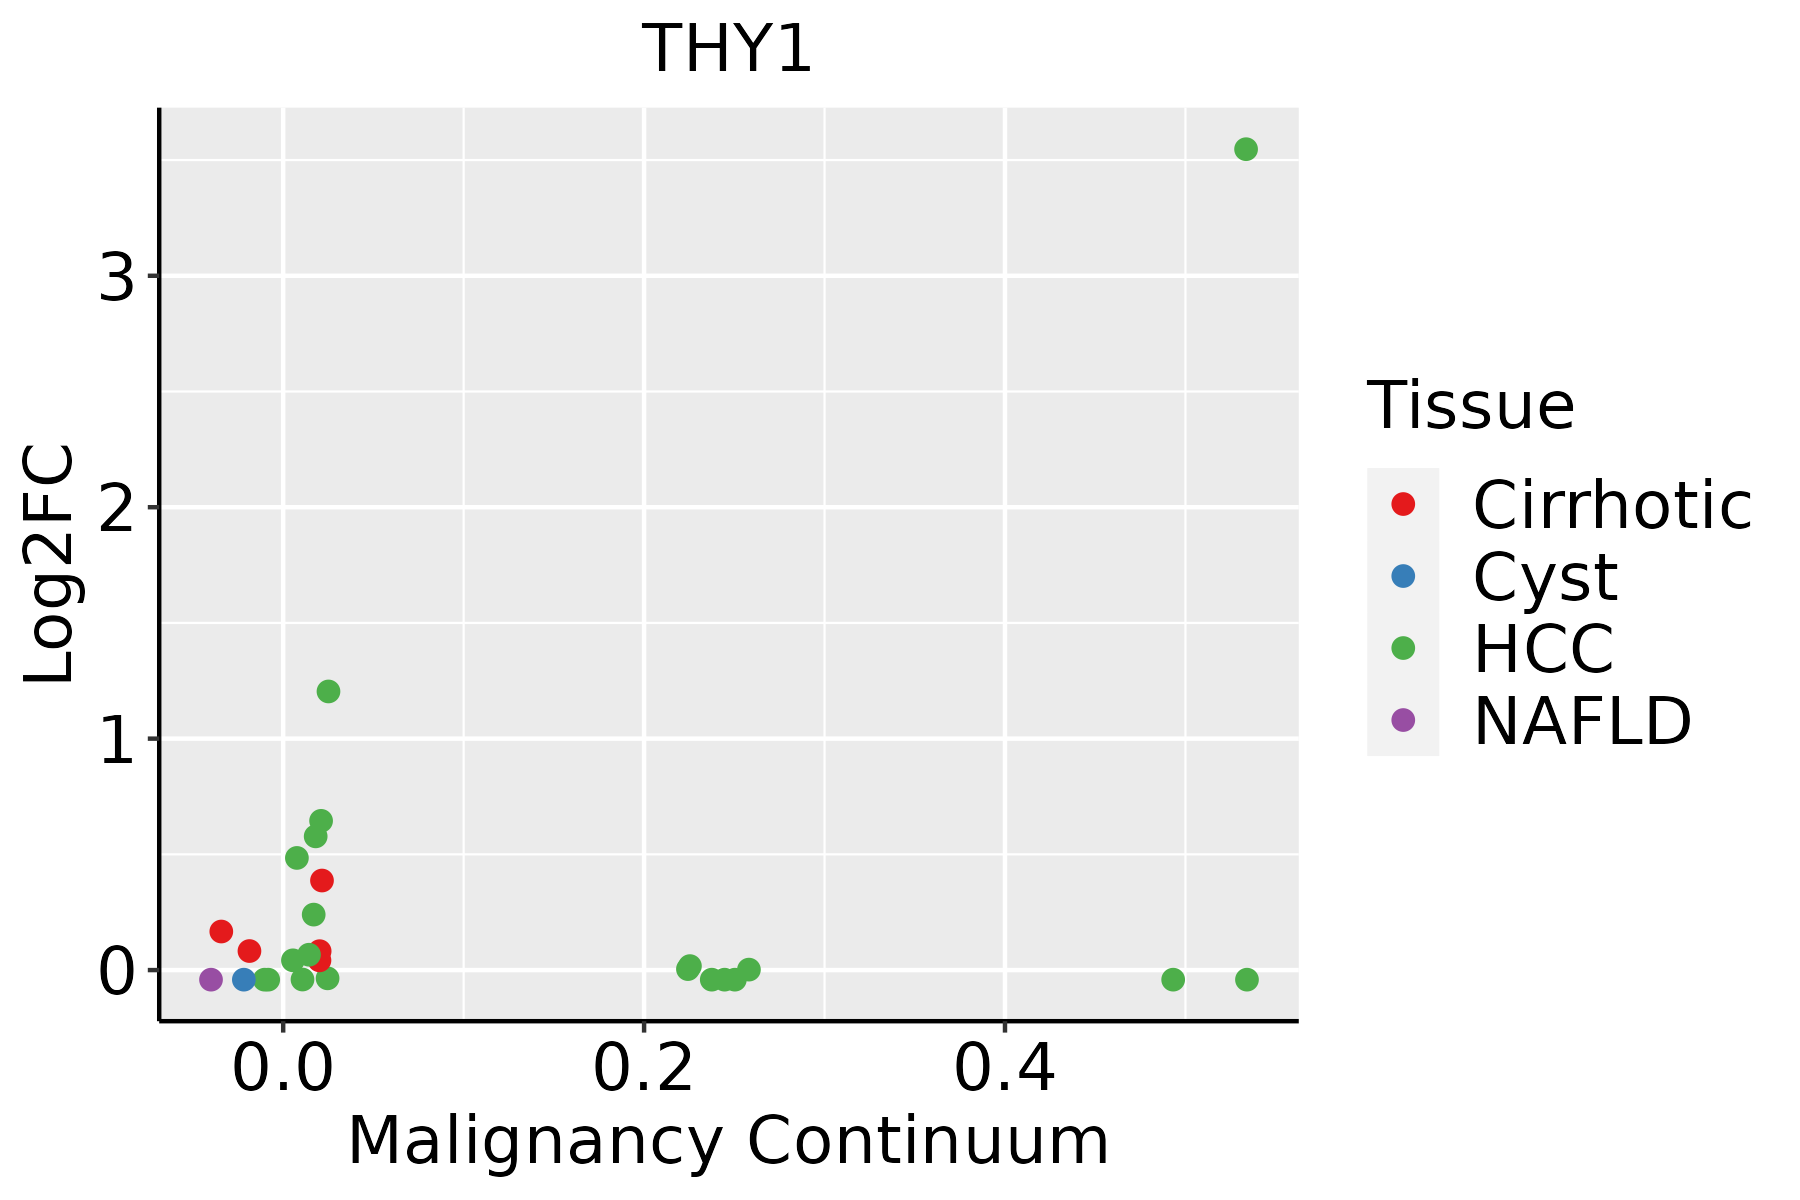 | HCC: Hepatocellular carcinoma |
| NAFLD: Non-alcoholic fatty liver disease | ||
| Oral Cavity |  | EOLP: Erosive Oral lichen planus |
| LP: leukoplakia | ||
| NEOLP: Non-erosive oral lichen planus | ||
| OSCC: Oral squamous cell carcinoma | ||
| Skin | 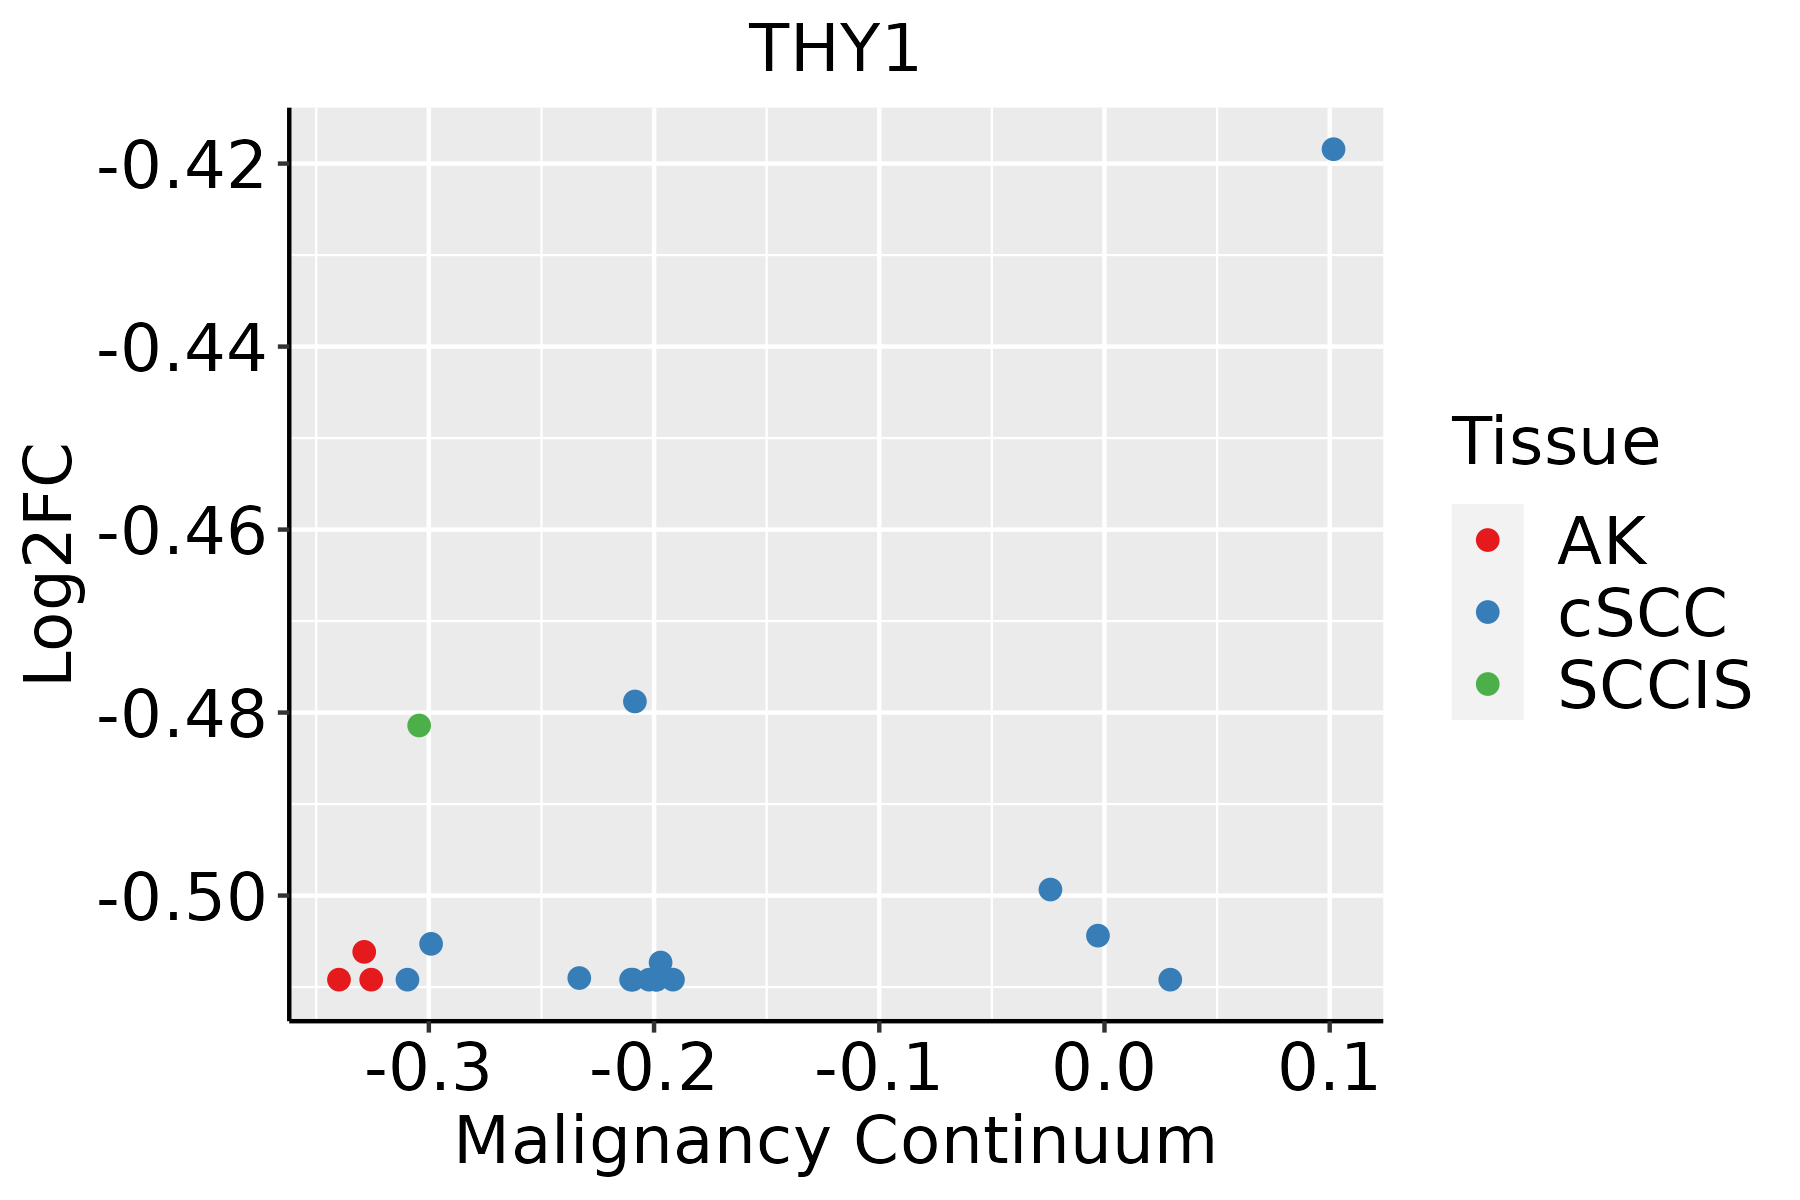 | AK: Actinic keratosis |
| cSCC: Cutaneous squamous cell carcinoma | ||
| SCCIS:squamous cell carcinoma in situ | ||
| Thyroid | 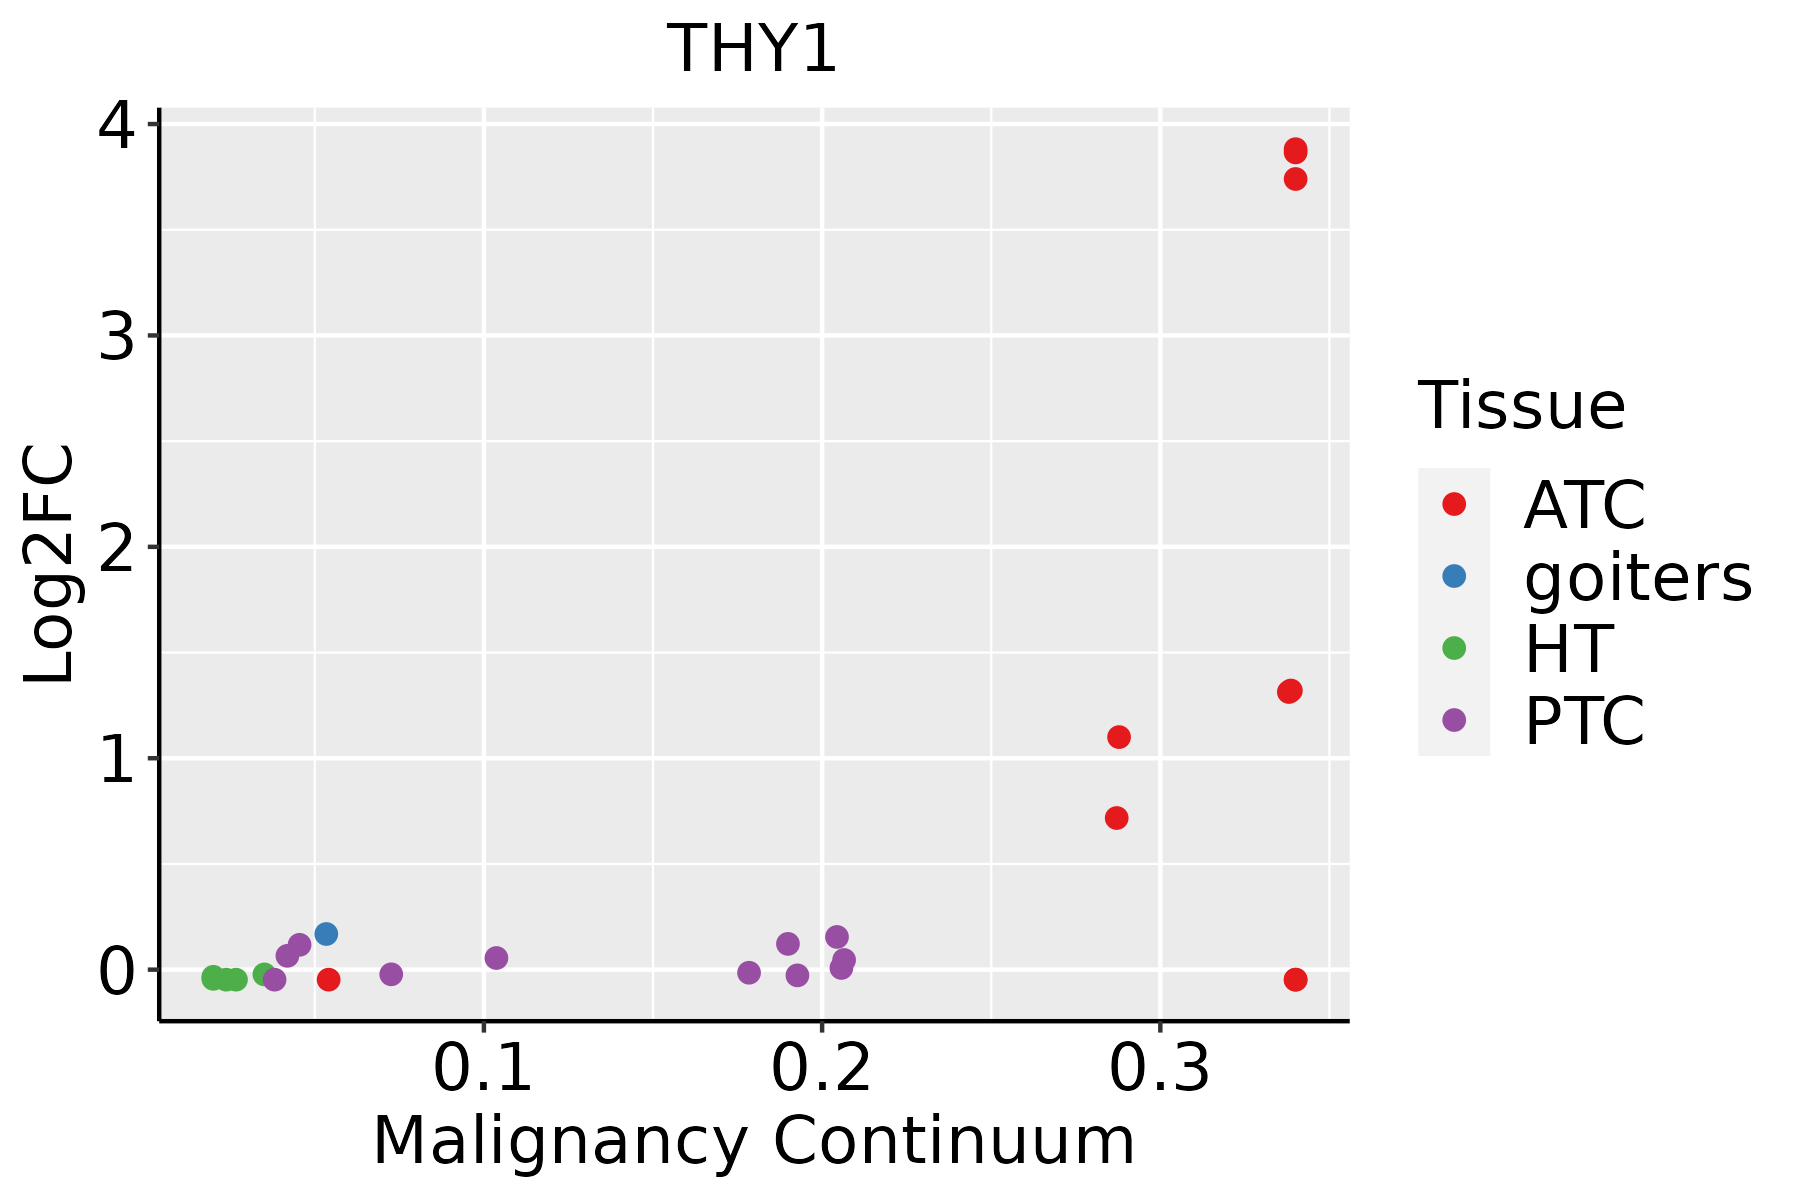 | ATC: Anaplastic thyroid cancer |
| HT: Hashimoto's thyroiditis | ||
| PTC: Papillary thyroid cancer |
| ∗log2FC in expression of this searched gene in stem-like cells from each diseased tissue sample relative to stem-like cells in normal samples in each tissue plotted against the malignancy continuum. Samples are colored based on if they are from different disease stage. |
Top |
Malignant transformation related pathway analysis |
| Find out the enriched GO biological processes and KEGG pathways involved in transition from healthy to precancer to cancer |
| Tissue | Disease Stage | Enriched GO biological Processes |
| Colorectum | AD |  |
| Colorectum | SER |  |
| Colorectum | MSS |  |
| Colorectum | MSI-H |  |
| Colorectum | FAP |  |
| ∗Top 15 enriched GO BP terms are showed in the bar plot of each disease state in each tissue. Each row represents a significant GO biological process which is colored according to the -log10(p.adjust). |
| Page: 1 2 3 4 5 6 7 8 9 |
| GO ID | Tissue | Disease Stage | Description | Gene Ratio | Bg Ratio | pvalue | p.adjust | Count |
| GO:001081015 | Endometrium | AEH | regulation of cell-substrate adhesion | 64/2100 | 221/18723 | 3.85e-13 | 9.62e-11 | 64 |
| GO:00315899 | Endometrium | AEH | cell-substrate adhesion | 87/2100 | 363/18723 | 3.51e-12 | 5.70e-10 | 87 |
| GO:004578516 | Endometrium | AEH | positive regulation of cell adhesion | 96/2100 | 437/18723 | 5.50e-11 | 7.18e-09 | 96 |
| GO:001081116 | Endometrium | AEH | positive regulation of cell-substrate adhesion | 38/2100 | 123/18723 | 3.08e-09 | 2.26e-07 | 38 |
| GO:00019529 | Endometrium | AEH | regulation of cell-matrix adhesion | 37/2100 | 128/18723 | 3.58e-08 | 1.99e-06 | 37 |
| GO:015011610 | Endometrium | AEH | regulation of cell-substrate junction organization | 25/2100 | 71/18723 | 8.77e-08 | 4.42e-06 | 25 |
| GO:015011510 | Endometrium | AEH | cell-substrate junction organization | 31/2100 | 101/18723 | 1.01e-07 | 4.99e-06 | 31 |
| GO:00072296 | Endometrium | AEH | integrin-mediated signaling pathway | 32/2100 | 107/18723 | 1.24e-07 | 5.80e-06 | 32 |
| GO:00480418 | Endometrium | AEH | focal adhesion assembly | 28/2100 | 87/18723 | 1.36e-07 | 6.14e-06 | 28 |
| GO:00071609 | Endometrium | AEH | cell-matrix adhesion | 54/2100 | 233/18723 | 1.42e-07 | 6.37e-06 | 54 |
| GO:00070449 | Endometrium | AEH | cell-substrate junction assembly | 29/2100 | 95/18723 | 2.93e-07 | 1.28e-05 | 29 |
| GO:00518939 | Endometrium | AEH | regulation of focal adhesion assembly | 23/2100 | 66/18723 | 3.54e-07 | 1.51e-05 | 23 |
| GO:00901099 | Endometrium | AEH | regulation of cell-substrate junction assembly | 23/2100 | 66/18723 | 3.54e-07 | 1.51e-05 | 23 |
| GO:00074098 | Endometrium | AEH | axonogenesis | 81/2100 | 418/18723 | 5.54e-07 | 2.12e-05 | 81 |
| GO:00615648 | Endometrium | AEH | axon development | 88/2100 | 467/18723 | 6.39e-07 | 2.38e-05 | 88 |
| GO:00343299 | Endometrium | AEH | cell junction assembly | 78/2100 | 420/18723 | 4.80e-06 | 1.24e-04 | 78 |
| GO:00430878 | Endometrium | AEH | regulation of GTPase activity | 66/2100 | 348/18723 | 1.26e-05 | 2.77e-04 | 66 |
| GO:00303364 | Endometrium | AEH | negative regulation of cell migration | 65/2100 | 344/18723 | 1.65e-05 | 3.42e-04 | 65 |
| GO:20001464 | Endometrium | AEH | negative regulation of cell motility | 67/2100 | 359/18723 | 1.86e-05 | 3.77e-04 | 67 |
| GO:00512714 | Endometrium | AEH | negative regulation of cellular component movement | 68/2100 | 367/18723 | 2.06e-05 | 4.11e-04 | 68 |
| Page: 1 2 3 4 5 6 7 8 9 10 11 12 13 14 15 16 17 18 19 20 21 22 23 24 25 26 27 28 29 30 31 32 33 34 35 36 |
| Pathway ID | Tissue | Disease Stage | Description | Gene Ratio | Bg Ratio | pvalue | p.adjust | qvalue | Count |
| hsa0467026 | Endometrium | AEH | Leukocyte transendothelial migration | 37/1197 | 114/8465 | 4.51e-07 | 6.11e-06 | 4.47e-06 | 37 |
| hsa04670111 | Endometrium | AEH | Leukocyte transendothelial migration | 37/1197 | 114/8465 | 4.51e-07 | 6.11e-06 | 4.47e-06 | 37 |
| hsa0467027 | Endometrium | EEC | Leukocyte transendothelial migration | 36/1237 | 114/8465 | 2.97e-06 | 3.91e-05 | 2.91e-05 | 36 |
| hsa0467036 | Endometrium | EEC | Leukocyte transendothelial migration | 36/1237 | 114/8465 | 2.97e-06 | 3.91e-05 | 2.91e-05 | 36 |
| hsa0467042 | Liver | HCC | Leukocyte transendothelial migration | 68/4020 | 114/8465 | 5.79e-03 | 1.64e-02 | 9.15e-03 | 68 |
| hsa0467052 | Liver | HCC | Leukocyte transendothelial migration | 68/4020 | 114/8465 | 5.79e-03 | 1.64e-02 | 9.15e-03 | 68 |
| hsa0467030 | Oral cavity | OSCC | Leukocyte transendothelial migration | 63/3704 | 114/8465 | 8.46e-03 | 1.96e-02 | 9.95e-03 | 63 |
| hsa04670113 | Oral cavity | OSCC | Leukocyte transendothelial migration | 63/3704 | 114/8465 | 8.46e-03 | 1.96e-02 | 9.95e-03 | 63 |
| hsa04670210 | Oral cavity | EOLP | Leukocyte transendothelial migration | 37/1218 | 114/8465 | 7.00e-07 | 6.85e-06 | 4.04e-06 | 37 |
| hsa0467038 | Oral cavity | EOLP | Leukocyte transendothelial migration | 37/1218 | 114/8465 | 7.00e-07 | 6.85e-06 | 4.04e-06 | 37 |
| hsa0467046 | Oral cavity | NEOLP | Leukocyte transendothelial migration | 31/1112 | 114/8465 | 4.39e-05 | 3.41e-04 | 2.14e-04 | 31 |
| hsa0467056 | Oral cavity | NEOLP | Leukocyte transendothelial migration | 31/1112 | 114/8465 | 4.39e-05 | 3.41e-04 | 2.14e-04 | 31 |
| Page: 1 |
Top |
Cell-cell communication analysis |
| Identification of potential cell-cell interactions between two cell types and their ligand-receptor pairs for different disease states |
| Ligand | Receptor | LRpair | Pathway | Tissue | Disease Stage |
| THY1 | ITGAM_ITGB2 | THY1_ITGAM_ITGB2 | THY1 | Breast | DCIS |
| THY1 | ITGAX_ITGB2 | THY1_ITGAX_ITGB2 | THY1 | Breast | DCIS |
| THY1 | ITGAM_ITGB2 | THY1_ITGAM_ITGB2 | THY1 | Breast | Healthy |
| THY1 | ITGAX_ITGB2 | THY1_ITGAX_ITGB2 | THY1 | Breast | Healthy |
| THY1 | ITGAM_ITGB2 | THY1_ITGAM_ITGB2 | THY1 | Breast | IDC |
| THY1 | ITGAX_ITGB2 | THY1_ITGAX_ITGB2 | THY1 | Breast | IDC |
| THY1 | ITGAM_ITGB2 | THY1_ITGAM_ITGB2 | THY1 | Cervix | ADJ |
| THY1 | ITGAX_ITGB2 | THY1_ITGAX_ITGB2 | THY1 | Cervix | ADJ |
| THY1 | ITGAX_ITGB2 | THY1_ITGAX_ITGB2 | THY1 | Cervix | Healthy |
| THY1 | ITGAM_ITGB2 | THY1_ITGAM_ITGB2 | THY1 | Cervix | Precancer |
| THY1 | ITGAX_ITGB2 | THY1_ITGAX_ITGB2 | THY1 | Cervix | Precancer |
| THY1 | ITGAX_ITGB2 | THY1_ITGAX_ITGB2 | THY1 | CRC | AD |
| THY1 | ITGAX_ITGB2 | THY1_ITGAX_ITGB2 | THY1 | CRC | ADJ |
| THY1 | ITGAM_ITGB2 | THY1_ITGAM_ITGB2 | THY1 | CRC | MSI-H |
| THY1 | ITGAX_ITGB2 | THY1_ITGAX_ITGB2 | THY1 | CRC | MSI-H |
| THY1 | ITGAX_ITGB2 | THY1_ITGAX_ITGB2 | THY1 | CRC | MSS |
| THY1 | ITGAM_ITGB2 | THY1_ITGAM_ITGB2 | THY1 | CRC | SER |
| THY1 | ITGAX_ITGB2 | THY1_ITGAX_ITGB2 | THY1 | CRC | SER |
| THY1 | ITGAM_ITGB2 | THY1_ITGAM_ITGB2 | THY1 | Endometrium | ADJ |
| THY1 | ITGAX_ITGB2 | THY1_ITGAX_ITGB2 | THY1 | Endometrium | ADJ |
| Page: 1 2 3 |
Top |
Single-cell gene regulatory network inference analysis |
| Find out the significant the regulons (TFs) and the target genes of each regulon across cell types for different disease states |
| TF | Cell Type | Tissue | Disease Stage | Target Gene | RSS | Regulon Activity |
| ∗The dot plots of a searched regulon are shown for all cell subpopulations in each disease state of each tissue based on the regulon specific score inferred using pySCENIC and by calculating the average expression. |
| Page: 1 |
Top |
Somatic mutation of malignant transformation related genes |
| Annotation of somatic variants for genes involved in malignant transformation |
| Hugo Symbol | Variant Class | Variant Classification | dbSNP RS | HGVSc | HGVSp | HGVSp Short | SWISSPROT | BIOTYPE | SIFT | PolyPhen | Tumor Sample Barcode | Tissue | Histology | Sex | Age | Stage | Therapy Types | Drugs | Outcome |
| THY1 | SNV | Missense_Mutation | rs147718110 | c.380T>G | p.Leu127Arg | p.L127R | P04216 | protein_coding | deleterious(0) | probably_damaging(0.997) | TCGA-C5-A1M9-01 | Cervix | cervical & endocervical cancer | Female | <65 | I/II | Chemotherapy | cisplatin | PD |
| THY1 | SNV | Missense_Mutation | novel | c.5N>G | p.Asn2Ser | p.N2S | P04216 | protein_coding | deleterious(0.01) | benign(0.025) | TCGA-A5-A2K5-01 | Endometrium | uterine corpus endometrioid carcinoma | Female | >=65 | I/II | Unknown | Unknown | SD |
| THY1 | SNV | Missense_Mutation | c.258G>T | p.Met86Ile | p.M86I | P04216 | protein_coding | tolerated(0.7) | benign(0) | TCGA-AX-A0J0-01 | Endometrium | uterine corpus endometrioid carcinoma | Female | <65 | I/II | Unknown | Unknown | SD | |
| THY1 | SNV | Missense_Mutation | novel | c.187N>A | p.Leu63Ile | p.L63I | P04216 | protein_coding | tolerated(0.65) | benign(0.03) | TCGA-AX-A2HC-01 | Endometrium | uterine corpus endometrioid carcinoma | Female | <65 | III/IV | Chemotherapy | paclitaxel | PD |
| THY1 | SNV | Missense_Mutation | rs533696940 | c.467N>T | p.Thr156Met | p.T156M | P04216 | protein_coding | tolerated(0.15) | benign(0.003) | TCGA-BK-A13B-01 | Endometrium | uterine corpus endometrioid carcinoma | Female | <65 | I/II | Unknown | Unknown | PD |
| THY1 | SNV | Missense_Mutation | novel | c.23N>T | p.Ala8Val | p.A8V | P04216 | protein_coding | tolerated(0.23) | benign(0.003) | TCGA-WQ-A9G7-01 | Liver | liver hepatocellular carcinoma | Female | >=65 | III/IV | Unknown | Unknown | SD |
| THY1 | SNV | Missense_Mutation | c.340N>G | p.Pro114Ala | p.P114A | P04216 | protein_coding | tolerated(0.77) | benign(0.001) | TCGA-50-5930-01 | Lung | lung adenocarcinoma | Male | <65 | III/IV | Chemotherapy | taxotere | PD | |
| THY1 | SNV | Missense_Mutation | c.128N>T | p.Thr43Ile | p.T43I | P04216 | protein_coding | deleterious(0.02) | benign(0.089) | TCGA-55-7903-01 | Lung | lung adenocarcinoma | Male | <65 | I/II | Unknown | Unknown | SD | |
| THY1 | SNV | Missense_Mutation | c.29N>A | p.Leu10Gln | p.L10Q | P04216 | protein_coding | deleterious(0) | probably_damaging(0.96) | TCGA-69-7979-01 | Lung | lung adenocarcinoma | Female | >=65 | I/II | Unknown | Unknown | SD | |
| THY1 | SNV | Missense_Mutation | c.277N>T | p.Ala93Ser | p.A93S | P04216 | protein_coding | tolerated(0.72) | benign(0.003) | TCGA-86-8054-01 | Lung | lung adenocarcinoma | Male | <65 | I/II | Chemotherapy | paclitaxel | CR |
| Page: 1 2 |
Top |
Related drugs of malignant transformation related genes |
| Identification of chemicals and drugs interact with genes involved in malignant transfromation |
| (DGIdb 4.0) |
| Entrez ID | Symbol | Category | Interaction Types | Drug Claim Name | Drug Name | PMIDs |
| 7070 | THY1 | DRUGGABLE GENOME, EXTERNAL SIDE OF PLASMA MEMBRANE, CELL SURFACE | HEL | 6186895 | ||
| 7070 | THY1 | DRUGGABLE GENOME, EXTERNAL SIDE OF PLASMA MEMBRANE, CELL SURFACE | THYMOSIN FRACTION 5 | 6141799 | ||
| 7070 | THY1 | DRUGGABLE GENOME, EXTERNAL SIDE OF PLASMA MEMBRANE, CELL SURFACE | FCA | 9521021 |
| Page: 1 |

Copyright 2023-Present -The University of Texas Health Science Center at Houston |