
|
|||||
|
 | |
| |
| |
| |
| |
| |
|
Gene: THUMPD2 |
Gene summary for THUMPD2 |
| Gene information | Species | Human | Gene symbol | THUMPD2 | Gene ID | 80745 |
| Gene name | THUMP domain containing 2 | |
| Gene Alias | C2orf8 | |
| Cytomap | 2p22.1 | |
| Gene Type | protein-coding | GO ID | GO:0001510 | UniProtAcc | B4DP37 |
Top |
Malignant transformation analysis |
| Identification of the aberrant gene expression in precancerous and cancerous lesions by comparing the gene expression of stem-like cells in diseased tissues with normal stem cells |
| Entrez ID | Symbol | Replicates | Species | Organ | Tissue | Adj P-value | Log2FC | Malignancy |
| 80745 | THUMPD2 | LZE2T | Human | Esophagus | ESCC | 1.07e-06 | 5.60e-01 | 0.082 |
| 80745 | THUMPD2 | LZE4T | Human | Esophagus | ESCC | 1.22e-16 | 3.67e-01 | 0.0811 |
| 80745 | THUMPD2 | LZE5T | Human | Esophagus | ESCC | 1.53e-04 | 2.60e-01 | 0.0514 |
| 80745 | THUMPD2 | LZE7T | Human | Esophagus | ESCC | 1.03e-05 | 3.83e-01 | 0.0667 |
| 80745 | THUMPD2 | LZE22T | Human | Esophagus | ESCC | 2.35e-02 | 2.88e-01 | 0.068 |
| 80745 | THUMPD2 | LZE24T | Human | Esophagus | ESCC | 2.56e-10 | 2.56e-01 | 0.0596 |
| 80745 | THUMPD2 | LZE21T | Human | Esophagus | ESCC | 4.80e-07 | 2.74e-01 | 0.0655 |
| 80745 | THUMPD2 | LZE6T | Human | Esophagus | ESCC | 5.16e-05 | 1.72e-01 | 0.0845 |
| 80745 | THUMPD2 | P1T-E | Human | Esophagus | ESCC | 1.33e-06 | 3.00e-01 | 0.0875 |
| 80745 | THUMPD2 | P2T-E | Human | Esophagus | ESCC | 7.58e-43 | 7.79e-01 | 0.1177 |
| 80745 | THUMPD2 | P4T-E | Human | Esophagus | ESCC | 5.51e-27 | 4.70e-01 | 0.1323 |
| 80745 | THUMPD2 | P5T-E | Human | Esophagus | ESCC | 6.79e-22 | 4.87e-01 | 0.1327 |
| 80745 | THUMPD2 | P8T-E | Human | Esophagus | ESCC | 1.46e-12 | 2.17e-01 | 0.0889 |
| 80745 | THUMPD2 | P9T-E | Human | Esophagus | ESCC | 1.54e-06 | 2.18e-01 | 0.1131 |
| 80745 | THUMPD2 | P10T-E | Human | Esophagus | ESCC | 7.78e-23 | 3.95e-01 | 0.116 |
| 80745 | THUMPD2 | P11T-E | Human | Esophagus | ESCC | 4.64e-14 | 4.54e-01 | 0.1426 |
| 80745 | THUMPD2 | P12T-E | Human | Esophagus | ESCC | 1.35e-29 | 5.50e-01 | 0.1122 |
| 80745 | THUMPD2 | P15T-E | Human | Esophagus | ESCC | 6.01e-22 | 4.33e-01 | 0.1149 |
| 80745 | THUMPD2 | P16T-E | Human | Esophagus | ESCC | 3.92e-24 | 3.80e-01 | 0.1153 |
| 80745 | THUMPD2 | P17T-E | Human | Esophagus | ESCC | 2.00e-04 | 1.58e-01 | 0.1278 |
| Page: 1 2 3 4 |
| Tissue | Expression Dynamics | Abbreviation |
| Esophagus | 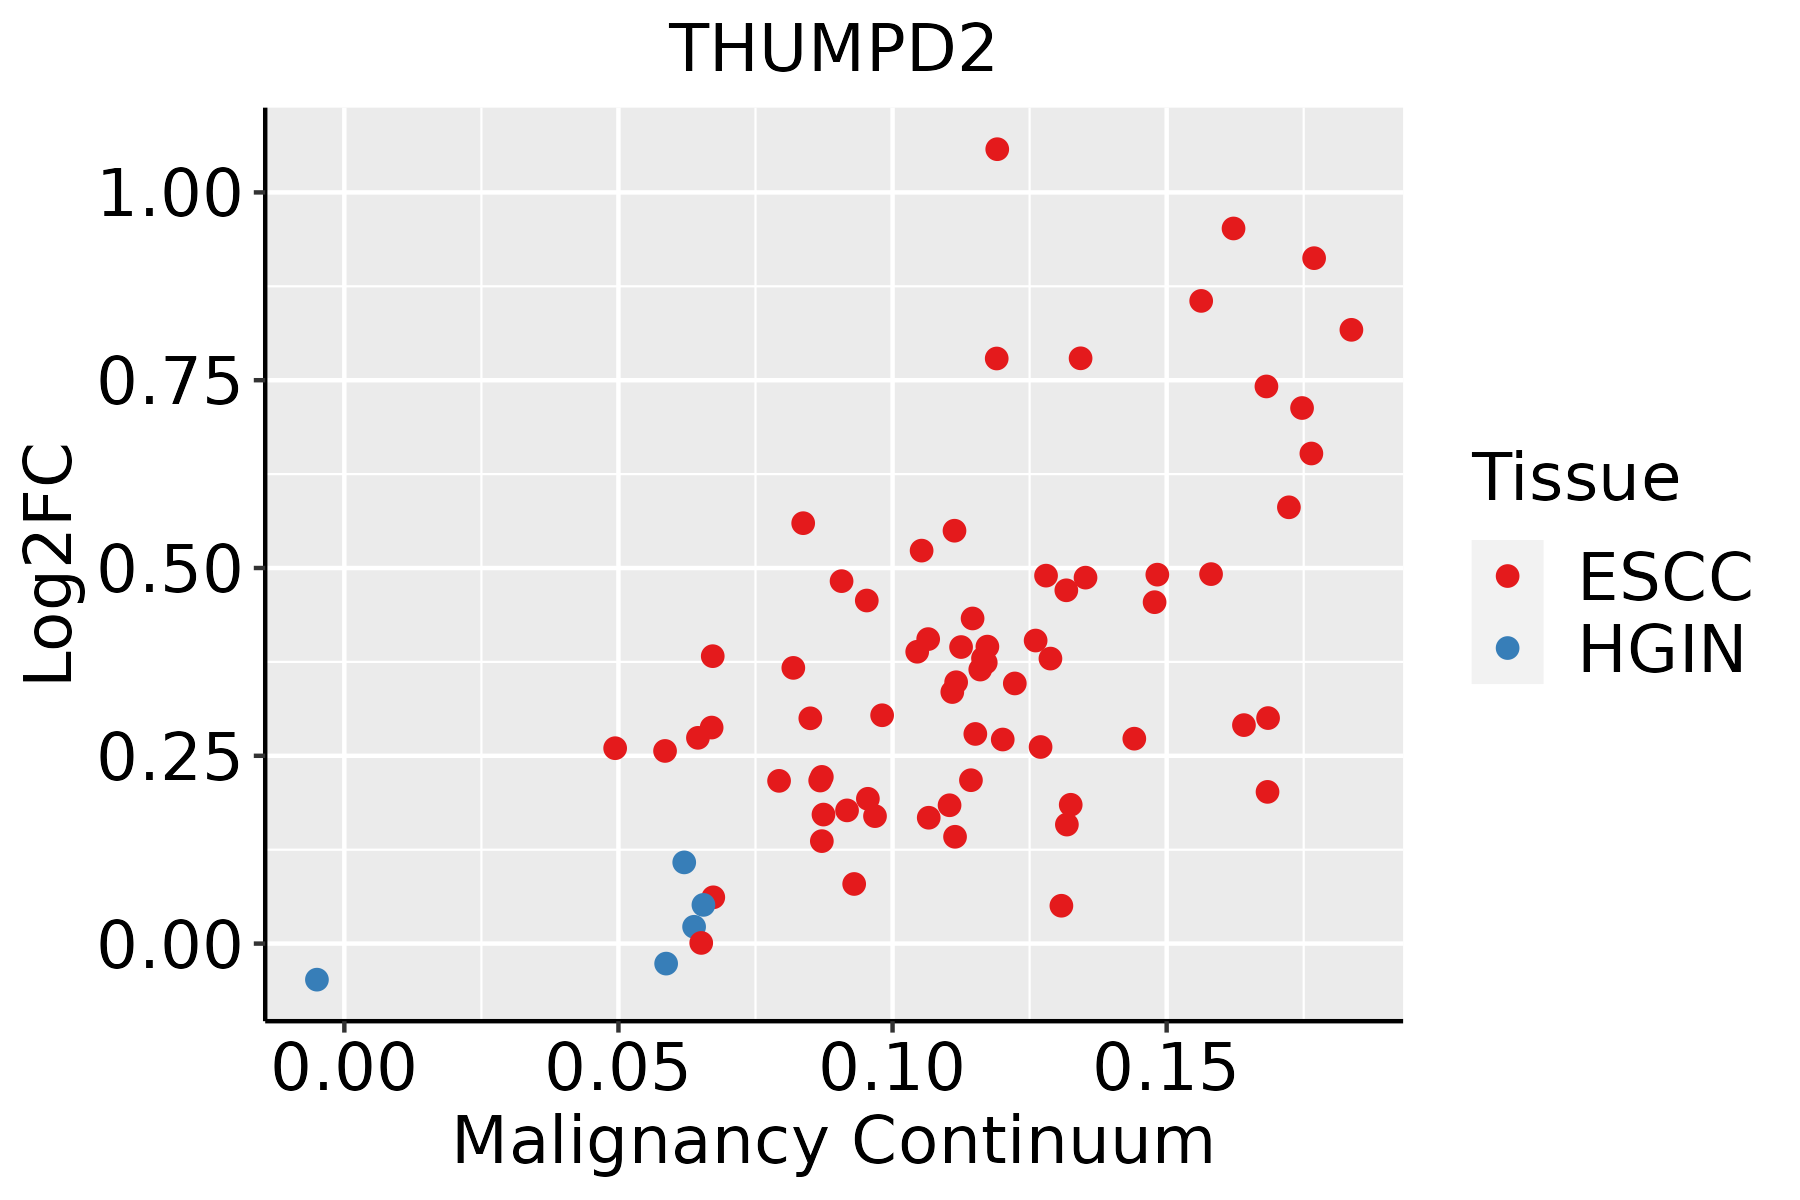 | ESCC: Esophageal squamous cell carcinoma |
| HGIN: High-grade intraepithelial neoplasias | ||
| LGIN: Low-grade intraepithelial neoplasias | ||
| Oral Cavity |  | EOLP: Erosive Oral lichen planus |
| LP: leukoplakia | ||
| NEOLP: Non-erosive oral lichen planus | ||
| OSCC: Oral squamous cell carcinoma | ||
| Skin | 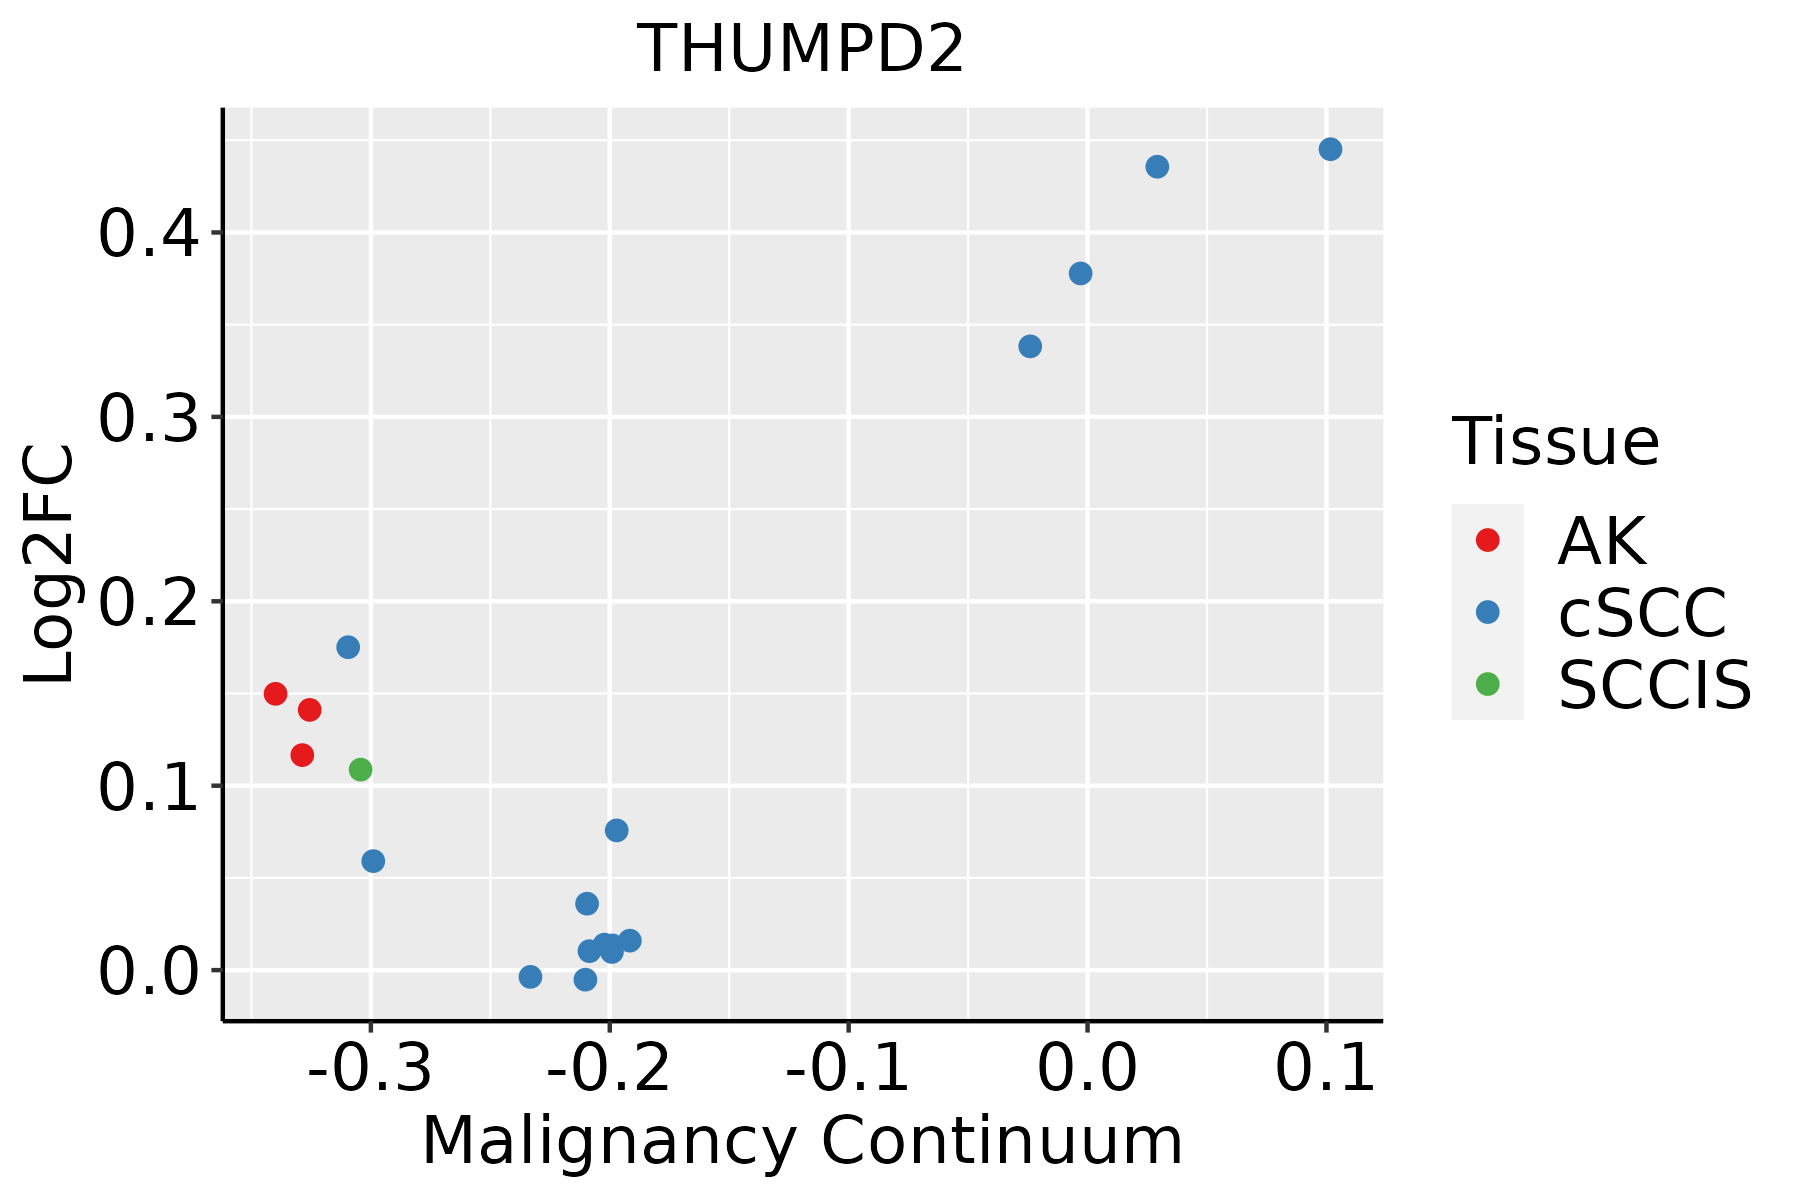 | AK: Actinic keratosis |
| cSCC: Cutaneous squamous cell carcinoma | ||
| SCCIS:squamous cell carcinoma in situ |
| ∗log2FC in expression of this searched gene in stem-like cells from each diseased tissue sample relative to stem-like cells in normal samples in each tissue plotted against the malignancy continuum. Samples are colored based on if they are from different disease stage. |
Top |
Malignant transformation related pathway analysis |
| Find out the enriched GO biological processes and KEGG pathways involved in transition from healthy to precancer to cancer |
| Tissue | Disease Stage | Enriched GO biological Processes |
| Colorectum | AD |  |
| Colorectum | SER |  |
| Colorectum | MSS |  |
| Colorectum | MSI-H |  |
| Colorectum | FAP |  |
| ∗Top 15 enriched GO BP terms are showed in the bar plot of each disease state in each tissue. Each row represents a significant GO biological process which is colored according to the -log10(p.adjust). |
| Page: 1 2 3 4 5 6 7 8 9 |
| GO ID | Tissue | Disease Stage | Description | Gene Ratio | Bg Ratio | pvalue | p.adjust | Count |
| GO:003447015 | Esophagus | ESCC | ncRNA processing | 300/8552 | 395/18723 | 3.09e-35 | 3.26e-32 | 300 |
| GO:003466012 | Esophagus | ESCC | ncRNA metabolic process | 346/8552 | 485/18723 | 4.35e-31 | 2.51e-28 | 346 |
| GO:00434143 | Esophagus | ESCC | macromolecule methylation | 199/8552 | 316/18723 | 3.44e-10 | 9.57e-09 | 199 |
| GO:00080333 | Esophagus | ESCC | tRNA processing | 92/8552 | 127/18723 | 7.83e-10 | 1.93e-08 | 92 |
| GO:00063992 | Esophagus | ESCC | tRNA metabolic process | 122/8552 | 179/18723 | 9.03e-10 | 2.19e-08 | 122 |
| GO:00322592 | Esophagus | ESCC | methylation | 222/8552 | 364/18723 | 2.26e-09 | 5.09e-08 | 222 |
| GO:00094512 | Esophagus | ESCC | RNA modification | 114/8552 | 167/18723 | 2.76e-09 | 6.04e-08 | 114 |
| GO:00015101 | Esophagus | ESCC | RNA methylation | 58/8552 | 83/18723 | 6.87e-06 | 6.94e-05 | 58 |
| GO:00064002 | Esophagus | ESCC | tRNA modification | 62/8552 | 90/18723 | 7.02e-06 | 7.04e-05 | 62 |
| GO:00304881 | Esophagus | ESCC | tRNA methylation | 30/8552 | 41/18723 | 3.27e-04 | 1.93e-03 | 30 |
| GO:00344709 | Oral cavity | OSCC | ncRNA processing | 263/7305 | 395/18723 | 4.38e-29 | 2.78e-26 | 263 |
| GO:00346605 | Oral cavity | OSCC | ncRNA metabolic process | 296/7305 | 485/18723 | 2.94e-23 | 6.65e-21 | 296 |
| GO:00080332 | Oral cavity | OSCC | tRNA processing | 78/7305 | 127/18723 | 2.56e-07 | 4.00e-06 | 78 |
| GO:00063991 | Oral cavity | OSCC | tRNA metabolic process | 101/7305 | 179/18723 | 1.65e-06 | 2.15e-05 | 101 |
| GO:00094511 | Oral cavity | OSCC | RNA modification | 95/7305 | 167/18723 | 2.05e-06 | 2.62e-05 | 95 |
| GO:00064001 | Oral cavity | OSCC | tRNA modification | 53/7305 | 90/18723 | 1.04e-04 | 7.70e-04 | 53 |
| GO:00434142 | Oral cavity | OSCC | macromolecule methylation | 149/7305 | 316/18723 | 1.82e-03 | 8.60e-03 | 149 |
| GO:00322591 | Oral cavity | OSCC | methylation | 168/7305 | 364/18723 | 3.03e-03 | 1.31e-02 | 168 |
| GO:003447017 | Skin | cSCC | ncRNA processing | 215/4864 | 395/18723 | 6.83e-34 | 4.28e-31 | 215 |
| GO:003466013 | Skin | cSCC | ncRNA metabolic process | 234/4864 | 485/18723 | 1.37e-26 | 4.77e-24 | 234 |
| Page: 1 2 |
| Pathway ID | Tissue | Disease Stage | Description | Gene Ratio | Bg Ratio | pvalue | p.adjust | qvalue | Count |
| Page: 1 |
Top |
Cell-cell communication analysis |
| Identification of potential cell-cell interactions between two cell types and their ligand-receptor pairs for different disease states |
| Ligand | Receptor | LRpair | Pathway | Tissue | Disease Stage |
| Page: 1 |
Top |
Single-cell gene regulatory network inference analysis |
| Find out the significant the regulons (TFs) and the target genes of each regulon across cell types for different disease states |
| TF | Cell Type | Tissue | Disease Stage | Target Gene | RSS | Regulon Activity |
| ∗The dot plots of a searched regulon are shown for all cell subpopulations in each disease state of each tissue based on the regulon specific score inferred using pySCENIC and by calculating the average expression. |
| Page: 1 |
Top |
Somatic mutation of malignant transformation related genes |
| Annotation of somatic variants for genes involved in malignant transformation |
| Hugo Symbol | Variant Class | Variant Classification | dbSNP RS | HGVSc | HGVSp | HGVSp Short | SWISSPROT | BIOTYPE | SIFT | PolyPhen | Tumor Sample Barcode | Tissue | Histology | Sex | Age | Stage | Therapy Types | Drugs | Outcome |
| THUMPD2 | SNV | Missense_Mutation | c.910N>A | p.Asp304Asn | p.D304N | Q9BTF0 | protein_coding | deleterious(0) | probably_damaging(1) | TCGA-BH-A0H7-01 | Breast | breast invasive carcinoma | Female | >=65 | III/IV | Chemotherapy | doxorubicin | SD | |
| THUMPD2 | SNV | Missense_Mutation | c.421G>C | p.Glu141Gln | p.E141Q | Q9BTF0 | protein_coding | tolerated(0.15) | benign(0.189) | TCGA-E2-A14Y-01 | Breast | breast invasive carcinoma | Female | <65 | I/II | Chemotherapy | carboplatin | SD | |
| THUMPD2 | SNV | Missense_Mutation | c.1403G>C | p.Arg468Thr | p.R468T | Q9BTF0 | protein_coding | deleterious(0.04) | benign(0.023) | TCGA-GM-A2D9-01 | Breast | breast invasive carcinoma | Female | >=65 | I/II | Hormone Therapy | arimidex | SD | |
| THUMPD2 | SNV | Missense_Mutation | rs145719615 | c.1395C>A | p.Phe465Leu | p.F465L | Q9BTF0 | protein_coding | tolerated(0.66) | benign(0) | TCGA-AA-3977-01 | Colorectum | colon adenocarcinoma | Male | >=65 | I/II | Unknown | Unknown | SD |
| THUMPD2 | SNV | Missense_Mutation | novel | c.546A>C | p.Glu182Asp | p.E182D | Q9BTF0 | protein_coding | tolerated(0.47) | benign(0.015) | TCGA-AA-3984-01 | Colorectum | colon adenocarcinoma | Female | <65 | I/II | Unknown | Unknown | SD |
| THUMPD2 | SNV | Missense_Mutation | c.721A>G | p.Lys241Glu | p.K241E | Q9BTF0 | protein_coding | deleterious(0.02) | possibly_damaging(0.643) | TCGA-AA-A00N-01 | Colorectum | colon adenocarcinoma | Male | >=65 | I/II | Unknown | Unknown | PD | |
| THUMPD2 | SNV | Missense_Mutation | c.779N>A | p.Ser260Tyr | p.S260Y | Q9BTF0 | protein_coding | deleterious(0) | possibly_damaging(0.877) | TCGA-G4-6628-01 | Colorectum | colon adenocarcinoma | Male | >=65 | I/II | Unknown | Unknown | SD | |
| THUMPD2 | SNV | Missense_Mutation | c.377N>A | p.Ser126Tyr | p.S126Y | Q9BTF0 | protein_coding | tolerated(0.29) | possibly_damaging(0.781) | TCGA-AG-A002-01 | Colorectum | rectum adenocarcinoma | Male | <65 | I/II | Unknown | Unknown | SD | |
| THUMPD2 | insertion | Frame_Shift_Ins | novel | c.408dupA | p.Val137SerfsTer5 | p.V137Sfs*5 | Q9BTF0 | protein_coding | TCGA-EI-6884-01 | Colorectum | rectum adenocarcinoma | Male | >=65 | III/IV | Chemotherapy | 5 | SD | ||
| THUMPD2 | SNV | Missense_Mutation | c.1492N>C | p.Ser498Pro | p.S498P | Q9BTF0 | protein_coding | tolerated(0.1) | possibly_damaging(0.548) | TCGA-A5-A0G2-01 | Endometrium | uterine corpus endometrioid carcinoma | Female | <65 | III/IV | Unknown | Unknown | SD |
| Page: 1 2 3 4 |
Top |
Related drugs of malignant transformation related genes |
| Identification of chemicals and drugs interact with genes involved in malignant transfromation |
| (DGIdb 4.0) |
| Entrez ID | Symbol | Category | Interaction Types | Drug Claim Name | Drug Name | PMIDs |
| Page: 1 |

Copyright 2023-Present -The University of Texas Health Science Center at Houston |