
|
|||||
|
 | |
| |
| |
| |
| |
| |
|
Gene: THTPA |
Gene summary for THTPA |
| Gene information | Species | Human | Gene symbol | THTPA | Gene ID | 79178 |
| Gene name | thiamine triphosphatase | |
| Gene Alias | THTP | |
| Cytomap | 14q11.2 | |
| Gene Type | protein-coding | GO ID | GO:0006066 | UniProtAcc | Q9BU02 |
Top |
Malignant transformation analysis |
| Identification of the aberrant gene expression in precancerous and cancerous lesions by comparing the gene expression of stem-like cells in diseased tissues with normal stem cells |
| Entrez ID | Symbol | Replicates | Species | Organ | Tissue | Adj P-value | Log2FC | Malignancy |
| 79178 | THTPA | LZE4T | Human | Esophagus | ESCC | 6.35e-03 | 1.42e-01 | 0.0811 |
| 79178 | THTPA | LZE5T | Human | Esophagus | ESCC | 1.57e-02 | 1.93e-01 | 0.0514 |
| 79178 | THTPA | LZE24T | Human | Esophagus | ESCC | 7.85e-14 | 3.61e-01 | 0.0596 |
| 79178 | THTPA | LZE6T | Human | Esophagus | ESCC | 1.71e-05 | 2.04e-01 | 0.0845 |
| 79178 | THTPA | P1T-E | Human | Esophagus | ESCC | 7.11e-04 | 1.84e-01 | 0.0875 |
| 79178 | THTPA | P2T-E | Human | Esophagus | ESCC | 5.79e-16 | 3.15e-01 | 0.1177 |
| 79178 | THTPA | P4T-E | Human | Esophagus | ESCC | 1.39e-22 | 4.81e-01 | 0.1323 |
| 79178 | THTPA | P5T-E | Human | Esophagus | ESCC | 9.44e-07 | 1.56e-01 | 0.1327 |
| 79178 | THTPA | P8T-E | Human | Esophagus | ESCC | 2.06e-08 | 1.86e-01 | 0.0889 |
| 79178 | THTPA | P9T-E | Human | Esophagus | ESCC | 9.50e-13 | 2.96e-01 | 0.1131 |
| 79178 | THTPA | P10T-E | Human | Esophagus | ESCC | 4.12e-11 | 2.35e-01 | 0.116 |
| 79178 | THTPA | P11T-E | Human | Esophagus | ESCC | 2.06e-07 | 2.37e-01 | 0.1426 |
| 79178 | THTPA | P12T-E | Human | Esophagus | ESCC | 9.74e-22 | 3.85e-01 | 0.1122 |
| 79178 | THTPA | P15T-E | Human | Esophagus | ESCC | 1.25e-26 | 5.13e-01 | 0.1149 |
| 79178 | THTPA | P16T-E | Human | Esophagus | ESCC | 1.30e-15 | 3.48e-01 | 0.1153 |
| 79178 | THTPA | P17T-E | Human | Esophagus | ESCC | 1.29e-08 | 3.00e-01 | 0.1278 |
| 79178 | THTPA | P19T-E | Human | Esophagus | ESCC | 4.64e-06 | 3.76e-01 | 0.1662 |
| 79178 | THTPA | P20T-E | Human | Esophagus | ESCC | 2.16e-09 | 2.20e-01 | 0.1124 |
| 79178 | THTPA | P21T-E | Human | Esophagus | ESCC | 9.35e-10 | 1.93e-01 | 0.1617 |
| 79178 | THTPA | P22T-E | Human | Esophagus | ESCC | 4.24e-18 | 3.21e-01 | 0.1236 |
| Page: 1 2 3 |
| Tissue | Expression Dynamics | Abbreviation |
| Esophagus | 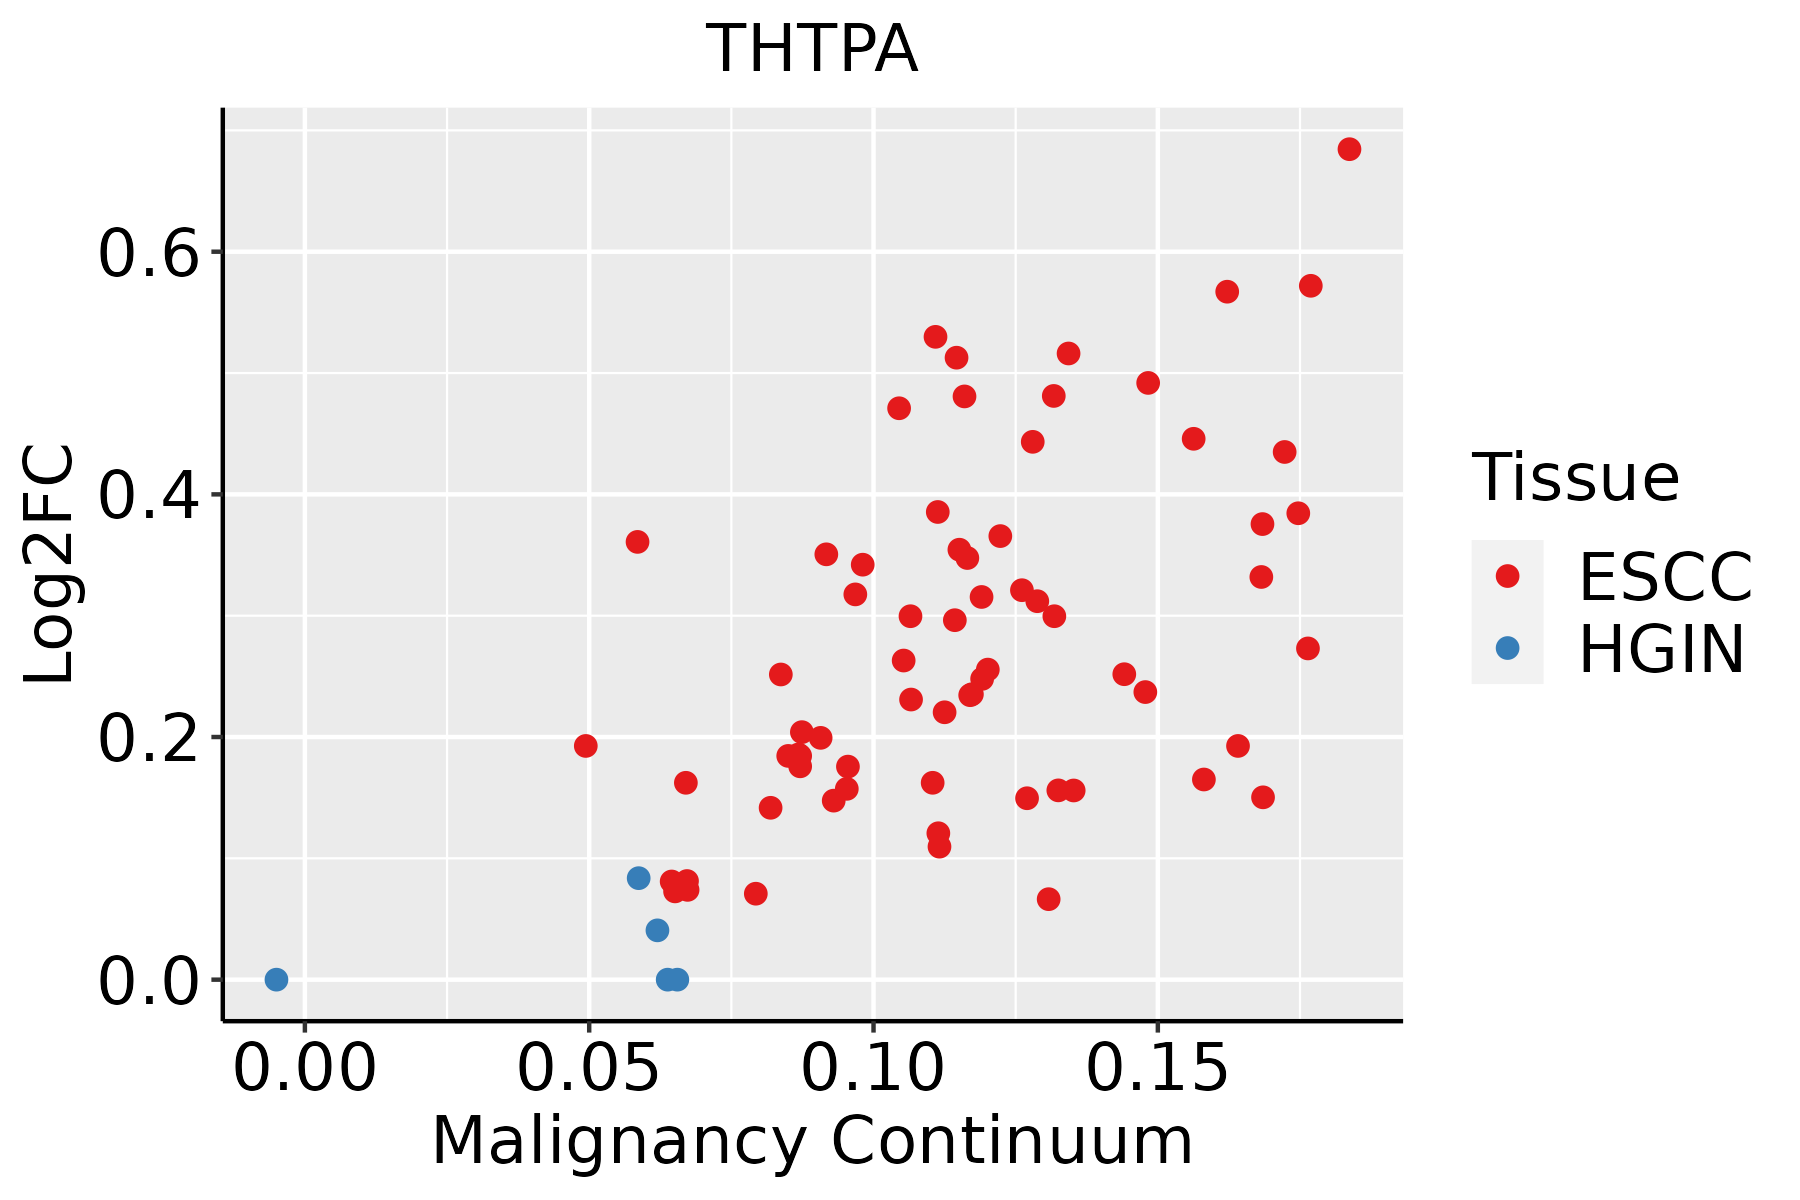 | ESCC: Esophageal squamous cell carcinoma |
| HGIN: High-grade intraepithelial neoplasias | ||
| LGIN: Low-grade intraepithelial neoplasias |
| ∗log2FC in expression of this searched gene in stem-like cells from each diseased tissue sample relative to stem-like cells in normal samples in each tissue plotted against the malignancy continuum. Samples are colored based on if they are from different disease stage. |
Top |
Malignant transformation related pathway analysis |
| Find out the enriched GO biological processes and KEGG pathways involved in transition from healthy to precancer to cancer |
| Tissue | Disease Stage | Enriched GO biological Processes |
| Colorectum | AD |  |
| Colorectum | SER |  |
| Colorectum | MSS |  |
| Colorectum | MSI-H |  |
| Colorectum | FAP |  |
| ∗Top 15 enriched GO BP terms are showed in the bar plot of each disease state in each tissue. Each row represents a significant GO biological process which is colored according to the -log10(p.adjust). |
| Page: 1 2 3 4 5 6 7 8 9 |
| GO ID | Tissue | Disease Stage | Description | Gene Ratio | Bg Ratio | pvalue | p.adjust | Count |
| GO:0006091110 | Esophagus | ESCC | generation of precursor metabolites and energy | 331/8552 | 490/18723 | 3.86e-23 | 8.45e-21 | 331 |
| GO:001631110 | Esophagus | ESCC | dephosphorylation | 251/8552 | 417/18723 | 1.26e-09 | 2.99e-08 | 251 |
| GO:00067906 | Esophagus | ESCC | sulfur compound metabolic process | 201/8552 | 339/18723 | 2.64e-07 | 3.94e-06 | 201 |
| GO:00060668 | Esophagus | ESCC | alcohol metabolic process | 202/8552 | 353/18723 | 7.32e-06 | 7.26e-05 | 202 |
| GO:00067671 | Esophagus | ESCC | water-soluble vitamin metabolic process | 41/8552 | 59/18723 | 1.84e-04 | 1.17e-03 | 41 |
| GO:00067661 | Esophagus | ESCC | vitamin metabolic process | 67/8552 | 106/18723 | 2.03e-04 | 1.28e-03 | 67 |
| GO:00725273 | Esophagus | ESCC | pyrimidine-containing compound metabolic process | 52/8552 | 82/18723 | 9.03e-04 | 4.61e-03 | 52 |
| Page: 1 |
| Pathway ID | Tissue | Disease Stage | Description | Gene Ratio | Bg Ratio | pvalue | p.adjust | qvalue | Count |
| Page: 1 |
Top |
Cell-cell communication analysis |
| Identification of potential cell-cell interactions between two cell types and their ligand-receptor pairs for different disease states |
| Ligand | Receptor | LRpair | Pathway | Tissue | Disease Stage |
| Page: 1 |
Top |
Single-cell gene regulatory network inference analysis |
| Find out the significant the regulons (TFs) and the target genes of each regulon across cell types for different disease states |
| TF | Cell Type | Tissue | Disease Stage | Target Gene | RSS | Regulon Activity |
| ∗The dot plots of a searched regulon are shown for all cell subpopulations in each disease state of each tissue based on the regulon specific score inferred using pySCENIC and by calculating the average expression. |
| Page: 1 |
Top |
Somatic mutation of malignant transformation related genes |
| Annotation of somatic variants for genes involved in malignant transformation |
| Hugo Symbol | Variant Class | Variant Classification | dbSNP RS | HGVSc | HGVSp | HGVSp Short | SWISSPROT | BIOTYPE | SIFT | PolyPhen | Tumor Sample Barcode | Tissue | Histology | Sex | Age | Stage | Therapy Types | Drugs | Outcome |
| THTPA | SNV | Missense_Mutation | novel | c.517G>C | p.Glu173Gln | p.E173Q | Q9BU02 | protein_coding | deleterious(0.01) | benign(0.289) | TCGA-A7-A56D-01 | Breast | breast invasive carcinoma | Female | >=65 | I/II | Hormone Therapy | arimidex | SD |
| THTPA | SNV | Missense_Mutation | c.107G>A | p.Arg36Gln | p.R36Q | Q9BU02 | protein_coding | tolerated(0.12) | benign(0.162) | TCGA-D8-A1J8-01 | Breast | breast invasive carcinoma | Female | >=65 | I/II | Hormone Therapy | nolvadex | SD | |
| THTPA | SNV | Missense_Mutation | c.253G>A | p.Glu85Lys | p.E85K | Q9BU02 | protein_coding | tolerated(0.17) | possibly_damaging(0.541) | TCGA-D8-A1J8-01 | Breast | breast invasive carcinoma | Female | >=65 | I/II | Hormone Therapy | nolvadex | SD | |
| THTPA | SNV | Missense_Mutation | c.490G>A | p.Glu164Lys | p.E164K | Q9BU02 | protein_coding | tolerated(0.23) | benign(0.007) | TCGA-GM-A2D9-01 | Breast | breast invasive carcinoma | Female | >=65 | I/II | Hormone Therapy | arimidex | SD | |
| THTPA | SNV | Missense_Mutation | c.332N>A | p.Gly111Asp | p.G111D | Q9BU02 | protein_coding | tolerated(0.18) | benign(0.204) | TCGA-AA-A01R-01 | Colorectum | colon adenocarcinoma | Male | <65 | III/IV | Chemotherapy | 5-fluorouracil | PD | |
| THTPA | deletion | Frame_Shift_Del | rs750640155 | c.125delN | p.Pro43LeufsTer3 | p.P43Lfs*3 | Q9BU02 | protein_coding | TCGA-WS-AB45-01 | Colorectum | colon adenocarcinoma | Female | <65 | I/II | Unknown | Unknown | SD | ||
| THTPA | SNV | Missense_Mutation | novel | c.377G>T | p.Ser126Ile | p.S126I | Q9BU02 | protein_coding | tolerated(0.06) | probably_damaging(0.927) | TCGA-A5-A0G1-01 | Endometrium | uterine corpus endometrioid carcinoma | Female | >=65 | I/II | Unknown | Unknown | SD |
| THTPA | SNV | Missense_Mutation | novel | c.455G>A | p.Gly152Asp | p.G152D | Q9BU02 | protein_coding | tolerated(0.06) | possibly_damaging(0.743) | TCGA-A5-A0G2-01 | Endometrium | uterine corpus endometrioid carcinoma | Female | <65 | III/IV | Unknown | Unknown | SD |
| THTPA | SNV | Missense_Mutation | novel | c.641G>T | p.Ser214Ile | p.S214I | Q9BU02 | protein_coding | tolerated_low_confidence(0.1) | benign(0.061) | TCGA-A5-A1OF-01 | Endometrium | uterine corpus endometrioid carcinoma | Female | <65 | I/II | Unknown | Unknown | SD |
| THTPA | SNV | Missense_Mutation | novel | c.174N>T | p.Glu58Asp | p.E58D | Q9BU02 | protein_coding | deleterious(0.02) | benign(0.336) | TCGA-B5-A3FA-01 | Endometrium | uterine corpus endometrioid carcinoma | Female | >=65 | I/II | Unknown | Unknown | SD |
| Page: 1 2 |
Top |
Related drugs of malignant transformation related genes |
| Identification of chemicals and drugs interact with genes involved in malignant transfromation |
| (DGIdb 4.0) |
| Entrez ID | Symbol | Category | Interaction Types | Drug Claim Name | Drug Name | PMIDs |
| Page: 1 |

Copyright 2023-Present -The University of Texas Health Science Center at Houston |