
|
|||||
|
 | |
| |
| |
| |
| |
| |
|
Gene: THSD7B |
Gene summary for THSD7B |
| Gene information | Species | Human | Gene symbol | THSD7B | Gene ID | 80731 |
| Gene name | thrombospondin type 1 domain containing 7B | |
| Gene Alias | THSD7B | |
| Cytomap | 2q22.1 | |
| Gene Type | protein-coding | GO ID | GO:0006996 | UniProtAcc | E7EM75 |
Top |
Malignant transformation analysis |
| Identification of the aberrant gene expression in precancerous and cancerous lesions by comparing the gene expression of stem-like cells in diseased tissues with normal stem cells |
| Entrez ID | Symbol | Replicates | Species | Organ | Tissue | Adj P-value | Log2FC | Malignancy |
| 80731 | THSD7B | P2T-E | Human | Esophagus | ESCC | 1.17e-07 | 2.58e-01 | 0.1177 |
| 80731 | THSD7B | P12T-E | Human | Esophagus | ESCC | 1.29e-35 | 8.15e-01 | 0.1122 |
| 80731 | THSD7B | P16T-E | Human | Esophagus | ESCC | 3.10e-02 | 9.65e-02 | 0.1153 |
| 80731 | THSD7B | P56T-E | Human | Esophagus | ESCC | 3.89e-06 | 5.55e-01 | 0.1613 |
| 80731 | THSD7B | 048752_1579-all-cells | Human | Prostate | BPH | 5.27e-07 | 1.84e-01 | 0.1008 |
| 80731 | THSD7B | 052095_1628-all-cells | Human | Prostate | BPH | 1.63e-32 | 6.07e-01 | 0.1032 |
| 80731 | THSD7B | 052097_1595-all-cells | Human | Prostate | BPH | 1.08e-16 | 3.82e-01 | 0.0972 |
| 80731 | THSD7B | 052099_1652-all-cells | Human | Prostate | BPH | 7.83e-27 | 5.72e-01 | 0.1038 |
| Page: 1 |
| Tissue | Expression Dynamics | Abbreviation |
| Esophagus | 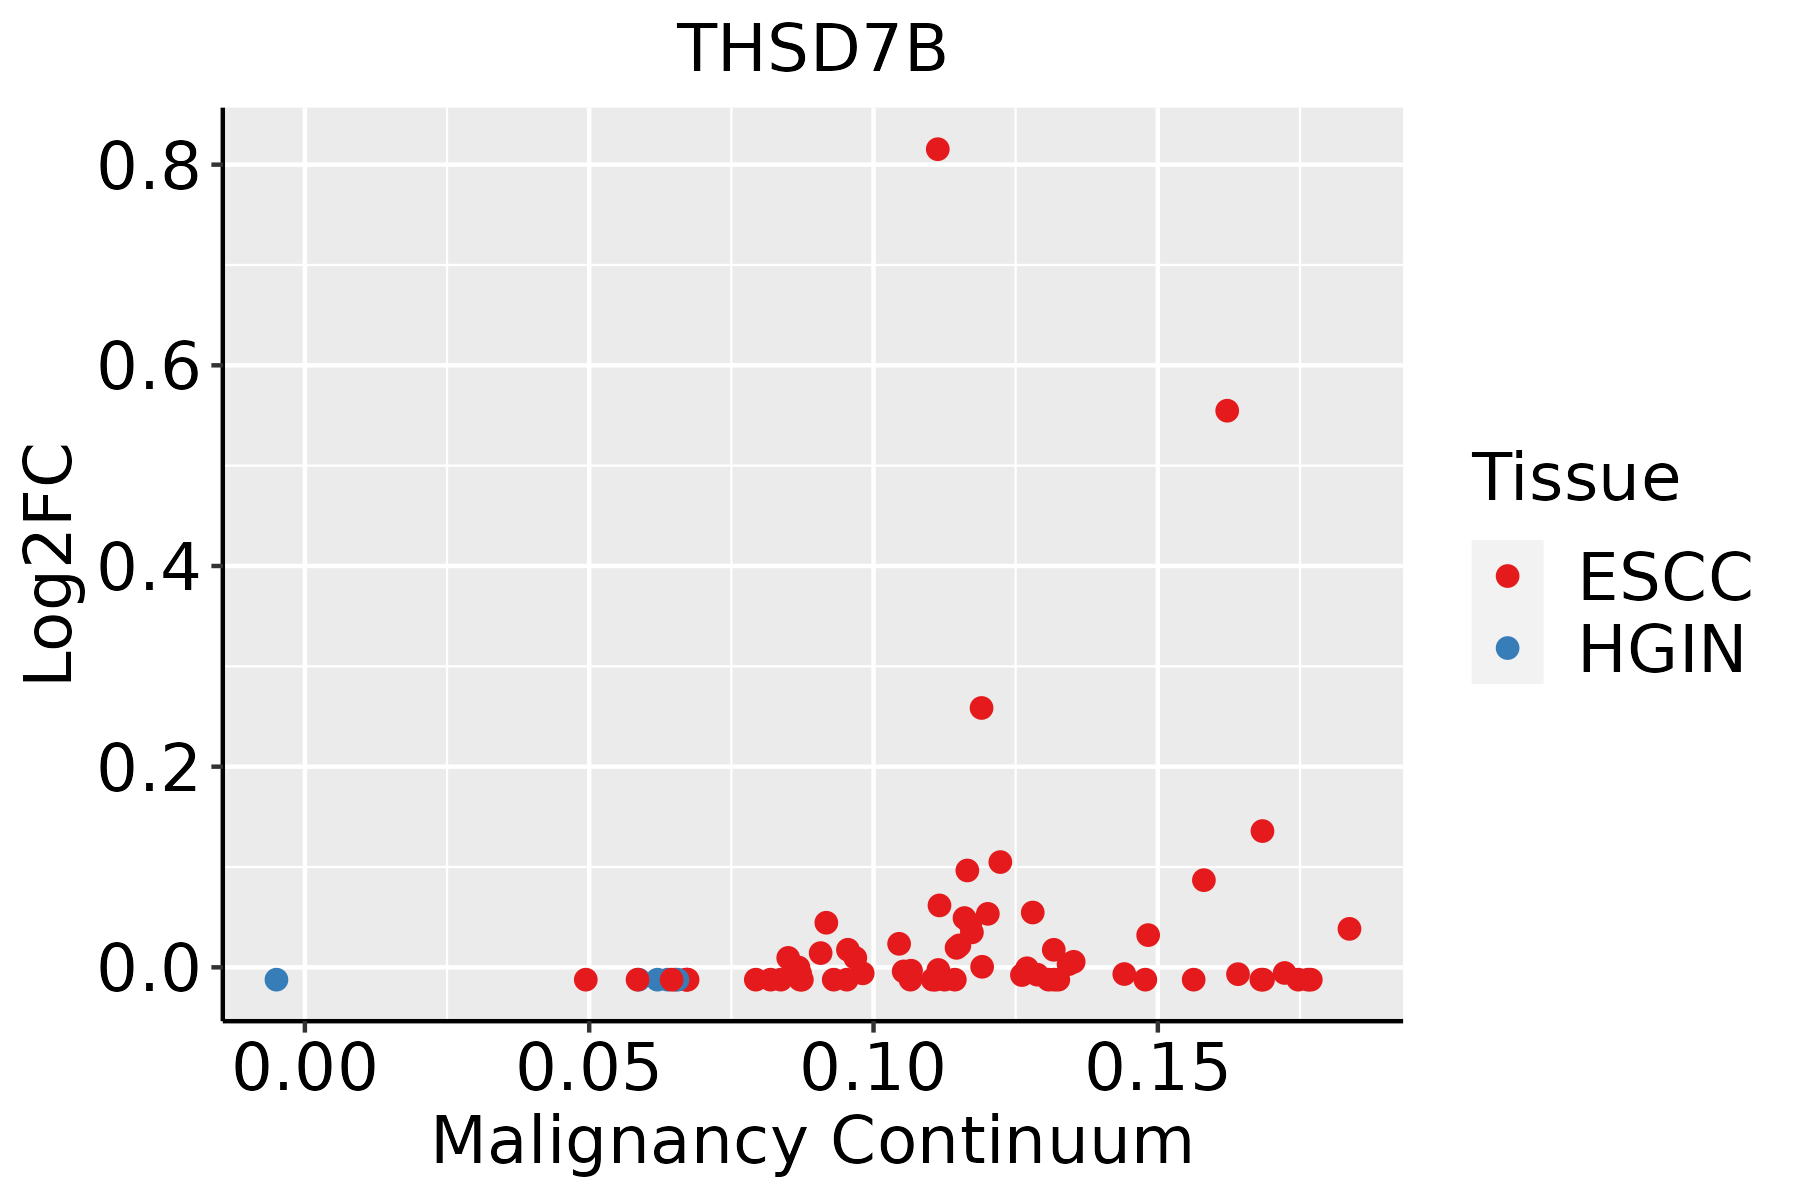 | ESCC: Esophageal squamous cell carcinoma |
| HGIN: High-grade intraepithelial neoplasias | ||
| LGIN: Low-grade intraepithelial neoplasias | ||
| Prostate |  | BPH: Benign Prostatic Hyperplasia |
| ∗log2FC in expression of this searched gene in stem-like cells from each diseased tissue sample relative to stem-like cells in normal samples in each tissue plotted against the malignancy continuum. Samples are colored based on if they are from different disease stage. |
Top |
Malignant transformation related pathway analysis |
| Find out the enriched GO biological processes and KEGG pathways involved in transition from healthy to precancer to cancer |
| Tissue | Disease Stage | Enriched GO biological Processes |
| Colorectum | AD |  |
| Colorectum | SER |  |
| Colorectum | MSS |  |
| Colorectum | MSI-H |  |
| Colorectum | FAP |  |
| ∗Top 15 enriched GO BP terms are showed in the bar plot of each disease state in each tissue. Each row represents a significant GO biological process which is colored according to the -log10(p.adjust). |
| Page: 1 2 3 4 5 6 7 8 9 |
| GO ID | Tissue | Disease Stage | Description | Gene Ratio | Bg Ratio | pvalue | p.adjust | Count |
| GO:003153218 | Esophagus | ESCC | actin cytoskeleton reorganization | 72/8552 | 107/18723 | 5.03e-06 | 5.31e-05 | 72 |
| GO:003153210 | Prostate | BPH | actin cytoskeleton reorganization | 40/3107 | 107/18723 | 1.82e-07 | 4.04e-06 | 40 |
| Page: 1 |
| Pathway ID | Tissue | Disease Stage | Description | Gene Ratio | Bg Ratio | pvalue | p.adjust | qvalue | Count |
| Page: 1 |
Top |
Cell-cell communication analysis |
| Identification of potential cell-cell interactions between two cell types and their ligand-receptor pairs for different disease states |
| Ligand | Receptor | LRpair | Pathway | Tissue | Disease Stage |
| Page: 1 |
Top |
Single-cell gene regulatory network inference analysis |
| Find out the significant the regulons (TFs) and the target genes of each regulon across cell types for different disease states |
| TF | Cell Type | Tissue | Disease Stage | Target Gene | RSS | Regulon Activity |
| ∗The dot plots of a searched regulon are shown for all cell subpopulations in each disease state of each tissue based on the regulon specific score inferred using pySCENIC and by calculating the average expression. |
| Page: 1 |
Top |
Somatic mutation of malignant transformation related genes |
| Annotation of somatic variants for genes involved in malignant transformation |
| Hugo Symbol | Variant Class | Variant Classification | dbSNP RS | HGVSc | HGVSp | HGVSp Short | SWISSPROT | BIOTYPE | SIFT | PolyPhen | Tumor Sample Barcode | Tissue | Histology | Sex | Age | Stage | Therapy Types | Drugs | Outcome |
| THSD7B | SNV | Missense_Mutation | c.928N>T | p.Asp310Tyr | p.D310Y | protein_coding | deleterious(0) | probably_damaging(0.976) | TCGA-AC-A23H-01 | Breast | breast invasive carcinoma | Female | >=65 | I/II | Unknown | Unknown | PD | ||
| THSD7B | SNV | Missense_Mutation | c.2252N>A | p.Arg751Lys | p.R751K | protein_coding | tolerated(0.38) | benign(0.007) | TCGA-AN-A0FJ-01 | Breast | breast invasive carcinoma | Female | <65 | III/IV | Unknown | Unknown | SD | ||
| THSD7B | SNV | Missense_Mutation | c.2799C>A | p.Asn933Lys | p.N933K | protein_coding | deleterious(0.03) | probably_damaging(0.971) | TCGA-AR-A0U2-01 | Breast | breast invasive carcinoma | Female | <65 | III/IV | Hormone Therapy | tamoxiphen | PD | ||
| THSD7B | SNV | Missense_Mutation | c.1865N>T | p.Ser622Leu | p.S622L | protein_coding | deleterious(0.01) | benign(0.314) | TCGA-AR-A2LH-01 | Breast | breast invasive carcinoma | Female | <65 | III/IV | Chemotherapy | adriamycin | PD | ||
| THSD7B | SNV | Missense_Mutation | novel | c.4739N>A | p.Cys1580Tyr | p.C1580Y | protein_coding | deleterious(0) | probably_damaging(0.999) | TCGA-AR-A5QM-01 | Breast | breast invasive carcinoma | Female | <65 | I/II | Hormone Therapy | anastrozole | PD | |
| THSD7B | SNV | Missense_Mutation | c.4730N>G | p.Tyr1577Cys | p.Y1577C | protein_coding | deleterious(0) | probably_damaging(0.982) | TCGA-BH-A0DE-01 | Breast | breast invasive carcinoma | Female | <65 | I/II | Unknown | Unknown | SD | ||
| THSD7B | SNV | Missense_Mutation | rs371759413 | c.4330N>A | p.Glu1444Lys | p.E1444K | protein_coding | tolerated(0.45) | benign(0.327) | TCGA-D8-A1J8-01 | Breast | breast invasive carcinoma | Female | >=65 | I/II | Hormone Therapy | nolvadex | SD | |
| THSD7B | SNV | Missense_Mutation | c.1012N>A | p.Glu338Lys | p.E338K | protein_coding | tolerated(0.22) | benign(0.119) | TCGA-D8-A1J9-01 | Breast | breast invasive carcinoma | Female | <65 | I/II | Unknown | Unknown | SD | ||
| THSD7B | SNV | Missense_Mutation | c.4049N>C | p.Gly1350Ala | p.G1350A | protein_coding | tolerated(0.21) | benign(0.034) | TCGA-D8-A1JA-01 | Breast | breast invasive carcinoma | Female | <65 | III/IV | Chemotherapy | adriamycin | PD | ||
| THSD7B | SNV | Missense_Mutation | c.2197N>T | p.Pro733Ser | p.P733S | protein_coding | deleterious(0.03) | possibly_damaging(0.725) | TCGA-D8-A1JN-01 | Breast | breast invasive carcinoma | Female | >=65 | III/IV | Hormone Therapy | anastrozolum | SD |
| Page: 1 2 3 4 5 6 7 8 9 10 11 12 13 14 15 16 17 18 19 20 21 22 23 24 25 26 27 28 29 30 31 32 33 34 35 |
Top |
Related drugs of malignant transformation related genes |
| Identification of chemicals and drugs interact with genes involved in malignant transfromation |
| (DGIdb 4.0) |
| Entrez ID | Symbol | Category | Interaction Types | Drug Claim Name | Drug Name | PMIDs |
| 80731 | THSD7B | NA | ethanol | ALCOHOL | 32451486 |
| Page: 1 |

Copyright 2023-Present -The University of Texas Health Science Center at Houston |