
|
|||||
|
 | |
| |
| |
| |
| |
| |
|
Gene: THSD7A |
Gene summary for THSD7A |
| Gene information | Species | Human | Gene symbol | THSD7A | Gene ID | 221981 |
| Gene name | thrombospondin type 1 domain containing 7A | |
| Gene Alias | THSD7A | |
| Cytomap | 7p21.3 | |
| Gene Type | protein-coding | GO ID | GO:0001525 | UniProtAcc | Q9UPZ6 |
Top |
Malignant transformation analysis |
| Identification of the aberrant gene expression in precancerous and cancerous lesions by comparing the gene expression of stem-like cells in diseased tissues with normal stem cells |
| Entrez ID | Symbol | Replicates | Species | Organ | Tissue | Adj P-value | Log2FC | Malignancy |
| 221981 | THSD7A | AEH-subject1 | Human | Endometrium | AEH | 1.23e-03 | 1.95e-01 | -0.3059 |
| 221981 | THSD7A | AEH-subject2 | Human | Endometrium | AEH | 5.19e-09 | 3.90e-01 | -0.2525 |
| 221981 | THSD7A | AEH-subject3 | Human | Endometrium | AEH | 9.25e-23 | 5.88e-01 | -0.2576 |
| 221981 | THSD7A | AEH-subject4 | Human | Endometrium | AEH | 2.18e-09 | 4.48e-01 | -0.2657 |
| 221981 | THSD7A | AEH-subject5 | Human | Endometrium | AEH | 1.13e-25 | 6.52e-01 | -0.2953 |
| 221981 | THSD7A | EEC-subject1 | Human | Endometrium | EEC | 1.54e-10 | 4.00e-01 | -0.2682 |
| 221981 | THSD7A | EEC-subject2 | Human | Endometrium | EEC | 9.37e-10 | 3.81e-01 | -0.2607 |
| 221981 | THSD7A | EEC-subject4 | Human | Endometrium | EEC | 1.11e-05 | 3.14e-01 | -0.2571 |
| 221981 | THSD7A | GSM5276935 | Human | Endometrium | EEC | 4.72e-03 | 1.57e-01 | -0.123 |
| 221981 | THSD7A | GSM6177621_NYU_UCEC2_lib1_lib1 | Human | Endometrium | EEC | 1.97e-07 | 3.23e-01 | -0.1934 |
| 221981 | THSD7A | RNA-P25T1-P25T1-1 | Human | Lung | AIS | 5.88e-14 | 7.73e-01 | -0.2116 |
| 221981 | THSD7A | RNA-P25T1-P25T1-3 | Human | Lung | AIS | 1.37e-03 | 5.43e-01 | -0.2107 |
| 221981 | THSD7A | RNA-P25T1-P25T1-4 | Human | Lung | AIS | 2.17e-06 | 5.07e-01 | -0.2119 |
| 221981 | THSD7A | RNA-P6T2-P6T2-1 | Human | Lung | IAC | 1.59e-09 | 5.35e-01 | -0.0166 |
| 221981 | THSD7A | RNA-P6T2-P6T2-2 | Human | Lung | IAC | 3.29e-14 | 5.97e-01 | -0.0132 |
| 221981 | THSD7A | RNA-P6T2-P6T2-3 | Human | Lung | IAC | 2.37e-11 | 5.04e-01 | -0.013 |
| 221981 | THSD7A | RNA-P6T2-P6T2-4 | Human | Lung | IAC | 8.87e-08 | 4.70e-01 | -0.0121 |
| 221981 | THSD7A | HTA12-15-2 | Human | Pancreas | PDAC | 4.88e-04 | 5.83e-01 | 0.2315 |
| 221981 | THSD7A | HTA12-23-1 | Human | Pancreas | PDAC | 1.73e-13 | 1.14e+00 | 0.3405 |
| 221981 | THSD7A | HTA12-25-1 | Human | Pancreas | PDAC | 4.35e-08 | 7.27e-01 | 0.313 |
| Page: 1 2 |
| Tissue | Expression Dynamics | Abbreviation |
| Endometrium |  | AEH: Atypical endometrial hyperplasia |
| EEC: Endometrioid Cancer | ||
| Lung | 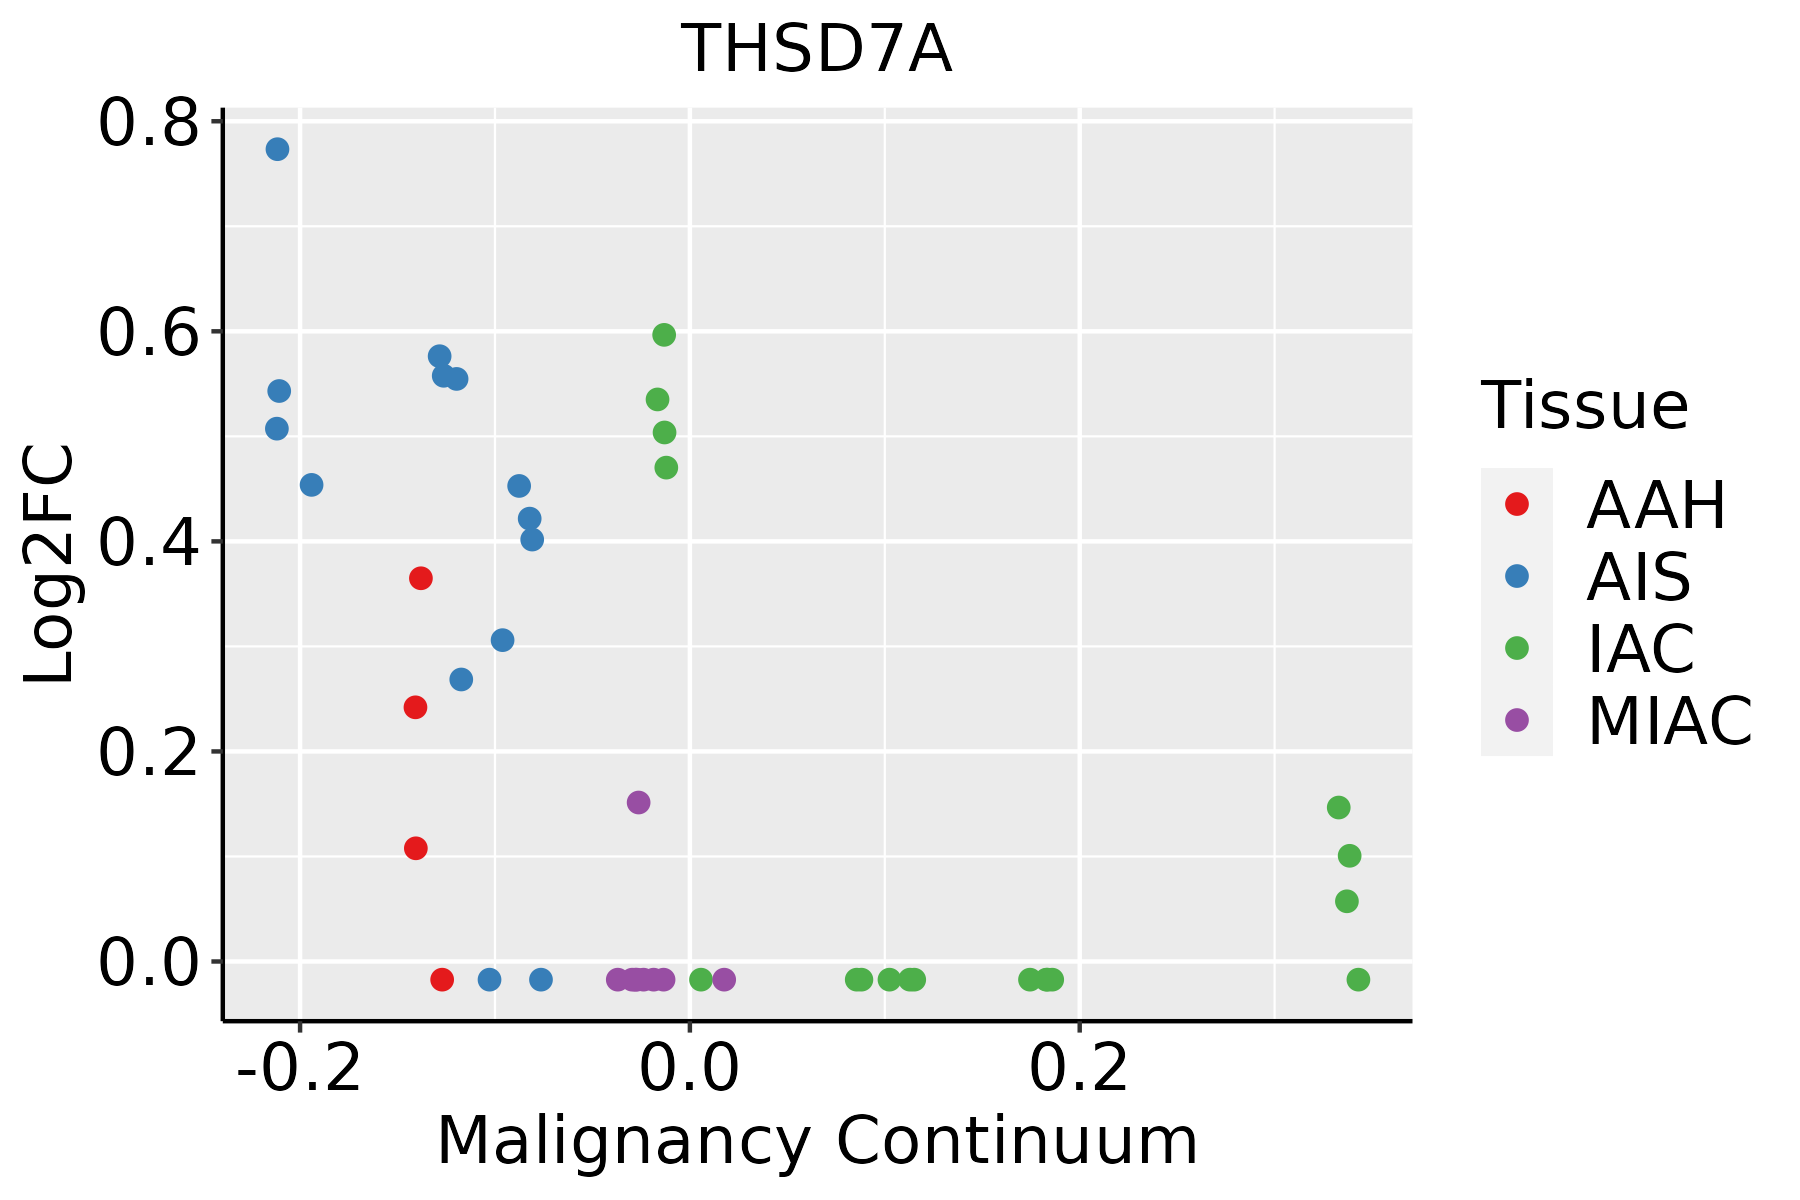 | AAH: Atypical adenomatous hyperplasia |
| AIS: Adenocarcinoma in situ | ||
| IAC: Invasive lung adenocarcinoma | ||
| MIA: Minimally invasive adenocarcinoma |
| ∗log2FC in expression of this searched gene in stem-like cells from each diseased tissue sample relative to stem-like cells in normal samples in each tissue plotted against the malignancy continuum. Samples are colored based on if they are from different disease stage. |
Top |
Malignant transformation related pathway analysis |
| Find out the enriched GO biological processes and KEGG pathways involved in transition from healthy to precancer to cancer |
| Tissue | Disease Stage | Enriched GO biological Processes |
| Colorectum | AD |  |
| Colorectum | SER |  |
| Colorectum | MSS |  |
| Colorectum | MSI-H |  |
| Colorectum | FAP |  |
| ∗Top 15 enriched GO BP terms are showed in the bar plot of each disease state in each tissue. Each row represents a significant GO biological process which is colored according to the -log10(p.adjust). |
| Page: 1 2 3 4 5 6 7 8 9 |
| GO ID | Tissue | Disease Stage | Description | Gene Ratio | Bg Ratio | pvalue | p.adjust | Count |
| GO:00315329 | Endometrium | AEH | actin cytoskeleton reorganization | 32/2100 | 107/18723 | 1.24e-07 | 5.80e-06 | 32 |
| GO:003153214 | Endometrium | EEC | actin cytoskeleton reorganization | 33/2168 | 107/18723 | 7.46e-08 | 3.89e-06 | 33 |
| GO:00315327 | Lung | IAC | actin cytoskeleton reorganization | 35/2061 | 107/18723 | 1.44e-09 | 2.38e-07 | 35 |
| GO:003153213 | Lung | AIS | actin cytoskeleton reorganization | 31/1849 | 107/18723 | 2.36e-08 | 3.12e-06 | 31 |
| Page: 1 |
| Pathway ID | Tissue | Disease Stage | Description | Gene Ratio | Bg Ratio | pvalue | p.adjust | qvalue | Count |
| Page: 1 |
Top |
Cell-cell communication analysis |
| Identification of potential cell-cell interactions between two cell types and their ligand-receptor pairs for different disease states |
| Ligand | Receptor | LRpair | Pathway | Tissue | Disease Stage |
| Page: 1 |
Top |
Single-cell gene regulatory network inference analysis |
| Find out the significant the regulons (TFs) and the target genes of each regulon across cell types for different disease states |
| TF | Cell Type | Tissue | Disease Stage | Target Gene | RSS | Regulon Activity |
| ∗The dot plots of a searched regulon are shown for all cell subpopulations in each disease state of each tissue based on the regulon specific score inferred using pySCENIC and by calculating the average expression. |
| Page: 1 |
Top |
Somatic mutation of malignant transformation related genes |
| Annotation of somatic variants for genes involved in malignant transformation |
| Hugo Symbol | Variant Class | Variant Classification | dbSNP RS | HGVSc | HGVSp | HGVSp Short | SWISSPROT | BIOTYPE | SIFT | PolyPhen | Tumor Sample Barcode | Tissue | Histology | Sex | Age | Stage | Therapy Types | Drugs | Outcome |
| THSD7A | SNV | Missense_Mutation | novel | c.4703G>C | p.Arg1568Thr | p.R1568T | Q9UPZ6 | protein_coding | deleterious(0) | benign(0.044) | TCGA-3C-AALI-01 | Breast | breast invasive carcinoma | Female | <65 | I/II | Unspecific | Poly E | Complete Response |
| THSD7A | SNV | Missense_Mutation | novel | c.3706G>A | p.Glu1236Lys | p.E1236K | Q9UPZ6 | protein_coding | deleterious(0.03) | benign(0.206) | TCGA-3C-AALI-01 | Breast | breast invasive carcinoma | Female | <65 | I/II | Unspecific | Poly E | Complete Response |
| THSD7A | SNV | Missense_Mutation | rs770733542 | c.3929N>A | p.Arg1310Gln | p.R1310Q | Q9UPZ6 | protein_coding | deleterious(0) | probably_damaging(0.982) | TCGA-5L-AAT1-01 | Breast | breast invasive carcinoma | Female | <65 | III/IV | Hormone Therapy | letrozol | SD |
| THSD7A | SNV | Missense_Mutation | rs757185210 | c.1631N>A | p.Arg544His | p.R544H | Q9UPZ6 | protein_coding | tolerated(0.75) | benign(0.003) | TCGA-A2-A0T4-01 | Breast | breast invasive carcinoma | Female | <65 | I/II | Hormone Therapy | femara | SD |
| THSD7A | SNV | Missense_Mutation | c.3896N>T | p.Ser1299Phe | p.S1299F | Q9UPZ6 | protein_coding | deleterious(0) | probably_damaging(0.982) | TCGA-A7-A6VV-01 | Breast | breast invasive carcinoma | Female | <65 | I/II | Chemotherapy | cyclophosphamide | CR | |
| THSD7A | SNV | Missense_Mutation | rs776111424 | c.1961N>T | p.Thr654Met | p.T654M | Q9UPZ6 | protein_coding | deleterious(0) | probably_damaging(0.932) | TCGA-A8-A076-01 | Breast | breast invasive carcinoma | Female | >=65 | I/II | Hormone Therapy | anastrozole | SD |
| THSD7A | SNV | Missense_Mutation | c.829N>A | p.Arg277Ser | p.R277S | Q9UPZ6 | protein_coding | tolerated(0.17) | benign(0.007) | TCGA-A8-A07O-01 | Breast | breast invasive carcinoma | Female | <65 | I/II | Chemotherapy | CR | ||
| THSD7A | SNV | Missense_Mutation | c.833N>C | p.Gly278Ala | p.G278A | Q9UPZ6 | protein_coding | tolerated(0.77) | benign(0) | TCGA-A8-A08J-01 | Breast | breast invasive carcinoma | Female | <65 | III/IV | Unknown | Unknown | PD | |
| THSD7A | SNV | Missense_Mutation | novel | c.808C>A | p.Gln270Lys | p.Q270K | Q9UPZ6 | protein_coding | tolerated(0.58) | benign(0.003) | TCGA-AC-A2FE-01 | Breast | breast invasive carcinoma | Female | <65 | III/IV | Chemotherapy | adriamycin | PD |
| THSD7A | SNV | Missense_Mutation | novel | c.4103C>T | p.Ser1368Phe | p.S1368F | Q9UPZ6 | protein_coding | deleterious(0.01) | probably_damaging(0.994) | TCGA-AN-A046-01 | Breast | breast invasive carcinoma | Female | >=65 | I/II | Unknown | Unknown | SD |
| Page: 1 2 3 4 5 6 7 8 9 10 11 12 13 14 15 16 17 18 19 20 21 22 23 24 25 26 27 28 29 30 31 |
Top |
Related drugs of malignant transformation related genes |
| Identification of chemicals and drugs interact with genes involved in malignant transfromation |
| (DGIdb 4.0) |
| Entrez ID | Symbol | Category | Interaction Types | Drug Claim Name | Drug Name | PMIDs |
| Page: 1 |

Copyright 2023-Present -The University of Texas Health Science Center at Houston |