| Tissue | Expression Dynamics | Abbreviation |
| Breast | 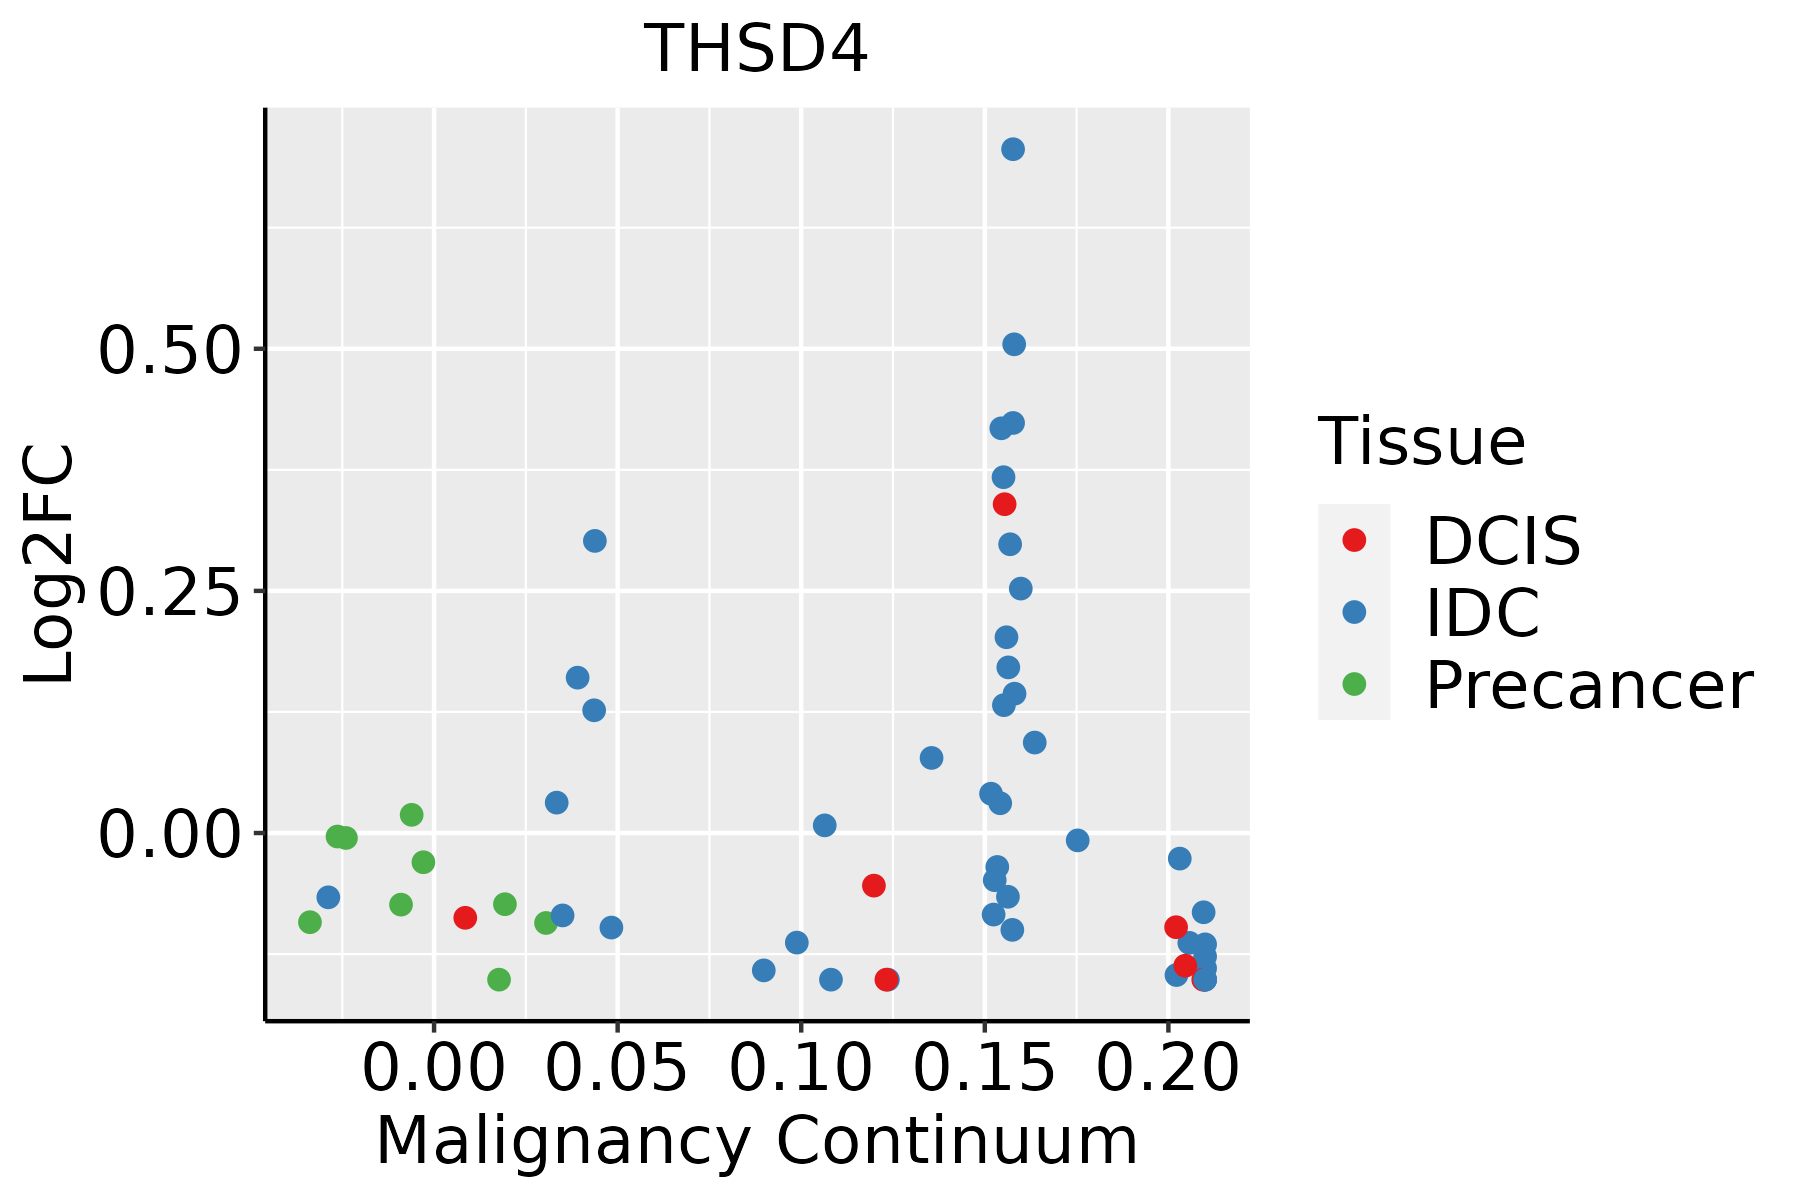 | IDC: Invasive ductal carcinoma |
| DCIS: Ductal carcinoma in situ |
| Precancer(BRCA1-mut): Precancerous lesion from BRCA1 mutation carriers |
| Cervix |  | CC: Cervix cancer |
| HSIL_HPV: HPV-infected high-grade squamous intraepithelial lesions |
| N_HPV: HPV-infected normal cervix |
| Colorectum (GSE201348) |  | FAP: Familial adenomatous polyposis |
| CRC: Colorectal cancer |
| Colorectum (HTA11) |  | AD: Adenomas |
| SER: Sessile serrated lesions |
| MSI-H: Microsatellite-high colorectal cancer |
| MSS: Microsatellite stable colorectal cancer |
| Endometrium | 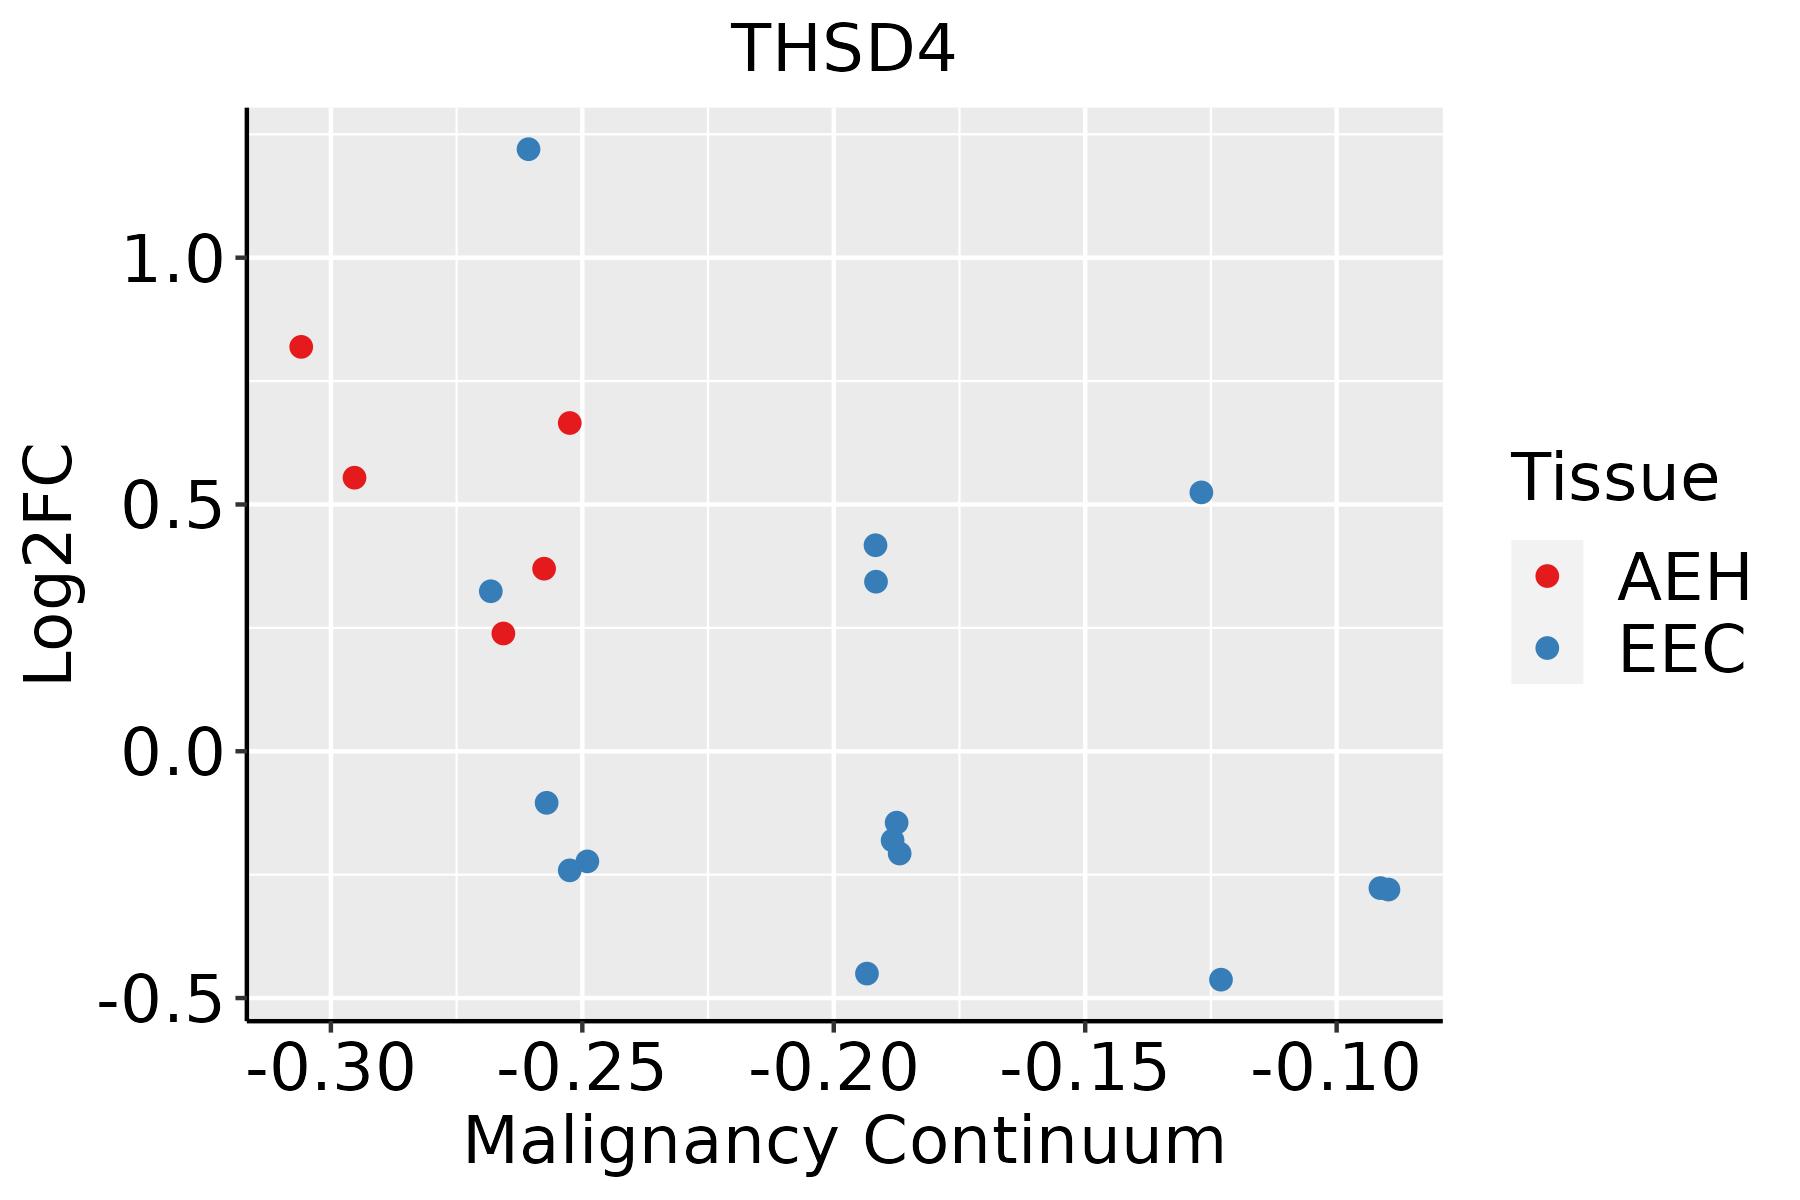 | AEH: Atypical endometrial hyperplasia |
| EEC: Endometrioid Cancer |
| Esophagus | 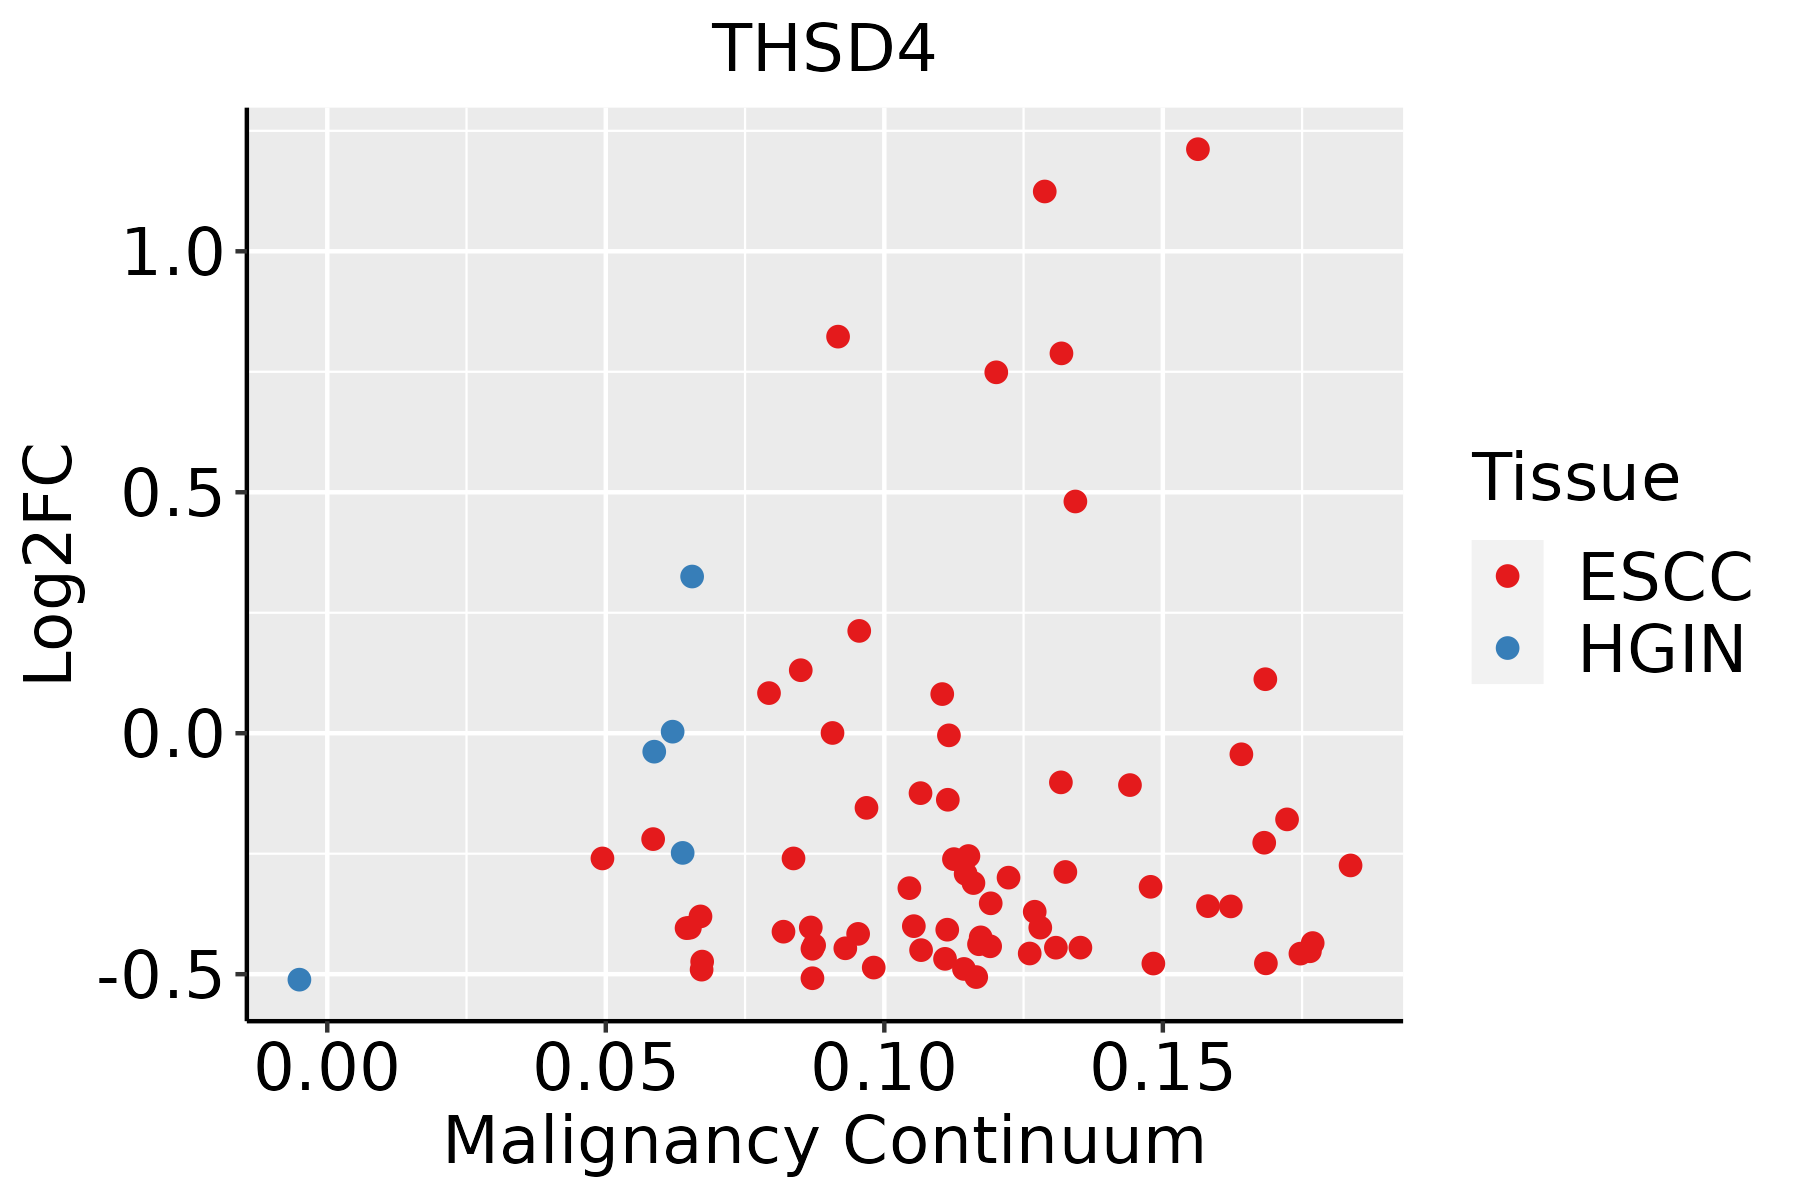 | ESCC: Esophageal squamous cell carcinoma |
| HGIN: High-grade intraepithelial neoplasias |
| LGIN: Low-grade intraepithelial neoplasias |
| Liver | 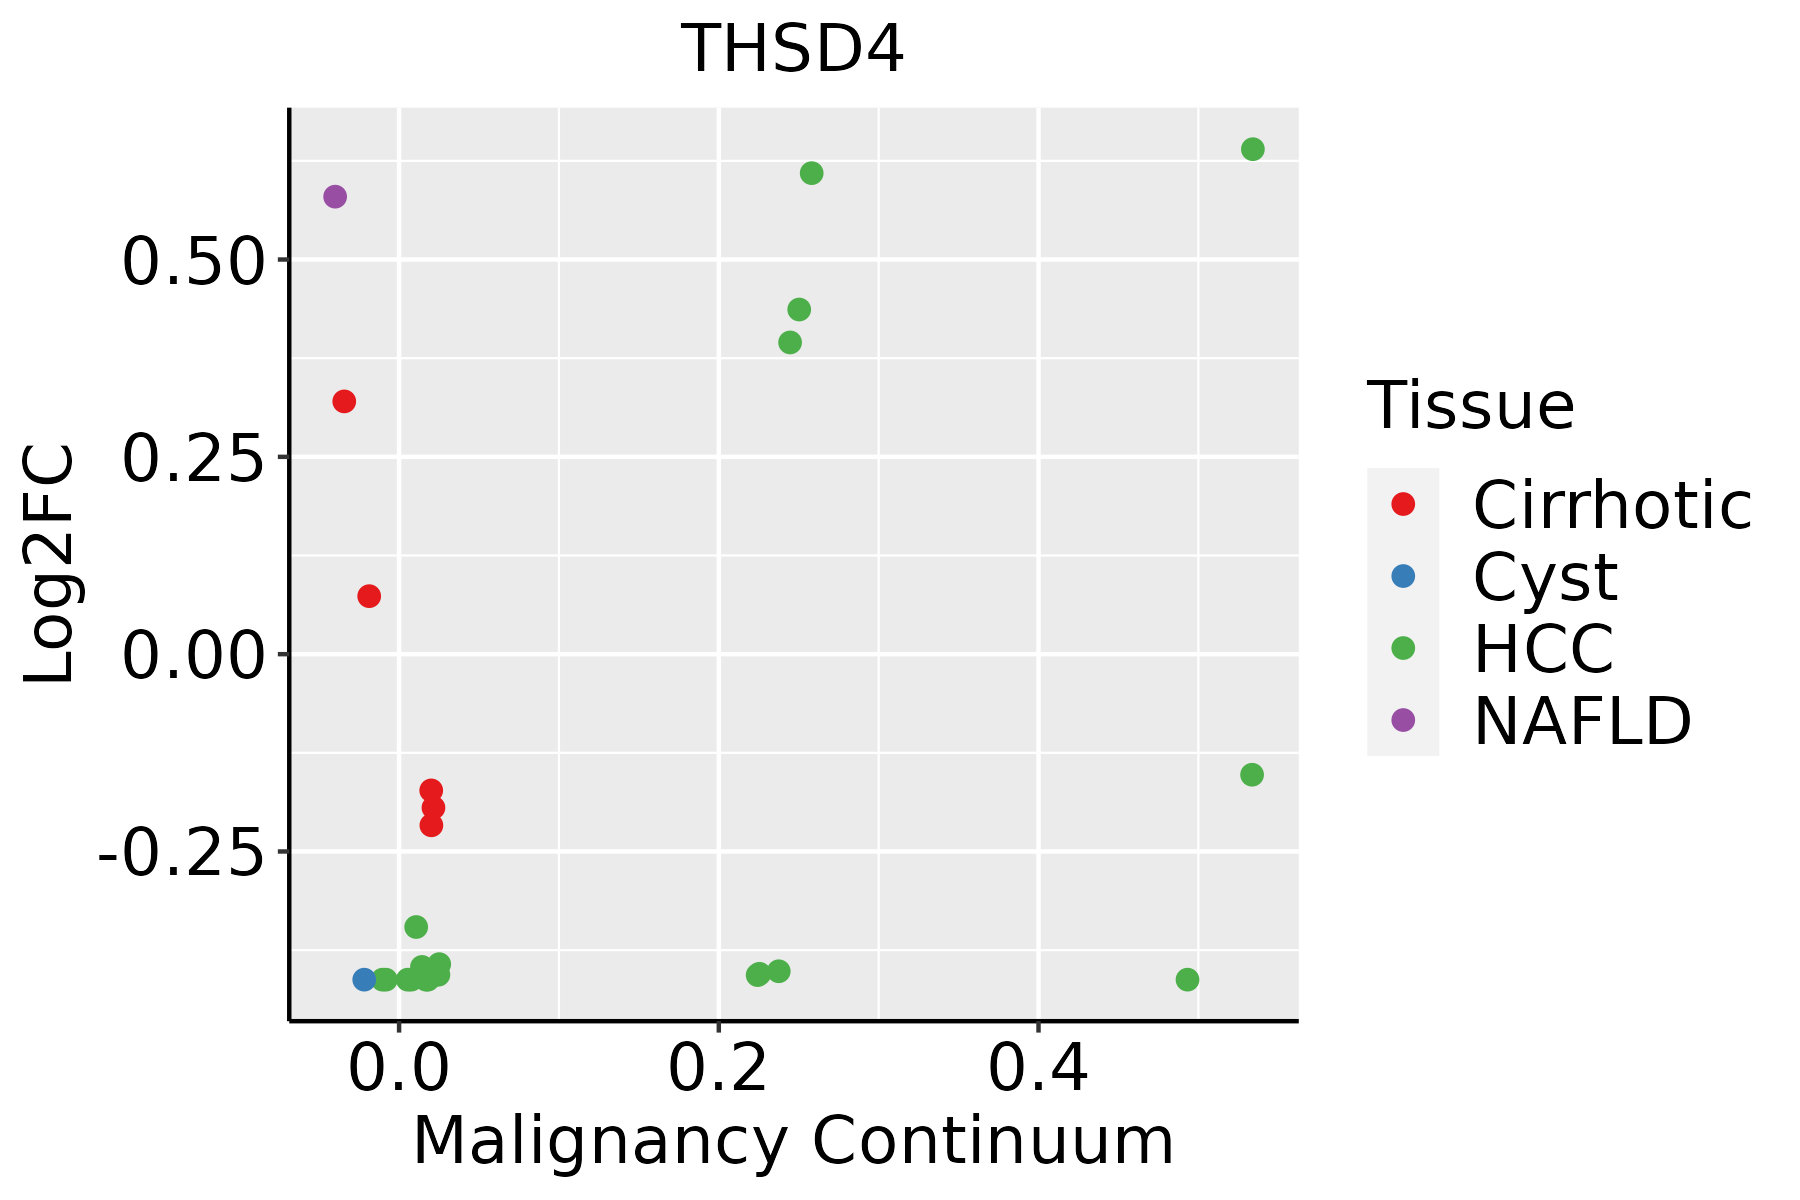 | HCC: Hepatocellular carcinoma |
| NAFLD: Non-alcoholic fatty liver disease |
| Lung |  | AAH: Atypical adenomatous hyperplasia |
| AIS: Adenocarcinoma in situ |
| IAC: Invasive lung adenocarcinoma |
| MIA: Minimally invasive adenocarcinoma |
| Oral Cavity | 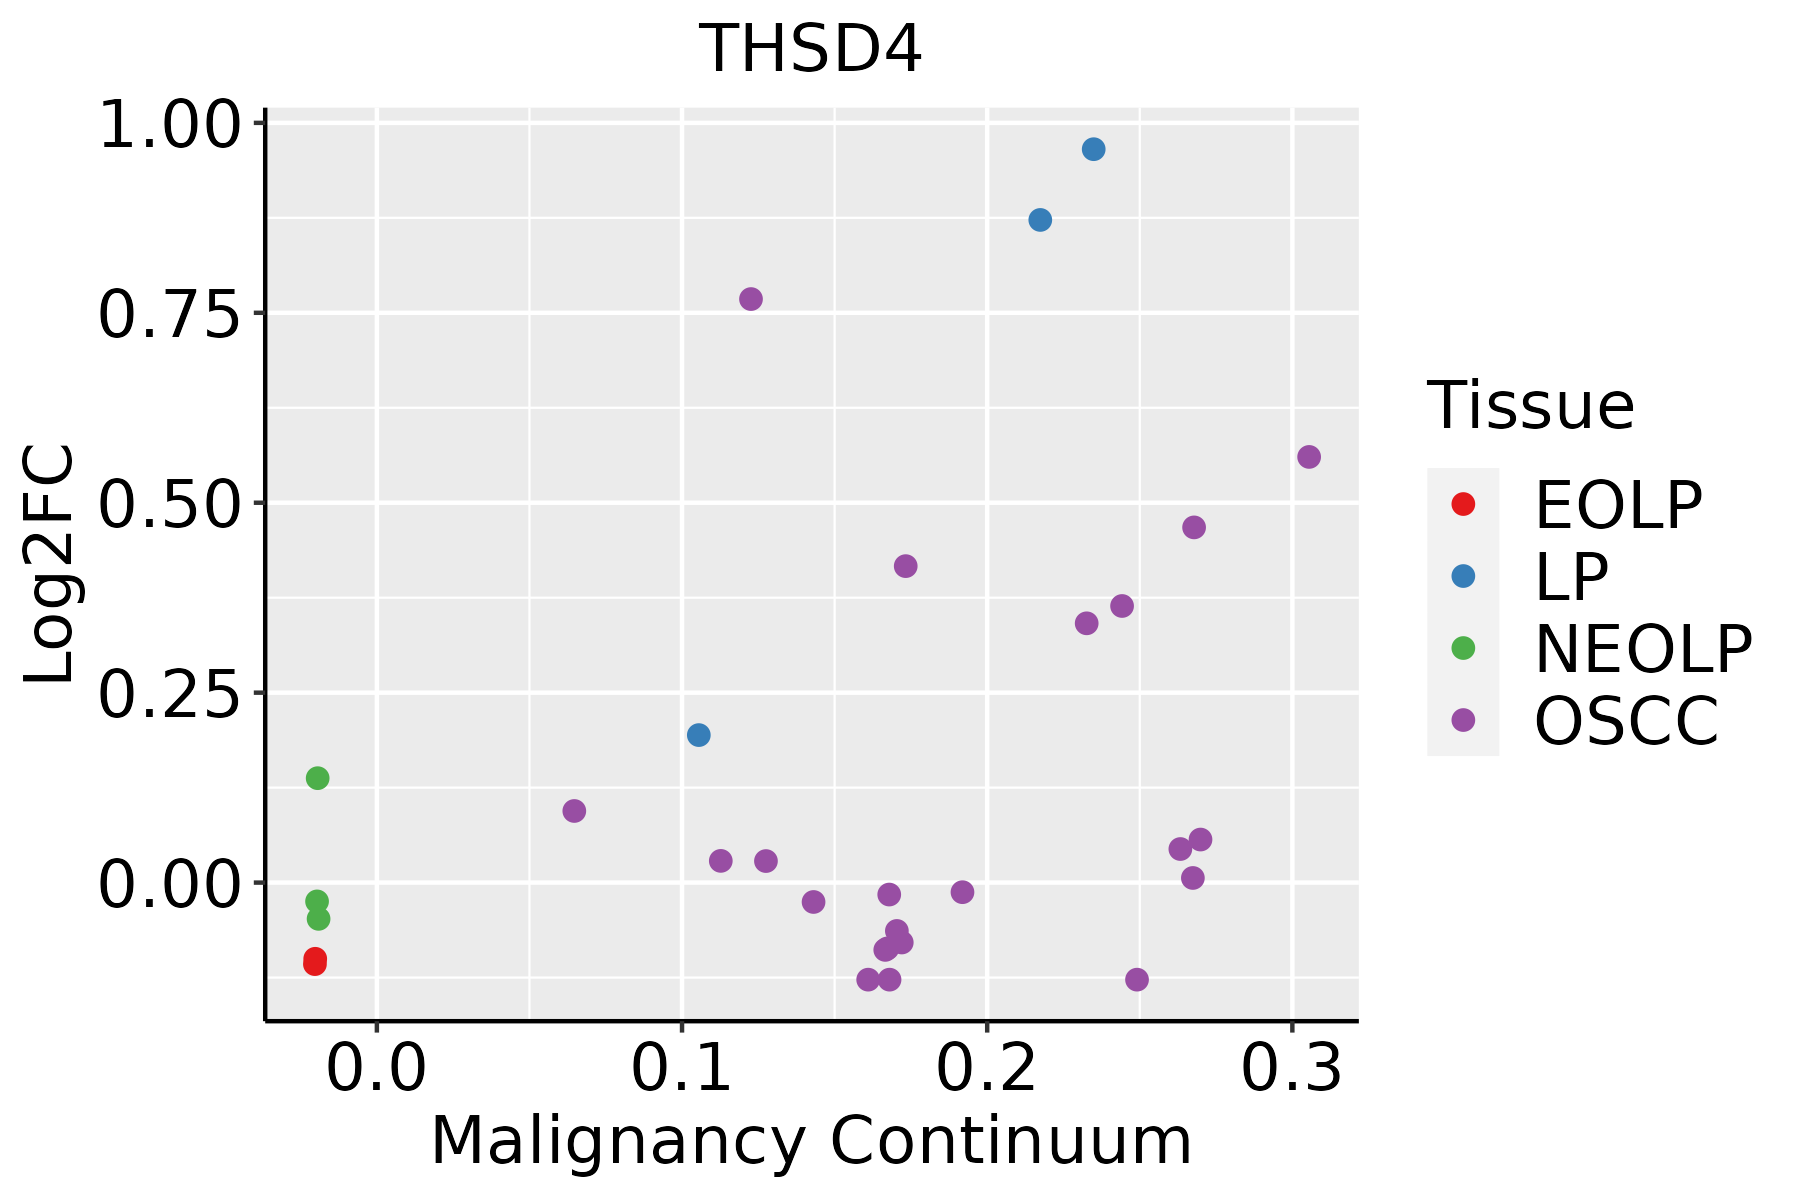 | EOLP: Erosive Oral lichen planus |
| LP: leukoplakia |
| NEOLP: Non-erosive oral lichen planus |
| OSCC: Oral squamous cell carcinoma |
| Prostate |  | BPH: Benign Prostatic Hyperplasia |
| Thyroid | 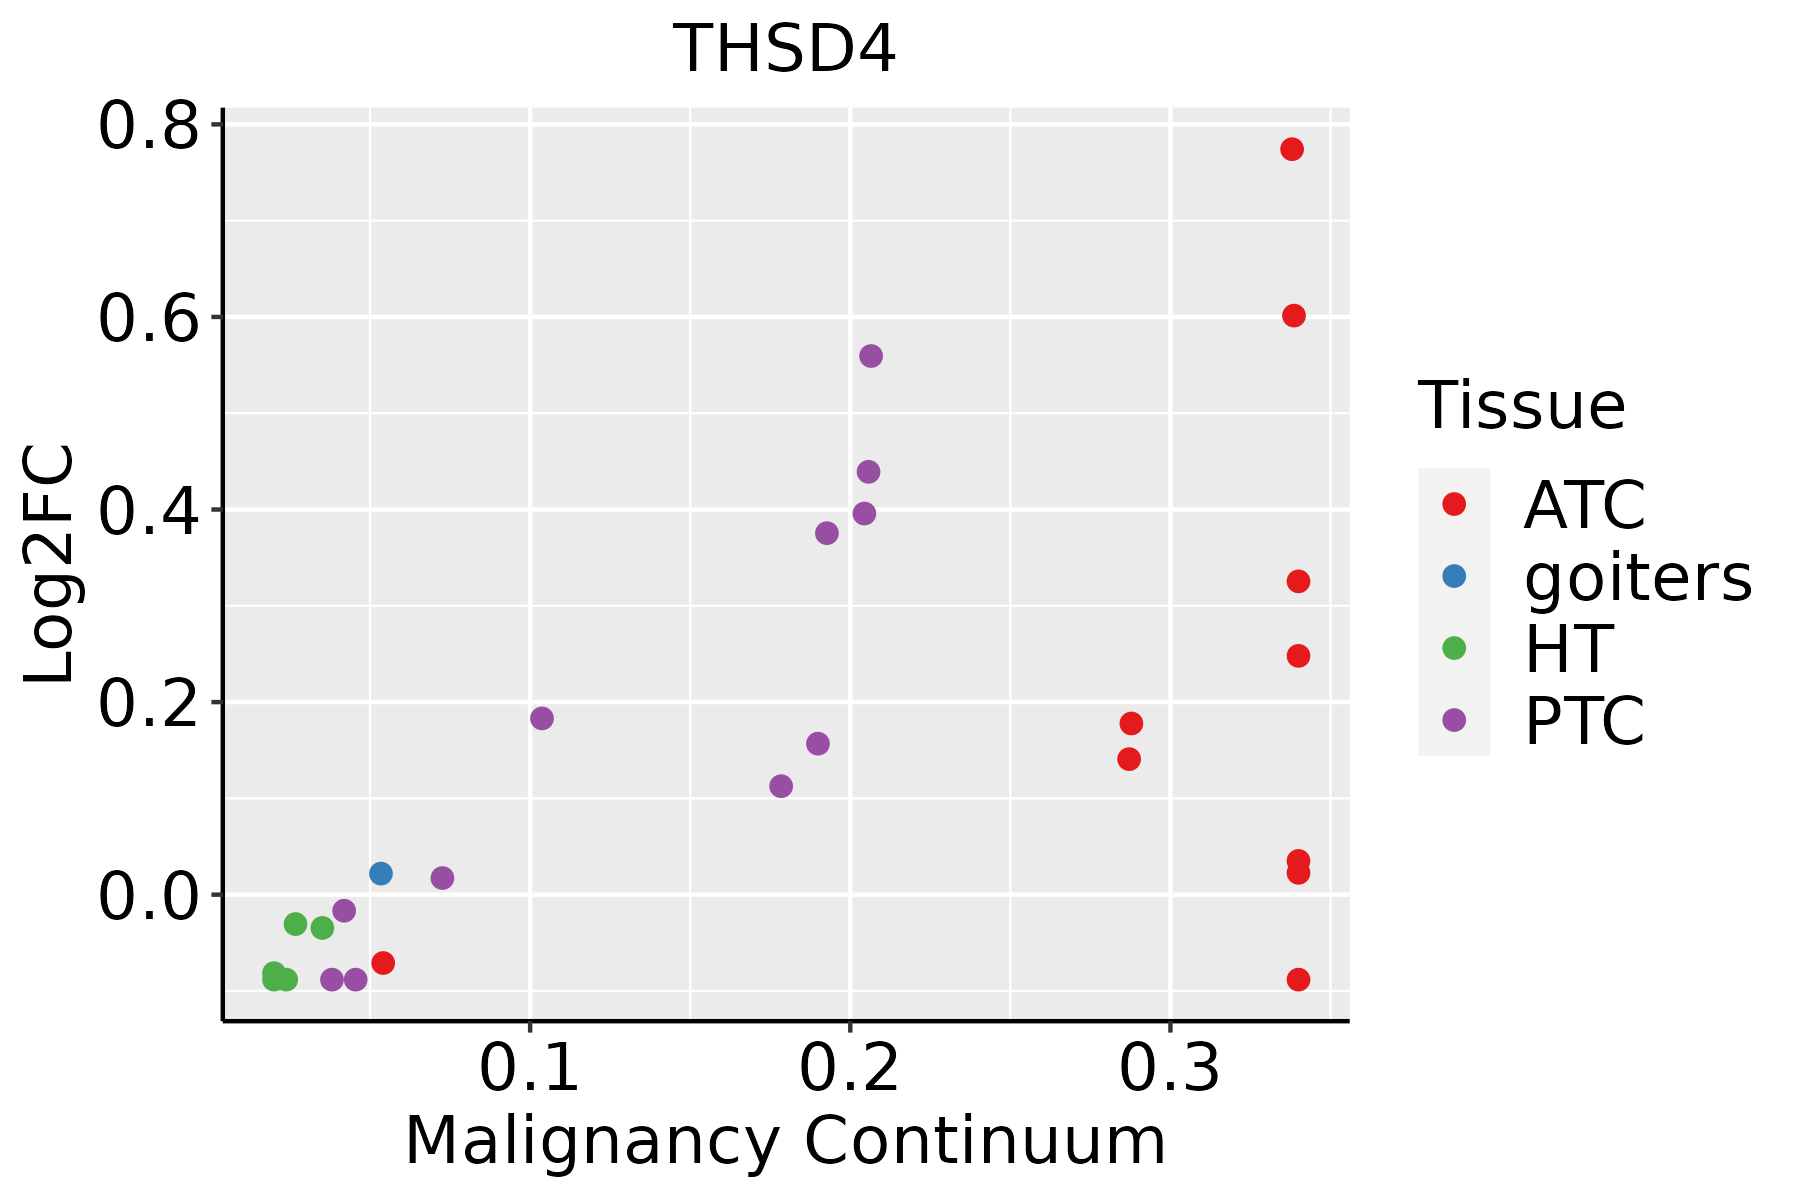 | ATC: Anaplastic thyroid cancer |
| HT: Hashimoto's thyroiditis |
| PTC: Papillary thyroid cancer |
| GO ID | Tissue | Disease Stage | Description | Gene Ratio | Bg Ratio | pvalue | p.adjust | Count |
| GO:0030198 | Cervix | CC | extracellular matrix organization | 52/2311 | 301/18723 | 7.43e-03 | 3.98e-02 | 52 |
| GO:0043062 | Cervix | CC | extracellular structure organization | 52/2311 | 302/18723 | 7.92e-03 | 4.17e-02 | 52 |
| GO:0045229 | Cervix | CC | external encapsulating structure organization | 52/2311 | 304/18723 | 9.00e-03 | 4.57e-02 | 52 |
| GO:00301984 | Esophagus | ESCC | extracellular matrix organization | 171/8552 | 301/18723 | 6.08e-05 | 4.67e-04 | 171 |
| GO:00430624 | Esophagus | ESCC | extracellular structure organization | 171/8552 | 302/18723 | 7.73e-05 | 5.76e-04 | 171 |
| GO:00452294 | Esophagus | ESCC | external encapsulating structure organization | 172/8552 | 304/18723 | 7.80e-05 | 5.80e-04 | 172 |
| GO:00850292 | Esophagus | ESCC | extracellular matrix assembly | 29/8552 | 45/18723 | 8.63e-03 | 3.04e-02 | 29 |
| GO:00301983 | Oral cavity | OSCC | extracellular matrix organization | 146/7305 | 301/18723 | 4.67e-04 | 2.77e-03 | 146 |
| GO:0085029 | Oral cavity | OSCC | extracellular matrix assembly | 29/7305 | 45/18723 | 4.85e-04 | 2.86e-03 | 29 |
| GO:00452293 | Oral cavity | OSCC | external encapsulating structure organization | 147/7305 | 304/18723 | 5.30e-04 | 3.08e-03 | 147 |
| GO:00430623 | Oral cavity | OSCC | extracellular structure organization | 146/7305 | 302/18723 | 5.59e-04 | 3.23e-03 | 146 |
| GO:0048251 | Oral cavity | OSCC | elastic fiber assembly | 8/7305 | 10/18723 | 1.03e-02 | 3.53e-02 | 8 |
| GO:00430621 | Prostate | BPH | extracellular structure organization | 67/3107 | 302/18723 | 6.67e-03 | 3.00e-02 | 67 |
| GO:00301981 | Prostate | BPH | extracellular matrix organization | 66/3107 | 301/18723 | 9.20e-03 | 3.92e-02 | 66 |
| GO:00452291 | Prostate | BPH | external encapsulating structure organization | 66/3107 | 304/18723 | 1.15e-02 | 4.66e-02 | 66 |
| GO:00301986 | Thyroid | PTC | extracellular matrix organization | 124/5968 | 301/18723 | 3.75e-04 | 2.53e-03 | 124 |
| GO:00430626 | Thyroid | PTC | extracellular structure organization | 124/5968 | 302/18723 | 4.38e-04 | 2.92e-03 | 124 |
| GO:00452296 | Thyroid | PTC | external encapsulating structure organization | 124/5968 | 304/18723 | 5.96e-04 | 3.79e-03 | 124 |
| GO:00850293 | Thyroid | PTC | extracellular matrix assembly | 23/5968 | 45/18723 | 5.62e-03 | 2.55e-02 | 23 |
| GO:003019812 | Thyroid | ATC | extracellular matrix organization | 152/6293 | 301/18723 | 8.63e-10 | 2.24e-08 | 152 |
| Pathway ID | Tissue | Disease Stage | Description | Gene Ratio | Bg Ratio | pvalue | p.adjust | qvalue | Count |
| hsa04350 | Colorectum | SER | TGF-beta signaling pathway | 31/1580 | 108/8465 | 7.00e-03 | 3.77e-02 | 2.74e-02 | 31 |
| hsa043501 | Colorectum | SER | TGF-beta signaling pathway | 31/1580 | 108/8465 | 7.00e-03 | 3.77e-02 | 2.74e-02 | 31 |
| hsa043504 | Endometrium | AEH | TGF-beta signaling pathway | 26/1197 | 108/8465 | 3.82e-03 | 2.18e-02 | 1.59e-02 | 26 |
| hsa0435011 | Endometrium | AEH | TGF-beta signaling pathway | 26/1197 | 108/8465 | 3.82e-03 | 2.18e-02 | 1.59e-02 | 26 |
| hsa043502 | Endometrium | EEC | TGF-beta signaling pathway | 26/1237 | 108/8465 | 5.95e-03 | 3.12e-02 | 2.33e-02 | 26 |
| hsa043503 | Endometrium | EEC | TGF-beta signaling pathway | 26/1237 | 108/8465 | 5.95e-03 | 3.12e-02 | 2.33e-02 | 26 |
| hsa043507 | Esophagus | ESCC | TGF-beta signaling pathway | 69/4205 | 108/8465 | 1.92e-03 | 5.54e-03 | 2.84e-03 | 69 |
| hsa0435014 | Esophagus | ESCC | TGF-beta signaling pathway | 69/4205 | 108/8465 | 1.92e-03 | 5.54e-03 | 2.84e-03 | 69 |
| hsa043506 | Oral cavity | OSCC | TGF-beta signaling pathway | 60/3704 | 108/8465 | 8.66e-03 | 1.97e-02 | 1.00e-02 | 60 |
| hsa0435013 | Oral cavity | OSCC | TGF-beta signaling pathway | 60/3704 | 108/8465 | 8.66e-03 | 1.97e-02 | 1.00e-02 | 60 |
| hsa043505 | Prostate | BPH | TGF-beta signaling pathway | 35/1718 | 108/8465 | 1.98e-03 | 7.92e-03 | 4.90e-03 | 35 |
| hsa0435012 | Prostate | BPH | TGF-beta signaling pathway | 35/1718 | 108/8465 | 1.98e-03 | 7.92e-03 | 4.90e-03 | 35 |
| hsa0435021 | Prostate | Tumor | TGF-beta signaling pathway | 39/1791 | 108/8465 | 2.33e-04 | 1.35e-03 | 8.39e-04 | 39 |
| hsa0435031 | Prostate | Tumor | TGF-beta signaling pathway | 39/1791 | 108/8465 | 2.33e-04 | 1.35e-03 | 8.39e-04 | 39 |
| Hugo Symbol | Variant Class | Variant Classification | dbSNP RS | HGVSc | HGVSp | HGVSp Short | SWISSPROT | BIOTYPE | SIFT | PolyPhen | Tumor Sample Barcode | Tissue | Histology | Sex | Age | Stage | Therapy Types | Drugs | Outcome |
| THSD4 | SNV | Missense_Mutation | novel | c.2197N>G | p.Leu733Val | p.L733V | Q6ZMP0 | protein_coding | deleterious(0.04) | probably_damaging(0.957) | TCGA-3C-AAAU-01 | Breast | breast invasive carcinoma | Female | <65 | I/II | Chemotherapy | zoladex | SD |
| THSD4 | SNV | Missense_Mutation | rs759524945 | c.2575G>T | p.Gly859Trp | p.G859W | Q6ZMP0 | protein_coding | deleterious(0) | probably_damaging(1) | TCGA-A7-A0DB-01 | Breast | breast invasive carcinoma | Female | <65 | I/II | Hormone Therapy | arimidex | SD |
| THSD4 | SNV | Missense_Mutation | novel | c.1786N>G | p.Arg596Gly | p.R596G | Q6ZMP0 | protein_coding | tolerated(0.32) | benign(0.001) | TCGA-A7-A6VY-01 | Breast | breast invasive carcinoma | Female | <65 | I/II | Chemotherapy | cyclophosphamide | CR |
| THSD4 | SNV | Missense_Mutation | novel | c.1750G>A | p.Glu584Lys | p.E584K | Q6ZMP0 | protein_coding | tolerated(0.42) | benign(0.003) | TCGA-AC-A23H-01 | Breast | breast invasive carcinoma | Female | >=65 | I/II | Unknown | Unknown | PD |
| THSD4 | SNV | Missense_Mutation | rs757005156 | c.1219G>A | p.Asp407Asn | p.D407N | Q6ZMP0 | protein_coding | tolerated(0.06) | benign(0.069) | TCGA-AC-A5XS-01 | Breast | breast invasive carcinoma | Female | >=65 | I/II | Hormone Therapy | femara | SD |
| THSD4 | SNV | Missense_Mutation | | c.2854N>T | p.Pro952Ser | p.P952S | Q6ZMP0 | protein_coding | tolerated(0.33) | benign(0.308) | TCGA-AC-A6IW-01 | Breast | breast invasive carcinoma | Female | >=65 | I/II | Unknown | Unknown | SD |
| THSD4 | SNV | Missense_Mutation | rs749243314 | c.940N>T | p.Arg314Trp | p.R314W | Q6ZMP0 | protein_coding | deleterious(0.02) | benign(0.001) | TCGA-AC-A8OQ-01 | Breast | breast invasive carcinoma | Female | >=65 | I/II | Unknown | Unknown | SD |
| THSD4 | SNV | Missense_Mutation | | c.920C>T | p.Pro307Leu | p.P307L | Q6ZMP0 | protein_coding | deleterious(0.01) | probably_damaging(0.996) | TCGA-C8-A12T-01 | Breast | breast invasive carcinoma | Female | <65 | I/II | Unknown | Unknown | SD |
| THSD4 | SNV | Missense_Mutation | novel | c.2719N>A | p.Cys907Ser | p.C907S | Q6ZMP0 | protein_coding | deleterious(0) | probably_damaging(0.998) | TCGA-OL-A5RZ-01 | Breast | breast invasive carcinoma | Female | <65 | I/II | Chemotherapy | doxorubicin | CR |
| THSD4 | insertion | Nonsense_Mutation | novel | c.1979_1980insTGCCTTTGAGCATATTTAGACCGTGTCCA | p.Ser661AlafsTer6 | p.S661Afs*6 | Q6ZMP0 | protein_coding | | | TCGA-A2-A04X-01 | Breast | breast invasive carcinoma | Female | <65 | I/II | Chemotherapy | adriamycin | SD |


