
|
|||||
|
 | |
| |
| |
| |
| |
| |
|
Gene: THSD1 |
Gene summary for THSD1 |
| Gene information | Species | Human | Gene symbol | THSD1 | Gene ID | 55901 |
| Gene name | thrombospondin type 1 domain containing 1 | |
| Gene Alias | ANIB12 | |
| Cytomap | 13q14.3 | |
| Gene Type | protein-coding | GO ID | GO:0007044 | UniProtAcc | A0A024R064 |
Top |
Malignant transformation analysis |
| Identification of the aberrant gene expression in precancerous and cancerous lesions by comparing the gene expression of stem-like cells in diseased tissues with normal stem cells |
| Entrez ID | Symbol | Replicates | Species | Organ | Tissue | Adj P-value | Log2FC | Malignancy |
| 55901 | THSD1 | P5T-E | Human | Esophagus | ESCC | 5.28e-03 | 6.07e-02 | 0.1327 |
| 55901 | THSD1 | P9T-E | Human | Esophagus | ESCC | 1.66e-02 | 1.13e-01 | 0.1131 |
| 55901 | THSD1 | P10T-E | Human | Esophagus | ESCC | 4.86e-02 | 2.44e-02 | 0.116 |
| 55901 | THSD1 | P11T-E | Human | Esophagus | ESCC | 4.27e-02 | 1.85e-01 | 0.1426 |
| 55901 | THSD1 | P21T-E | Human | Esophagus | ESCC | 1.58e-07 | 1.75e-01 | 0.1617 |
| 55901 | THSD1 | P24T-E | Human | Esophagus | ESCC | 3.67e-06 | 1.10e-01 | 0.1287 |
| 55901 | THSD1 | P30T-E | Human | Esophagus | ESCC | 1.30e-02 | 1.80e-01 | 0.137 |
| 55901 | THSD1 | P32T-E | Human | Esophagus | ESCC | 6.71e-03 | 8.85e-02 | 0.1666 |
| 55901 | THSD1 | P37T-E | Human | Esophagus | ESCC | 4.42e-06 | 1.71e-01 | 0.1371 |
| 55901 | THSD1 | P42T-E | Human | Esophagus | ESCC | 1.84e-02 | 1.29e-01 | 0.1175 |
| 55901 | THSD1 | P47T-E | Human | Esophagus | ESCC | 2.57e-03 | 1.51e-01 | 0.1067 |
| 55901 | THSD1 | P49T-E | Human | Esophagus | ESCC | 4.59e-03 | 4.40e-01 | 0.1768 |
| 55901 | THSD1 | P52T-E | Human | Esophagus | ESCC | 6.41e-03 | 9.70e-02 | 0.1555 |
| 55901 | THSD1 | P62T-E | Human | Esophagus | ESCC | 3.90e-04 | 1.64e-01 | 0.1302 |
| 55901 | THSD1 | P79T-E | Human | Esophagus | ESCC | 8.34e-06 | 1.54e-01 | 0.1154 |
| 55901 | THSD1 | P80T-E | Human | Esophagus | ESCC | 5.50e-04 | 1.64e-01 | 0.155 |
| 55901 | THSD1 | P83T-E | Human | Esophagus | ESCC | 2.21e-14 | 4.60e-01 | 0.1738 |
| 55901 | THSD1 | P89T-E | Human | Esophagus | ESCC | 1.03e-09 | 5.82e-01 | 0.1752 |
| 55901 | THSD1 | P91T-E | Human | Esophagus | ESCC | 6.54e-03 | 5.96e-01 | 0.1828 |
| 55901 | THSD1 | P107T-E | Human | Esophagus | ESCC | 2.23e-08 | 2.61e-01 | 0.171 |
| Page: 1 2 |
| Tissue | Expression Dynamics | Abbreviation |
| Esophagus | 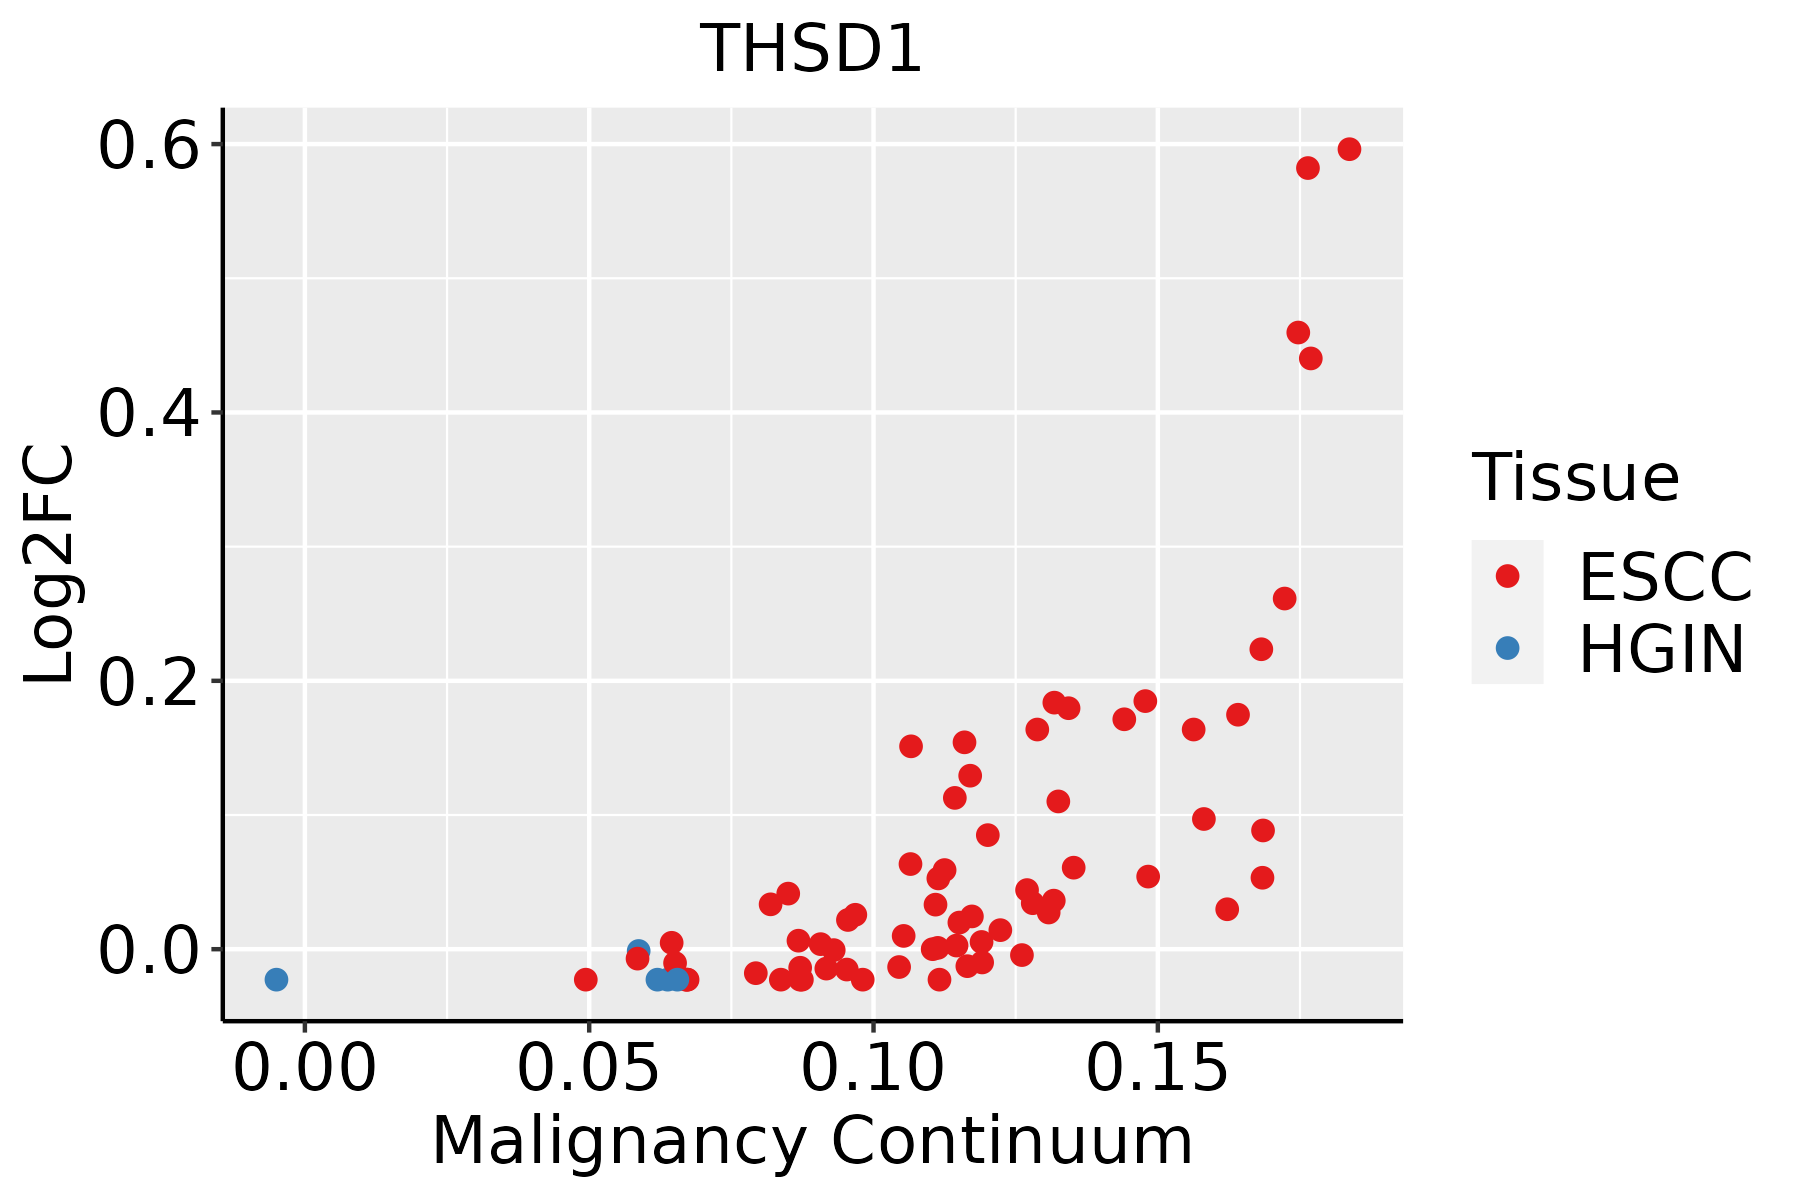 | ESCC: Esophageal squamous cell carcinoma |
| HGIN: High-grade intraepithelial neoplasias | ||
| LGIN: Low-grade intraepithelial neoplasias | ||
| Oral Cavity | 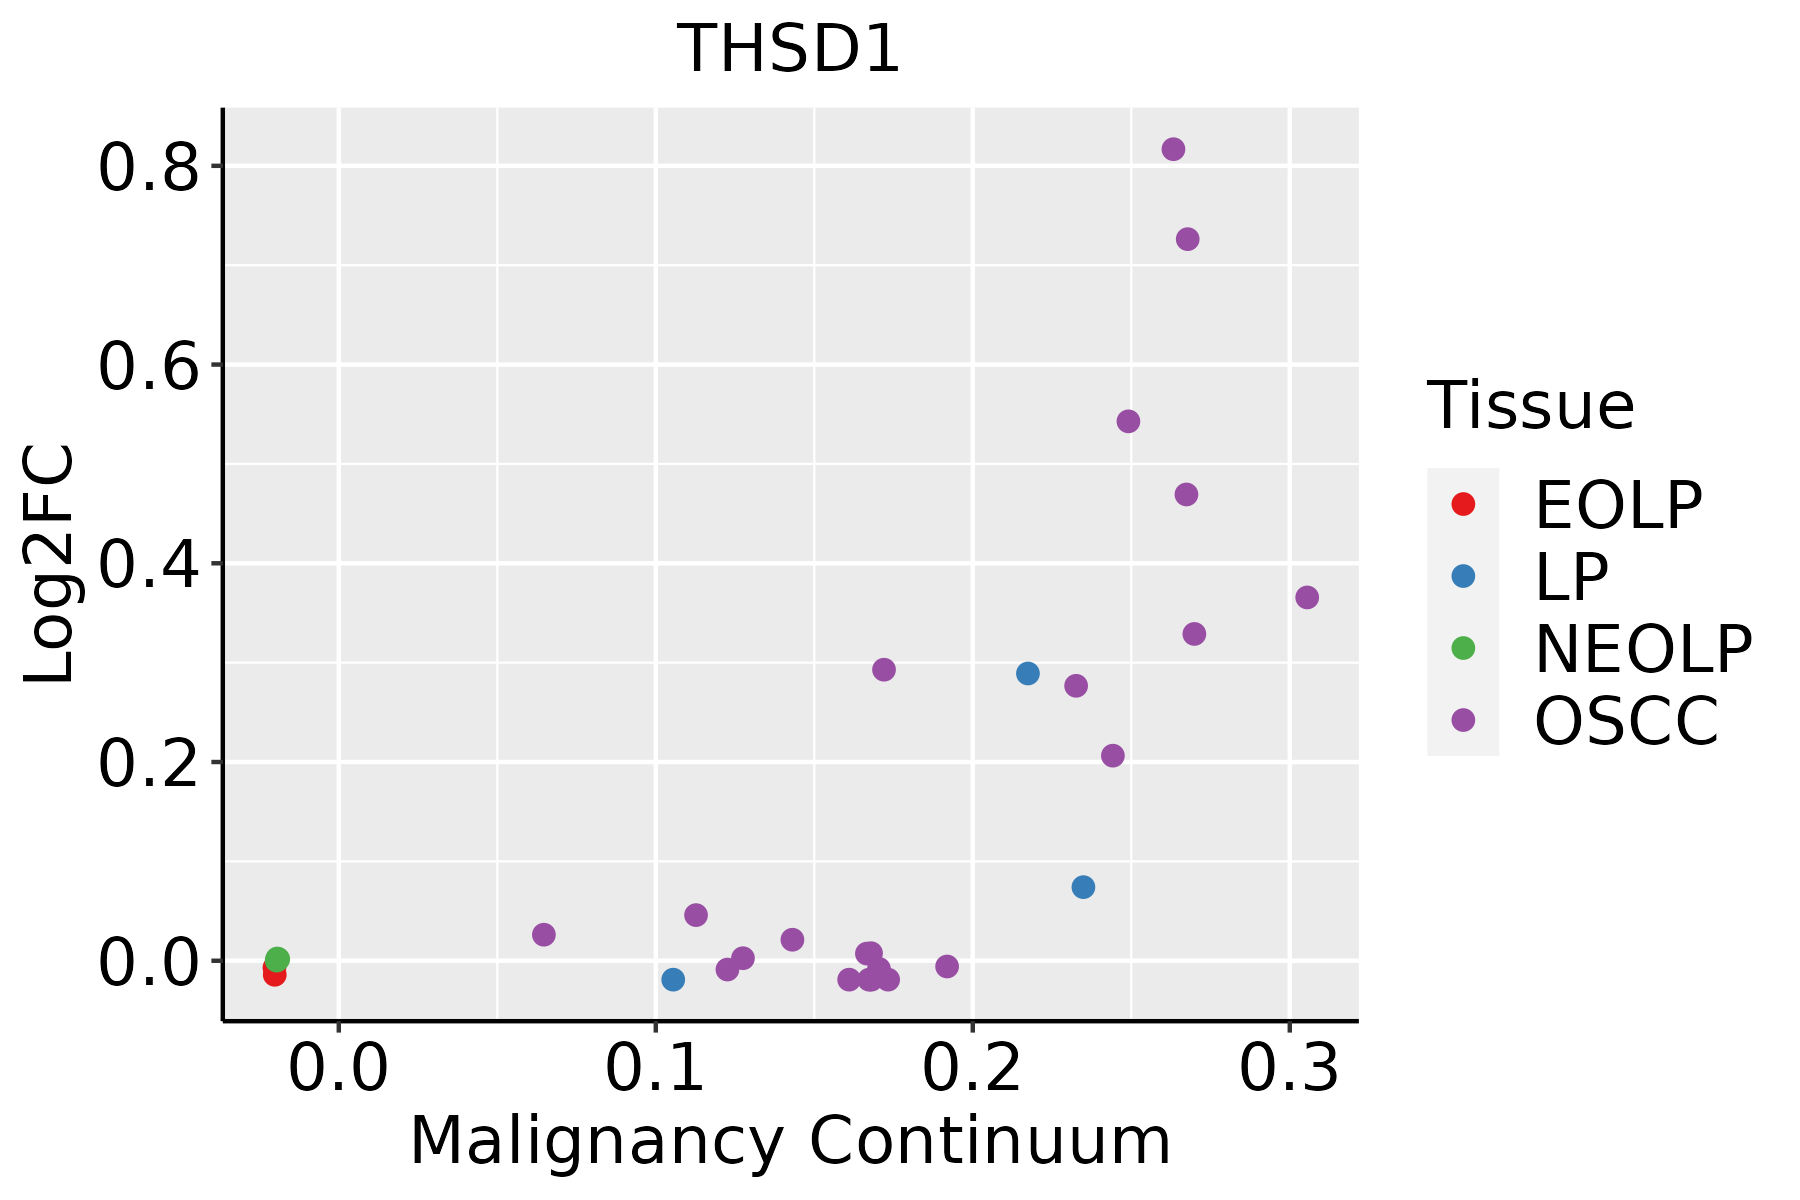 | EOLP: Erosive Oral lichen planus |
| LP: leukoplakia | ||
| NEOLP: Non-erosive oral lichen planus | ||
| OSCC: Oral squamous cell carcinoma |
| ∗log2FC in expression of this searched gene in stem-like cells from each diseased tissue sample relative to stem-like cells in normal samples in each tissue plotted against the malignancy continuum. Samples are colored based on if they are from different disease stage. |
Top |
Malignant transformation related pathway analysis |
| Find out the enriched GO biological processes and KEGG pathways involved in transition from healthy to precancer to cancer |
| Tissue | Disease Stage | Enriched GO biological Processes |
| Colorectum | AD |  |
| Colorectum | SER |  |
| Colorectum | MSS |  |
| Colorectum | MSI-H |  |
| Colorectum | FAP |  |
| ∗Top 15 enriched GO BP terms are showed in the bar plot of each disease state in each tissue. Each row represents a significant GO biological process which is colored according to the -log10(p.adjust). |
| Page: 1 2 3 4 5 6 7 8 9 |
| GO ID | Tissue | Disease Stage | Description | Gene Ratio | Bg Ratio | pvalue | p.adjust | Count |
| GO:0150115110 | Esophagus | ESCC | cell-substrate junction organization | 77/8552 | 101/18723 | 3.46e-10 | 9.57e-09 | 77 |
| GO:000704418 | Esophagus | ESCC | cell-substrate junction assembly | 73/8552 | 95/18723 | 5.27e-10 | 1.35e-08 | 73 |
| GO:003158919 | Esophagus | ESCC | cell-substrate adhesion | 221/8552 | 363/18723 | 3.06e-09 | 6.62e-08 | 221 |
| GO:004804116 | Esophagus | ESCC | focal adhesion assembly | 65/8552 | 87/18723 | 3.28e-08 | 6.08e-07 | 65 |
| GO:000716018 | Esophagus | ESCC | cell-matrix adhesion | 141/8552 | 233/18723 | 3.33e-06 | 3.71e-05 | 141 |
| GO:003432918 | Esophagus | ESCC | cell junction assembly | 227/8552 | 420/18723 | 3.06e-04 | 1.83e-03 | 227 |
| GO:000704416 | Oral cavity | OSCC | cell-substrate junction assembly | 67/7305 | 95/18723 | 4.51e-10 | 1.19e-08 | 67 |
| GO:015011517 | Oral cavity | OSCC | cell-substrate junction organization | 70/7305 | 101/18723 | 6.36e-10 | 1.63e-08 | 70 |
| GO:003158917 | Oral cavity | OSCC | cell-substrate adhesion | 193/7305 | 363/18723 | 2.48e-08 | 4.82e-07 | 193 |
| GO:004804110 | Oral cavity | OSCC | focal adhesion assembly | 59/7305 | 87/18723 | 4.86e-08 | 8.95e-07 | 59 |
| GO:000716016 | Oral cavity | OSCC | cell-matrix adhesion | 125/7305 | 233/18723 | 3.76e-06 | 4.45e-05 | 125 |
| GO:003432916 | Oral cavity | OSCC | cell junction assembly | 190/7305 | 420/18723 | 4.99e-03 | 1.96e-02 | 190 |
| Page: 1 |
| Pathway ID | Tissue | Disease Stage | Description | Gene Ratio | Bg Ratio | pvalue | p.adjust | qvalue | Count |
| Page: 1 |
Top |
Cell-cell communication analysis |
| Identification of potential cell-cell interactions between two cell types and their ligand-receptor pairs for different disease states |
| Ligand | Receptor | LRpair | Pathway | Tissue | Disease Stage |
| Page: 1 |
Top |
Single-cell gene regulatory network inference analysis |
| Find out the significant the regulons (TFs) and the target genes of each regulon across cell types for different disease states |
| TF | Cell Type | Tissue | Disease Stage | Target Gene | RSS | Regulon Activity |
| ∗The dot plots of a searched regulon are shown for all cell subpopulations in each disease state of each tissue based on the regulon specific score inferred using pySCENIC and by calculating the average expression. |
| Page: 1 |
Top |
Somatic mutation of malignant transformation related genes |
| Annotation of somatic variants for genes involved in malignant transformation |
| Hugo Symbol | Variant Class | Variant Classification | dbSNP RS | HGVSc | HGVSp | HGVSp Short | SWISSPROT | BIOTYPE | SIFT | PolyPhen | Tumor Sample Barcode | Tissue | Histology | Sex | Age | Stage | Therapy Types | Drugs | Outcome |
| THSD1 | SNV | Missense_Mutation | novel | c.1198C>A | p.Pro400Thr | p.P400T | Q9NS62 | protein_coding | tolerated(0.15) | benign(0.079) | TCGA-BH-A18I-01 | Breast | breast invasive carcinoma | Female | <65 | I/II | Chemotherapy | taxotere | CR |
| THSD1 | SNV | Missense_Mutation | c.2263N>A | p.Glu755Lys | p.E755K | Q9NS62 | protein_coding | deleterious(0) | possibly_damaging(0.867) | TCGA-GM-A2D9-01 | Breast | breast invasive carcinoma | Female | >=65 | I/II | Hormone Therapy | arimidex | SD | |
| THSD1 | SNV | Missense_Mutation | novel | c.1499G>A | p.Arg500Gln | p.R500Q | Q9NS62 | protein_coding | tolerated(0.28) | benign(0.011) | TCGA-LL-A8F5-01 | Breast | breast invasive carcinoma | Female | <65 | I/II | Chemotherapy | cyclophosphamide | SD |
| THSD1 | SNV | Missense_Mutation | novel | c.1576N>T | p.Pro526Ser | p.P526S | Q9NS62 | protein_coding | tolerated(0.07) | probably_damaging(0.999) | TCGA-OL-A5RW-01 | Breast | breast invasive carcinoma | Female | <65 | I/II | Chemotherapy | adriamycin | CR |
| THSD1 | insertion | Nonsense_Mutation | novel | c.1880_1881insCCTGGGACCAGGATGCTGATTACATG | p.Lys627AsnfsTer7 | p.K627Nfs*7 | Q9NS62 | protein_coding | TCGA-BH-A0EB-01 | Breast | breast invasive carcinoma | Female | >=65 | I/II | Hormone Therapy | arimidex | SD | ||
| THSD1 | SNV | Missense_Mutation | c.1087C>T | p.Arg363Cys | p.R363C | Q9NS62 | protein_coding | deleterious(0) | probably_damaging(1) | TCGA-2W-A8YY-01 | Cervix | cervical & endocervical cancer | Female | <65 | I/II | Chemotherapy | cisplatin | CR | |
| THSD1 | SNV | Missense_Mutation | rs373901957 | c.275N>G | p.Tyr92Cys | p.Y92C | Q9NS62 | protein_coding | tolerated(0.35) | probably_damaging(0.931) | TCGA-BI-A0VR-01 | Cervix | cervical & endocervical cancer | Female | <65 | III/IV | Unknown | Unknown | SD |
| THSD1 | SNV | Missense_Mutation | novel | c.496G>A | p.Val166Ile | p.V166I | Q9NS62 | protein_coding | tolerated(0.22) | benign(0) | TCGA-C5-A8XH-01 | Cervix | cervical & endocervical cancer | Female | <65 | I/II | Unknown | Unknown | SD |
| THSD1 | SNV | Missense_Mutation | novel | c.573N>A | p.Ser191Arg | p.S191R | Q9NS62 | protein_coding | tolerated(0.43) | benign(0.149) | TCGA-DG-A2KL-01 | Cervix | cervical & endocervical cancer | Female | <65 | I/II | Chemotherapy | cisplatin | SD |
| THSD1 | SNV | Missense_Mutation | rs763256441 | c.529G>A | p.Glu177Lys | p.E177K | Q9NS62 | protein_coding | tolerated(0.24) | benign(0.178) | TCGA-EK-A3GM-01 | Cervix | cervical & endocervical cancer | Female | >=65 | I/II | Unknown | Unknown | SD |
| Page: 1 2 3 4 5 6 7 8 9 10 11 12 13 |
Top |
Related drugs of malignant transformation related genes |
| Identification of chemicals and drugs interact with genes involved in malignant transfromation |
| (DGIdb 4.0) |
| Entrez ID | Symbol | Category | Interaction Types | Drug Claim Name | Drug Name | PMIDs |
| Page: 1 |

Copyright 2023-Present -The University of Texas Health Science Center at Houston |