
|
|||||
|
 | |
| |
| |
| |
| |
| |
|
Gene: THOC7 |
Gene summary for THOC7 |
| Gene information | Species | Human | Gene symbol | THOC7 | Gene ID | 80145 |
| Gene name | THO complex 7 | |
| Gene Alias | NIF3L1BP1 | |
| Cytomap | 3p14.1 | |
| Gene Type | protein-coding | GO ID | GO:0006139 | UniProtAcc | A0A024R341 |
Top |
Malignant transformation analysis |
| Identification of the aberrant gene expression in precancerous and cancerous lesions by comparing the gene expression of stem-like cells in diseased tissues with normal stem cells |
| Entrez ID | Symbol | Replicates | Species | Organ | Tissue | Adj P-value | Log2FC | Malignancy |
| 80145 | THOC7 | AEH-subject1 | Human | Endometrium | AEH | 8.47e-12 | -3.17e-01 | -0.3059 |
| 80145 | THOC7 | AEH-subject2 | Human | Endometrium | AEH | 3.74e-09 | -2.36e-01 | -0.2525 |
| 80145 | THOC7 | AEH-subject3 | Human | Endometrium | AEH | 6.85e-11 | -2.29e-01 | -0.2576 |
| 80145 | THOC7 | AEH-subject4 | Human | Endometrium | AEH | 2.42e-06 | -3.07e-01 | -0.2657 |
| 80145 | THOC7 | AEH-subject5 | Human | Endometrium | AEH | 7.11e-03 | -2.11e-01 | -0.2953 |
| 80145 | THOC7 | EEC-subject1 | Human | Endometrium | EEC | 1.07e-15 | -3.05e-01 | -0.2682 |
| 80145 | THOC7 | EEC-subject2 | Human | Endometrium | EEC | 9.46e-17 | -3.68e-01 | -0.2607 |
| 80145 | THOC7 | EEC-subject3 | Human | Endometrium | EEC | 1.76e-35 | -3.75e-01 | -0.2525 |
| 80145 | THOC7 | EEC-subject4 | Human | Endometrium | EEC | 2.51e-06 | -1.62e-01 | -0.2571 |
| 80145 | THOC7 | EEC-subject5 | Human | Endometrium | EEC | 3.95e-05 | -2.28e-01 | -0.249 |
| 80145 | THOC7 | GSM5276934 | Human | Endometrium | EEC | 8.21e-03 | -2.13e-01 | -0.0913 |
| 80145 | THOC7 | GSM6177620_NYU_UCEC1_lib1_lib1 | Human | Endometrium | EEC | 3.93e-23 | -3.26e-01 | -0.1869 |
| 80145 | THOC7 | GSM6177620_NYU_UCEC1_lib2_lib2 | Human | Endometrium | EEC | 2.49e-25 | -2.87e-01 | -0.1875 |
| 80145 | THOC7 | GSM6177620_NYU_UCEC1_lib3_lib3 | Human | Endometrium | EEC | 5.26e-29 | -3.13e-01 | -0.1883 |
| 80145 | THOC7 | GSM6177621_NYU_UCEC2_lib1_lib1 | Human | Endometrium | EEC | 6.86e-26 | -1.21e-01 | -0.1934 |
| 80145 | THOC7 | GSM6177622_NYU_UCEC3_lib1_lib1 | Human | Endometrium | EEC | 2.63e-39 | -1.89e-01 | -0.1917 |
| 80145 | THOC7 | GSM6177622_NYU_UCEC3_lib2_lib2 | Human | Endometrium | EEC | 7.86e-37 | -2.40e-01 | -0.1916 |
| 80145 | THOC7 | GSM6177623_NYU_UCEC3_Vis | Human | Endometrium | EEC | 3.84e-04 | -1.63e-01 | -0.1269 |
| 80145 | THOC7 | LZE2D | Human | Esophagus | HGIN | 2.84e-02 | 5.70e-01 | 0.0642 |
| 80145 | THOC7 | LZE2T | Human | Esophagus | ESCC | 1.31e-04 | 6.15e-01 | 0.082 |
| Page: 1 2 3 4 5 6 7 8 |
| Tissue | Expression Dynamics | Abbreviation |
| Endometrium | 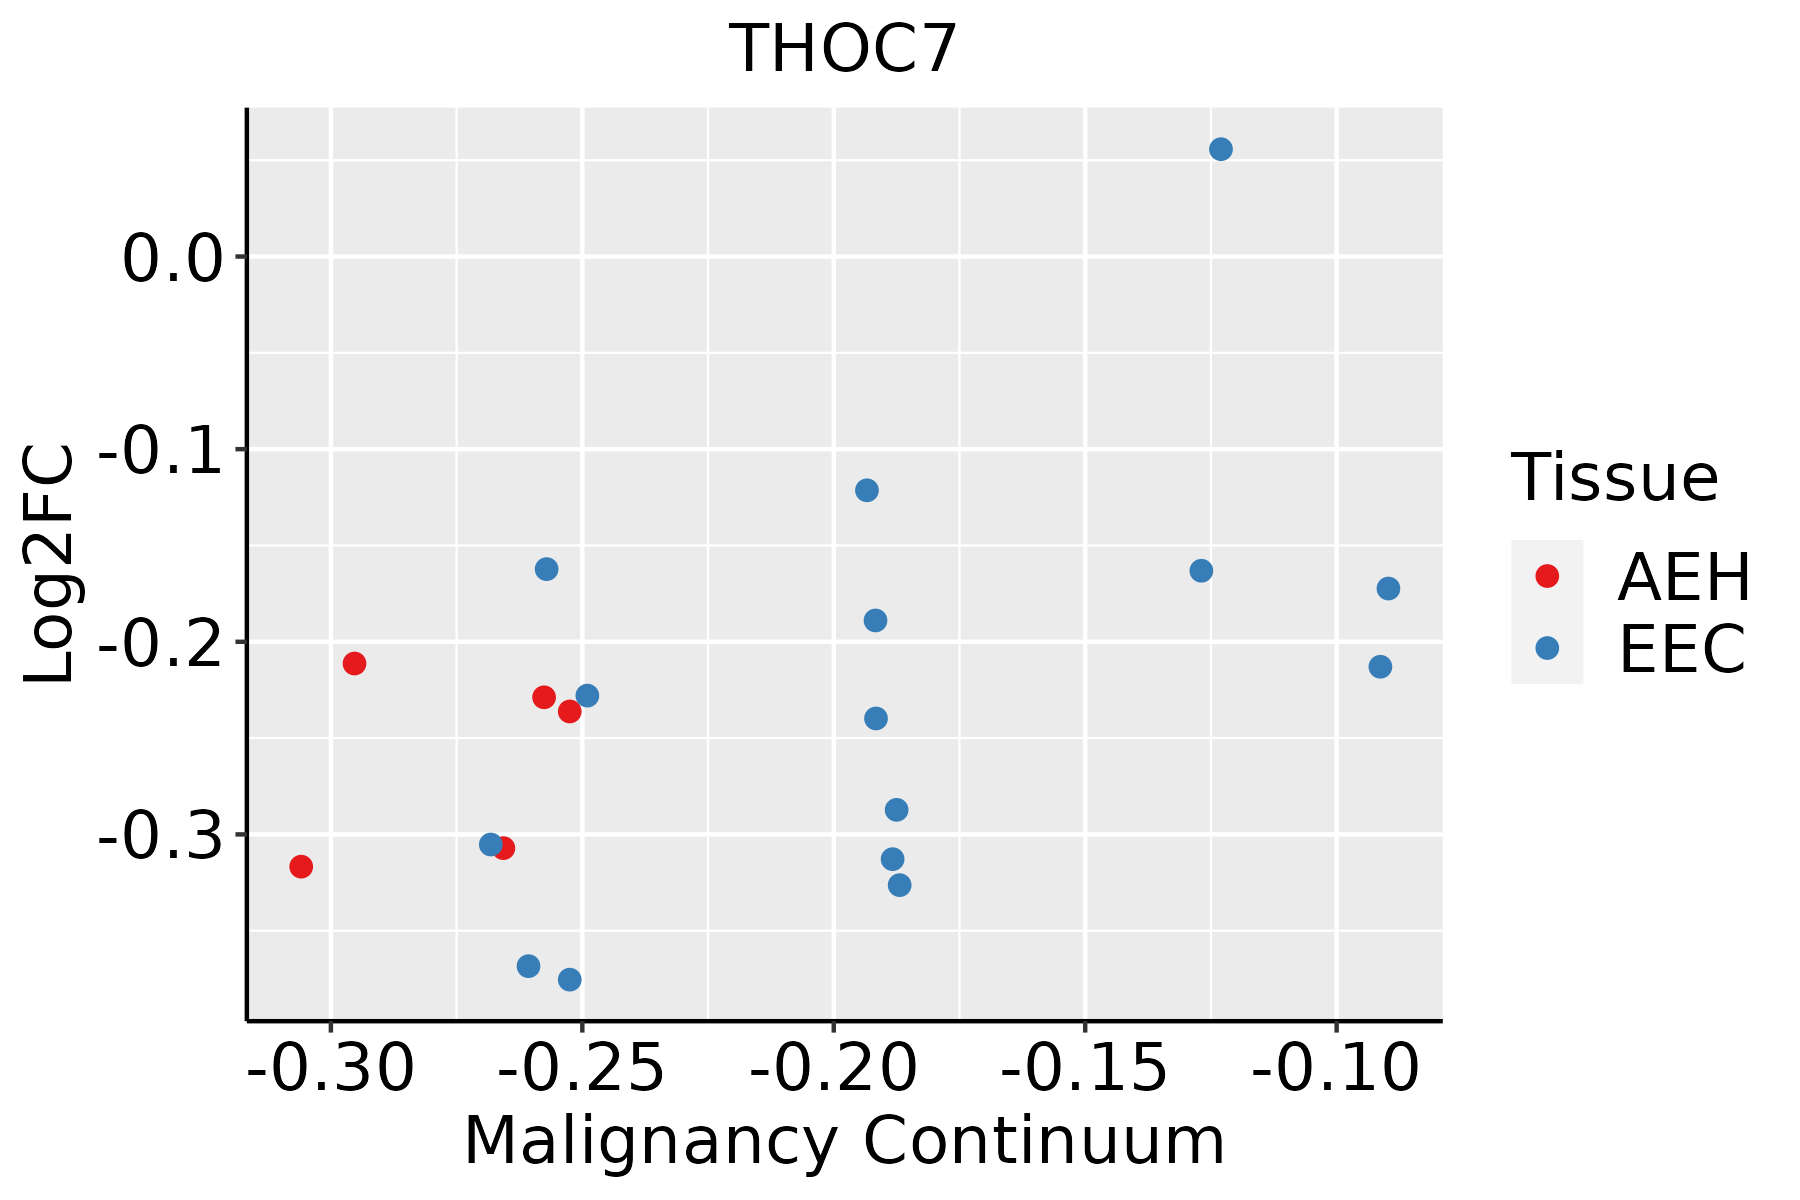 | AEH: Atypical endometrial hyperplasia |
| EEC: Endometrioid Cancer | ||
| Esophagus | 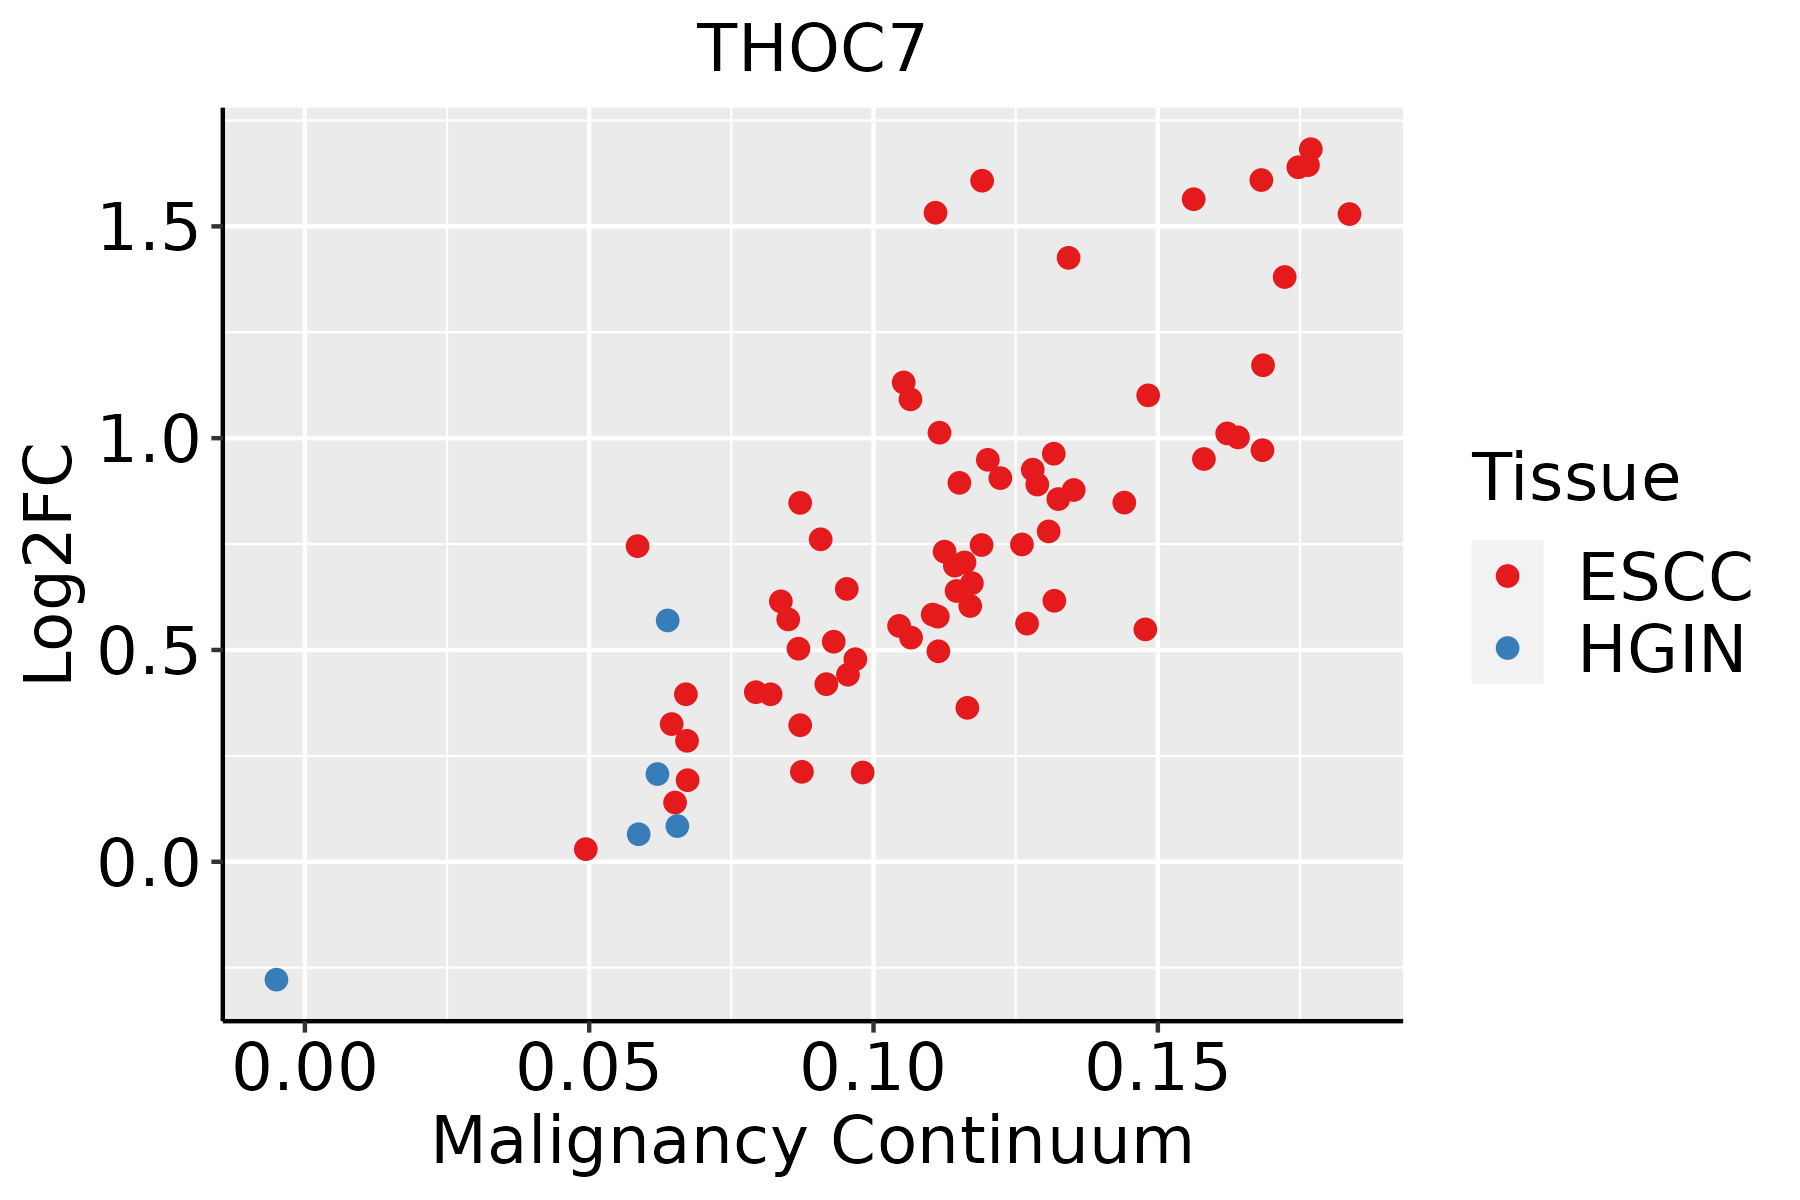 | ESCC: Esophageal squamous cell carcinoma |
| HGIN: High-grade intraepithelial neoplasias | ||
| LGIN: Low-grade intraepithelial neoplasias | ||
| Liver |  | HCC: Hepatocellular carcinoma |
| NAFLD: Non-alcoholic fatty liver disease | ||
| Oral Cavity | 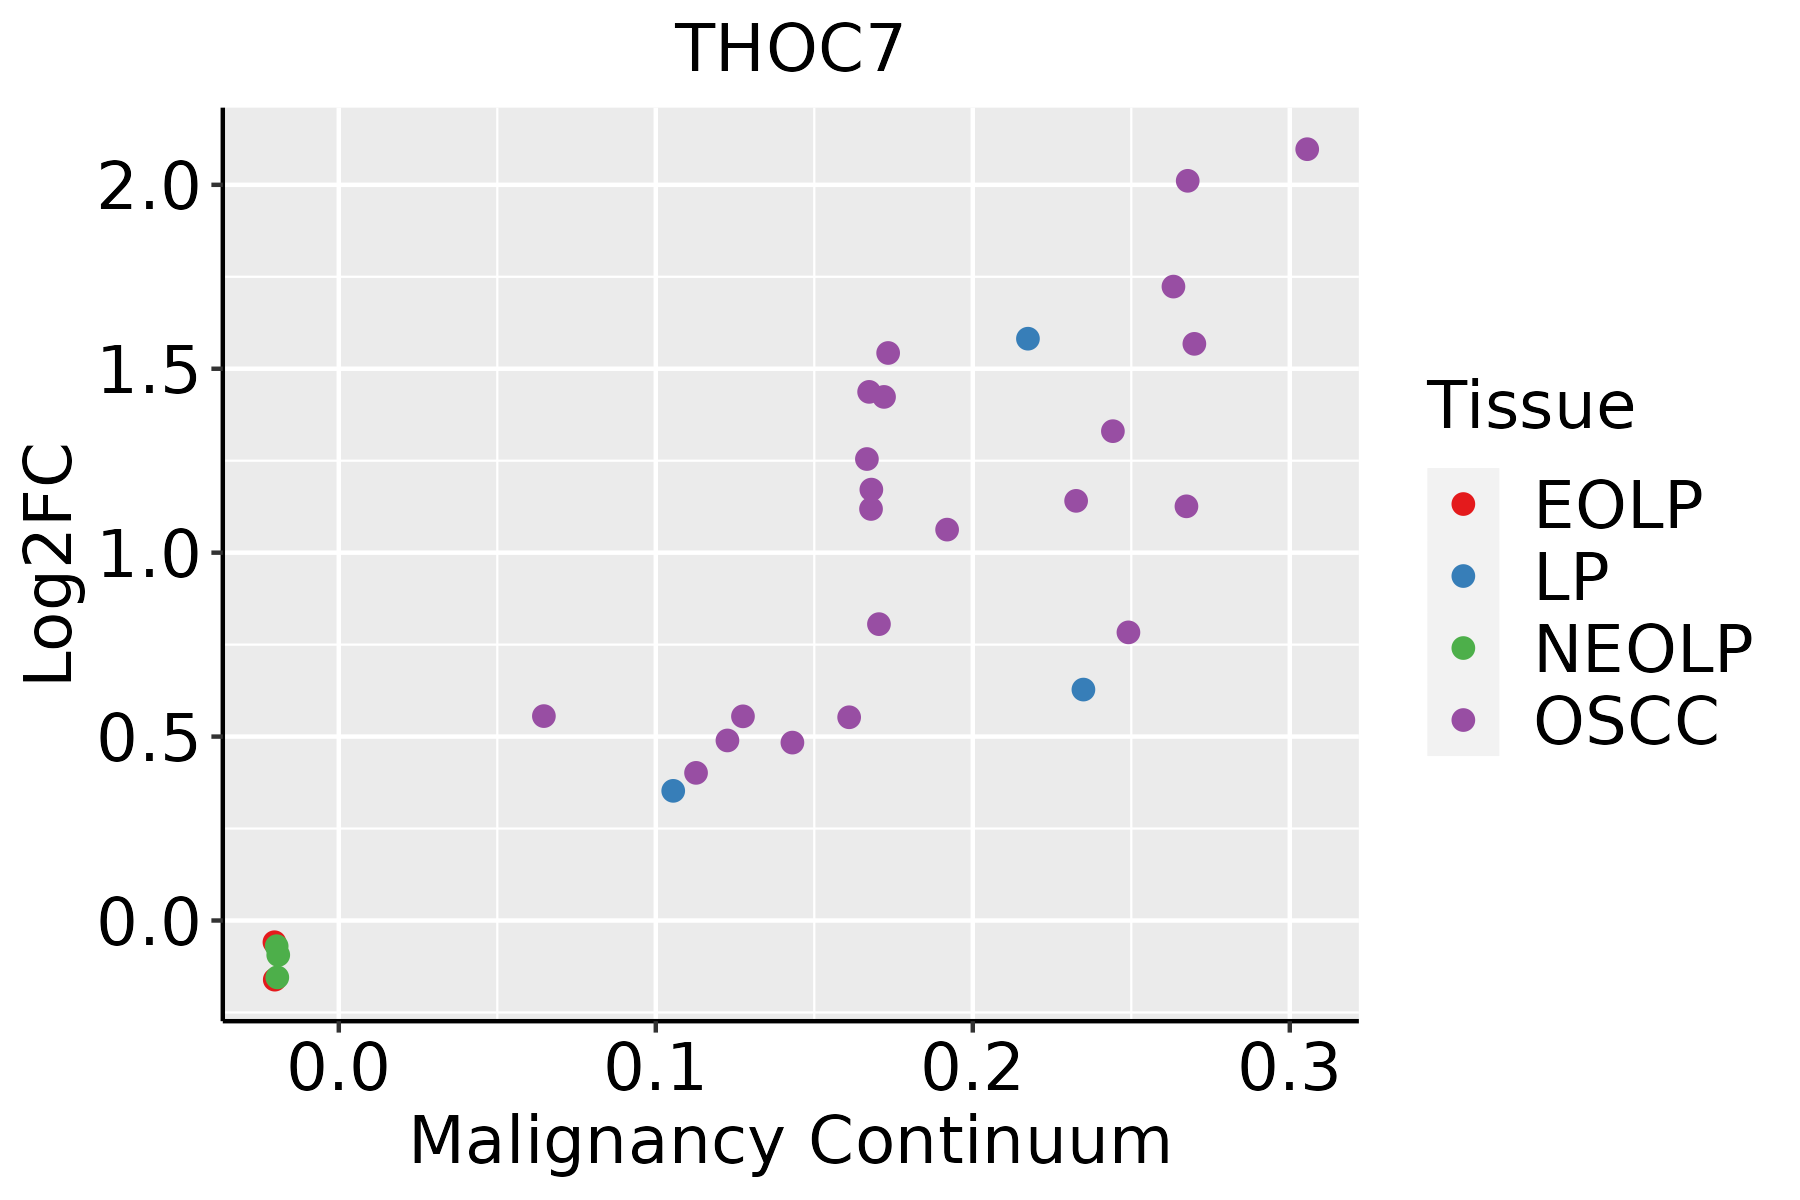 | EOLP: Erosive Oral lichen planus |
| LP: leukoplakia | ||
| NEOLP: Non-erosive oral lichen planus | ||
| OSCC: Oral squamous cell carcinoma | ||
| Skin |  | AK: Actinic keratosis |
| cSCC: Cutaneous squamous cell carcinoma | ||
| SCCIS:squamous cell carcinoma in situ | ||
| Thyroid |  | ATC: Anaplastic thyroid cancer |
| HT: Hashimoto's thyroiditis | ||
| PTC: Papillary thyroid cancer |
| ∗log2FC in expression of this searched gene in stem-like cells from each diseased tissue sample relative to stem-like cells in normal samples in each tissue plotted against the malignancy continuum. Samples are colored based on if they are from different disease stage. |
Top |
Malignant transformation related pathway analysis |
| Find out the enriched GO biological processes and KEGG pathways involved in transition from healthy to precancer to cancer |
| Tissue | Disease Stage | Enriched GO biological Processes |
| Colorectum | AD |  |
| Colorectum | SER |  |
| Colorectum | MSS |  |
| Colorectum | MSI-H |  |
| Colorectum | FAP |  |
| ∗Top 15 enriched GO BP terms are showed in the bar plot of each disease state in each tissue. Each row represents a significant GO biological process which is colored according to the -log10(p.adjust). |
| Page: 1 2 3 4 5 6 7 8 9 |
| GO ID | Tissue | Disease Stage | Description | Gene Ratio | Bg Ratio | pvalue | p.adjust | Count |
| GO:000838016 | Endometrium | AEH | RNA splicing | 111/2100 | 434/18723 | 2.42e-17 | 1.12e-14 | 111 |
| GO:004440316 | Endometrium | AEH | biological process involved in symbiotic interaction | 70/2100 | 290/18723 | 3.26e-10 | 3.55e-08 | 70 |
| GO:005170116 | Endometrium | AEH | biological process involved in interaction with host | 53/2100 | 203/18723 | 2.48e-09 | 1.93e-07 | 53 |
| GO:000640314 | Endometrium | AEH | RNA localization | 51/2100 | 201/18723 | 1.39e-08 | 8.98e-07 | 51 |
| GO:00506579 | Endometrium | AEH | nucleic acid transport | 37/2100 | 163/18723 | 2.04e-05 | 4.09e-04 | 37 |
| GO:00506589 | Endometrium | AEH | RNA transport | 37/2100 | 163/18723 | 2.04e-05 | 4.09e-04 | 37 |
| GO:00512369 | Endometrium | AEH | establishment of RNA localization | 37/2100 | 166/18723 | 3.13e-05 | 5.66e-04 | 37 |
| GO:00159319 | Endometrium | AEH | nucleobase-containing compound transport | 44/2100 | 222/18723 | 1.19e-04 | 1.66e-03 | 44 |
| GO:000691310 | Endometrium | AEH | nucleocytoplasmic transport | 54/2100 | 301/18723 | 3.24e-04 | 3.62e-03 | 54 |
| GO:005116910 | Endometrium | AEH | nuclear transport | 54/2100 | 301/18723 | 3.24e-04 | 3.62e-03 | 54 |
| GO:005116810 | Endometrium | AEH | nuclear export | 32/2100 | 154/18723 | 4.02e-04 | 4.29e-03 | 32 |
| GO:00510285 | Endometrium | AEH | mRNA transport | 28/2100 | 130/18723 | 4.94e-04 | 5.06e-03 | 28 |
| GO:000838017 | Endometrium | EEC | RNA splicing | 111/2168 | 434/18723 | 2.45e-16 | 1.13e-13 | 111 |
| GO:004440317 | Endometrium | EEC | biological process involved in symbiotic interaction | 73/2168 | 290/18723 | 7.47e-11 | 9.95e-09 | 73 |
| GO:005170117 | Endometrium | EEC | biological process involved in interaction with host | 54/2168 | 203/18723 | 2.67e-09 | 2.01e-07 | 54 |
| GO:000640315 | Endometrium | EEC | RNA localization | 53/2168 | 201/18723 | 5.20e-09 | 3.47e-07 | 53 |
| GO:005065712 | Endometrium | EEC | nucleic acid transport | 39/2168 | 163/18723 | 7.00e-06 | 1.63e-04 | 39 |
| GO:005065812 | Endometrium | EEC | RNA transport | 39/2168 | 163/18723 | 7.00e-06 | 1.63e-04 | 39 |
| GO:005123612 | Endometrium | EEC | establishment of RNA localization | 39/2168 | 166/18723 | 1.11e-05 | 2.33e-04 | 39 |
| GO:000691314 | Endometrium | EEC | nucleocytoplasmic transport | 59/2168 | 301/18723 | 3.31e-05 | 5.65e-04 | 59 |
| Page: 1 2 3 4 5 6 7 8 9 10 |
| Pathway ID | Tissue | Disease Stage | Description | Gene Ratio | Bg Ratio | pvalue | p.adjust | qvalue | Count |
| hsa030137 | Esophagus | HGIN | Nucleocytoplasmic transport | 31/1383 | 108/8465 | 8.29e-04 | 7.95e-03 | 6.31e-03 | 31 |
| hsa0301312 | Esophagus | HGIN | Nucleocytoplasmic transport | 31/1383 | 108/8465 | 8.29e-04 | 7.95e-03 | 6.31e-03 | 31 |
| hsa0301321 | Esophagus | ESCC | Nucleocytoplasmic transport | 89/4205 | 108/8465 | 1.20e-12 | 2.37e-11 | 1.21e-11 | 89 |
| hsa0301331 | Esophagus | ESCC | Nucleocytoplasmic transport | 89/4205 | 108/8465 | 1.20e-12 | 2.37e-11 | 1.21e-11 | 89 |
| hsa03013 | Liver | HCC | Nucleocytoplasmic transport | 81/4020 | 108/8465 | 4.28e-09 | 6.83e-08 | 3.80e-08 | 81 |
| hsa030131 | Liver | HCC | Nucleocytoplasmic transport | 81/4020 | 108/8465 | 4.28e-09 | 6.83e-08 | 3.80e-08 | 81 |
| hsa030136 | Oral cavity | OSCC | Nucleocytoplasmic transport | 82/3704 | 108/8465 | 7.93e-12 | 1.33e-10 | 6.77e-11 | 82 |
| hsa0301311 | Oral cavity | OSCC | Nucleocytoplasmic transport | 82/3704 | 108/8465 | 7.93e-12 | 1.33e-10 | 6.77e-11 | 82 |
| hsa030132 | Oral cavity | LP | Nucleocytoplasmic transport | 53/2418 | 108/8465 | 4.68e-06 | 4.10e-05 | 2.64e-05 | 53 |
| hsa030133 | Oral cavity | LP | Nucleocytoplasmic transport | 53/2418 | 108/8465 | 4.68e-06 | 4.10e-05 | 2.64e-05 | 53 |
| Page: 1 |
Top |
Cell-cell communication analysis |
| Identification of potential cell-cell interactions between two cell types and their ligand-receptor pairs for different disease states |
| Ligand | Receptor | LRpair | Pathway | Tissue | Disease Stage |
| Page: 1 |
Top |
Single-cell gene regulatory network inference analysis |
| Find out the significant the regulons (TFs) and the target genes of each regulon across cell types for different disease states |
| TF | Cell Type | Tissue | Disease Stage | Target Gene | RSS | Regulon Activity |
| ∗The dot plots of a searched regulon are shown for all cell subpopulations in each disease state of each tissue based on the regulon specific score inferred using pySCENIC and by calculating the average expression. |
| Page: 1 |
Top |
Somatic mutation of malignant transformation related genes |
| Annotation of somatic variants for genes involved in malignant transformation |
| Hugo Symbol | Variant Class | Variant Classification | dbSNP RS | HGVSc | HGVSp | HGVSp Short | SWISSPROT | BIOTYPE | SIFT | PolyPhen | Tumor Sample Barcode | Tissue | Histology | Sex | Age | Stage | Therapy Types | Drugs | Outcome |
| THOC7 | SNV | Missense_Mutation | novel | c.326N>A | p.Ala109Glu | p.A109E | Q6I9Y2 | protein_coding | deleterious(0) | probably_damaging(1) | TCGA-AC-A3QQ-01 | Breast | breast invasive carcinoma | Female | <65 | I/II | Unknown | Unknown | SD |
| THOC7 | SNV | Missense_Mutation | novel | c.231N>T | p.Glu77Asp | p.E77D | Q6I9Y2 | protein_coding | deleterious(0.01) | probably_damaging(0.965) | TCGA-E2-A15I-01 | Breast | breast invasive carcinoma | Female | <65 | I/II | Hormone Therapy | tamoxiphen | SD |
| THOC7 | deletion | Frame_Shift_Del | novel | c.313_323delNNNNNNNNNNN | p.Gln105SerfsTer12 | p.Q105Sfs*12 | Q6I9Y2 | protein_coding | TCGA-AC-A3QQ-01 | Breast | breast invasive carcinoma | Female | <65 | I/II | Unknown | Unknown | SD | ||
| THOC7 | SNV | Missense_Mutation | novel | c.272G>T | p.Ser91Ile | p.S91I | Q6I9Y2 | protein_coding | tolerated(0.06) | possibly_damaging(0.478) | TCGA-2W-A8YY-01 | Cervix | cervical & endocervical cancer | Female | <65 | I/II | Chemotherapy | cisplatin | CR |
| THOC7 | SNV | Missense_Mutation | c.347N>A | p.Arg116His | p.R116H | Q6I9Y2 | protein_coding | deleterious(0) | probably_damaging(0.993) | TCGA-CM-4746-01 | Colorectum | colon adenocarcinoma | Male | <65 | I/II | Unknown | Unknown | SD | |
| THOC7 | insertion | Frame_Shift_Ins | novel | c.344_345insA | p.Asn115LysfsTer6 | p.N115Kfs*6 | Q6I9Y2 | protein_coding | TCGA-A6-2686-01 | Colorectum | colon adenocarcinoma | Female | >=65 | I/II | Unknown | Unknown | SD | ||
| THOC7 | insertion | Nonsense_Mutation | novel | c.593_594insTCATACTTAA | p.Met198IlefsTer4 | p.M198Ifs*4 | Q6I9Y2 | protein_coding | TCGA-AM-5820-01 | Colorectum | colon adenocarcinoma | Female | <65 | I/II | Unknown | Unknown | SD | ||
| THOC7 | insertion | Frame_Shift_Ins | novel | c.311dupA | p.Gln105AlafsTer16 | p.Q105Afs*16 | Q6I9Y2 | protein_coding | TCGA-D5-6538-01 | Colorectum | colon adenocarcinoma | Female | >=65 | III/IV | Chemotherapy | xeloda | SD | ||
| THOC7 | SNV | Missense_Mutation | novel | c.491N>A | p.Arg164Gln | p.R164Q | Q6I9Y2 | protein_coding | tolerated(0.09) | benign(0.003) | TCGA-A5-A0G2-01 | Endometrium | uterine corpus endometrioid carcinoma | Female | <65 | III/IV | Unknown | Unknown | SD |
| THOC7 | SNV | Missense_Mutation | rs748402561 | c.22G>A | p.Glu8Lys | p.E8K | Q6I9Y2 | protein_coding | deleterious(0.03) | benign(0.357) | TCGA-AP-A056-01 | Endometrium | uterine corpus endometrioid carcinoma | Female | <65 | I/II | Unknown | Unknown | SD |
| Page: 1 2 3 |
Top |
Related drugs of malignant transformation related genes |
| Identification of chemicals and drugs interact with genes involved in malignant transfromation |
| (DGIdb 4.0) |
| Entrez ID | Symbol | Category | Interaction Types | Drug Claim Name | Drug Name | PMIDs |
| Page: 1 |

Copyright 2023-Present -The University of Texas Health Science Center at Houston |