
|
|||||
|
 | |
| |
| |
| |
| |
| |
|
Gene: THOC6 |
Gene summary for THOC6 |
| Gene information | Species | Human | Gene symbol | THOC6 | Gene ID | 79228 |
| Gene name | THO complex 6 | |
| Gene Alias | WDR58 | |
| Cytomap | 16p13.3 | |
| Gene Type | protein-coding | GO ID | GO:0006139 | UniProtAcc | Q86W42 |
Top |
Malignant transformation analysis |
| Identification of the aberrant gene expression in precancerous and cancerous lesions by comparing the gene expression of stem-like cells in diseased tissues with normal stem cells |
| Entrez ID | Symbol | Replicates | Species | Organ | Tissue | Adj P-value | Log2FC | Malignancy |
| 79228 | THOC6 | LZE2T | Human | Esophagus | ESCC | 1.73e-02 | 2.20e-01 | 0.082 |
| 79228 | THOC6 | LZE4T | Human | Esophagus | ESCC | 8.45e-09 | 3.23e-01 | 0.0811 |
| 79228 | THOC6 | LZE7T | Human | Esophagus | ESCC | 1.43e-05 | 2.09e-01 | 0.0667 |
| 79228 | THOC6 | LZE8T | Human | Esophagus | ESCC | 4.70e-08 | 4.17e-01 | 0.067 |
| 79228 | THOC6 | LZE20T | Human | Esophagus | ESCC | 9.24e-07 | 2.38e-01 | 0.0662 |
| 79228 | THOC6 | LZE22D1 | Human | Esophagus | HGIN | 6.05e-04 | 7.71e-02 | 0.0595 |
| 79228 | THOC6 | LZE24T | Human | Esophagus | ESCC | 3.01e-14 | 4.45e-01 | 0.0596 |
| 79228 | THOC6 | LZE21T | Human | Esophagus | ESCC | 2.49e-03 | 3.47e-01 | 0.0655 |
| 79228 | THOC6 | LZE6T | Human | Esophagus | ESCC | 1.47e-04 | 3.48e-01 | 0.0845 |
| 79228 | THOC6 | P1T-E | Human | Esophagus | ESCC | 4.11e-04 | 4.13e-01 | 0.0875 |
| 79228 | THOC6 | P2T-E | Human | Esophagus | ESCC | 1.20e-55 | 1.21e+00 | 0.1177 |
| 79228 | THOC6 | P4T-E | Human | Esophagus | ESCC | 1.45e-22 | 6.57e-01 | 0.1323 |
| 79228 | THOC6 | P5T-E | Human | Esophagus | ESCC | 3.66e-28 | 6.58e-01 | 0.1327 |
| 79228 | THOC6 | P8T-E | Human | Esophagus | ESCC | 2.36e-29 | 5.56e-01 | 0.0889 |
| 79228 | THOC6 | P9T-E | Human | Esophagus | ESCC | 5.94e-17 | 3.37e-01 | 0.1131 |
| 79228 | THOC6 | P10T-E | Human | Esophagus | ESCC | 7.17e-33 | 5.37e-01 | 0.116 |
| 79228 | THOC6 | P11T-E | Human | Esophagus | ESCC | 7.27e-17 | 1.00e+00 | 0.1426 |
| 79228 | THOC6 | P12T-E | Human | Esophagus | ESCC | 2.68e-47 | 1.10e+00 | 0.1122 |
| 79228 | THOC6 | P15T-E | Human | Esophagus | ESCC | 3.12e-25 | 6.99e-01 | 0.1149 |
| 79228 | THOC6 | P16T-E | Human | Esophagus | ESCC | 3.44e-21 | 4.03e-01 | 0.1153 |
| Page: 1 2 3 4 5 |
| Tissue | Expression Dynamics | Abbreviation |
| Esophagus | 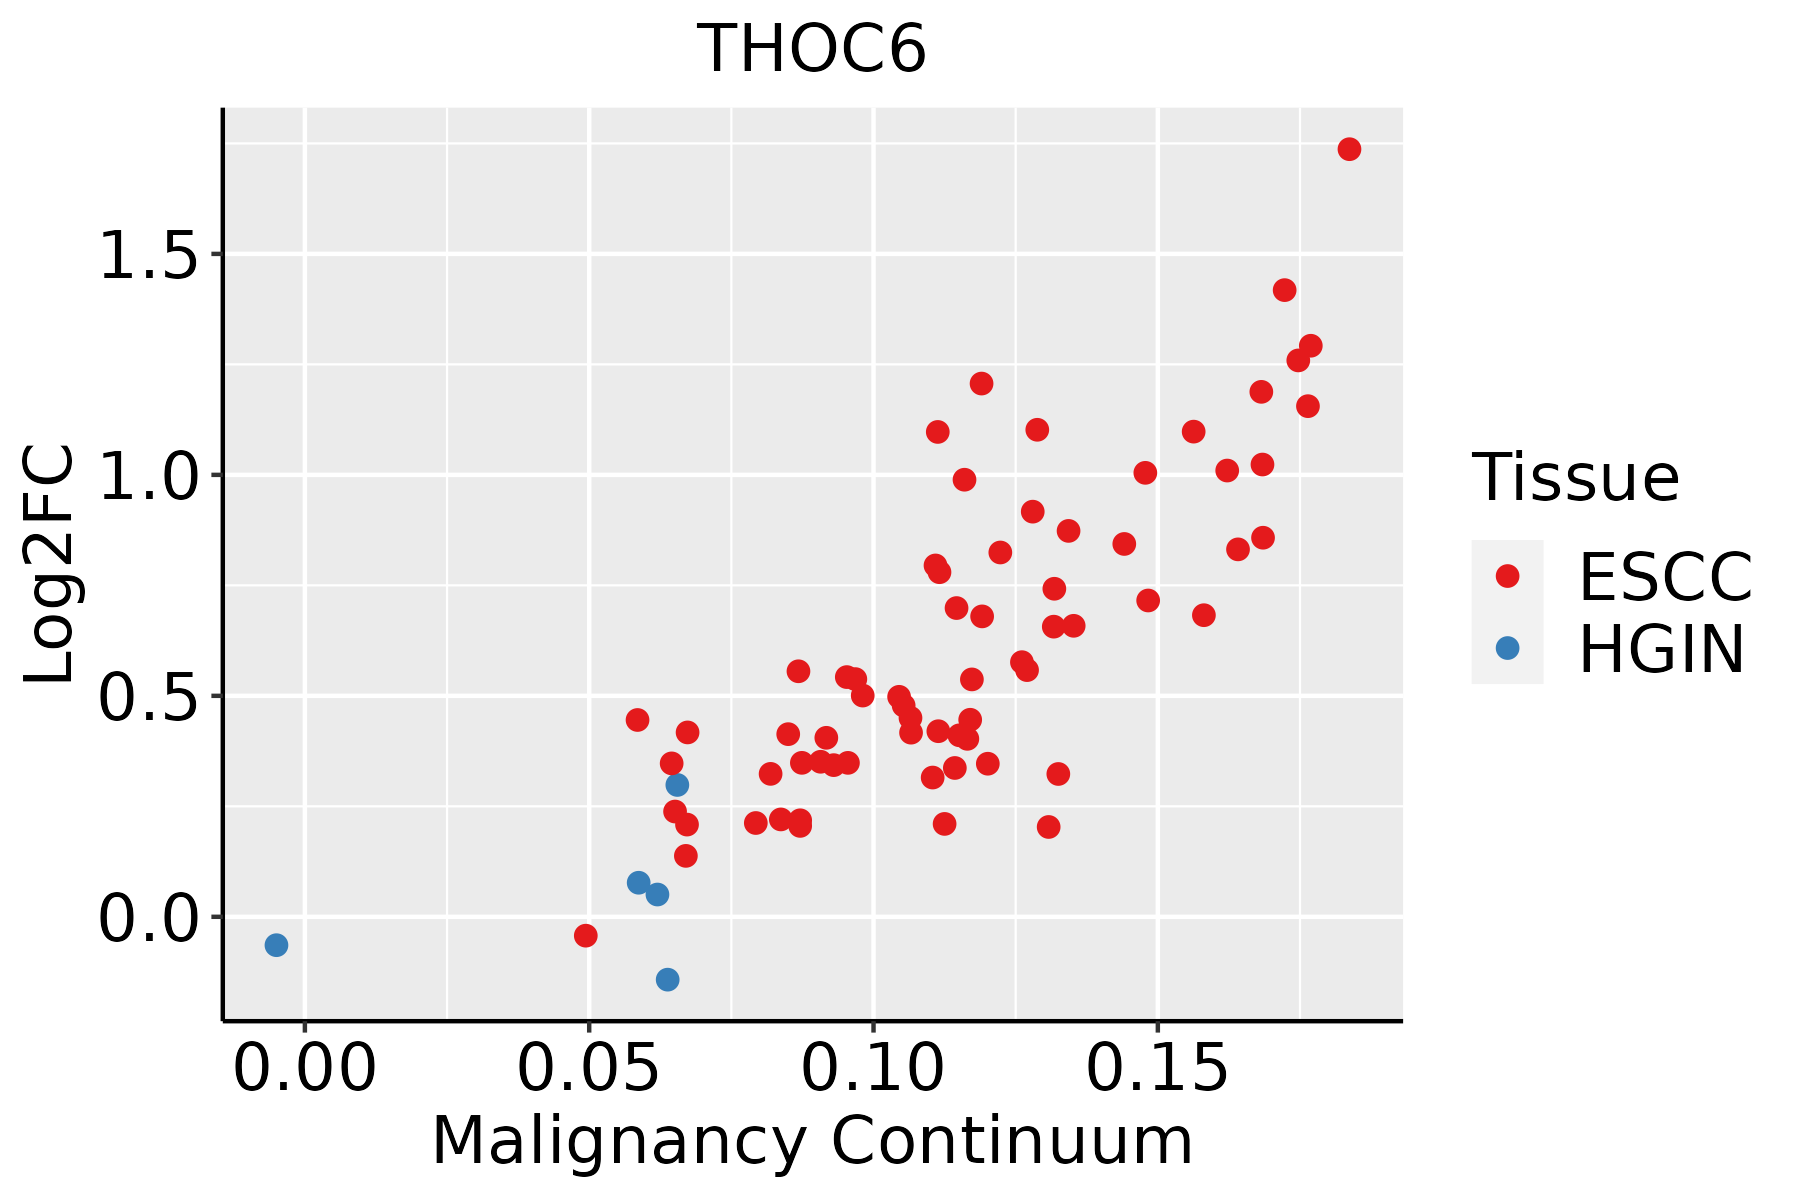 | ESCC: Esophageal squamous cell carcinoma |
| HGIN: High-grade intraepithelial neoplasias | ||
| LGIN: Low-grade intraepithelial neoplasias | ||
| Oral Cavity | 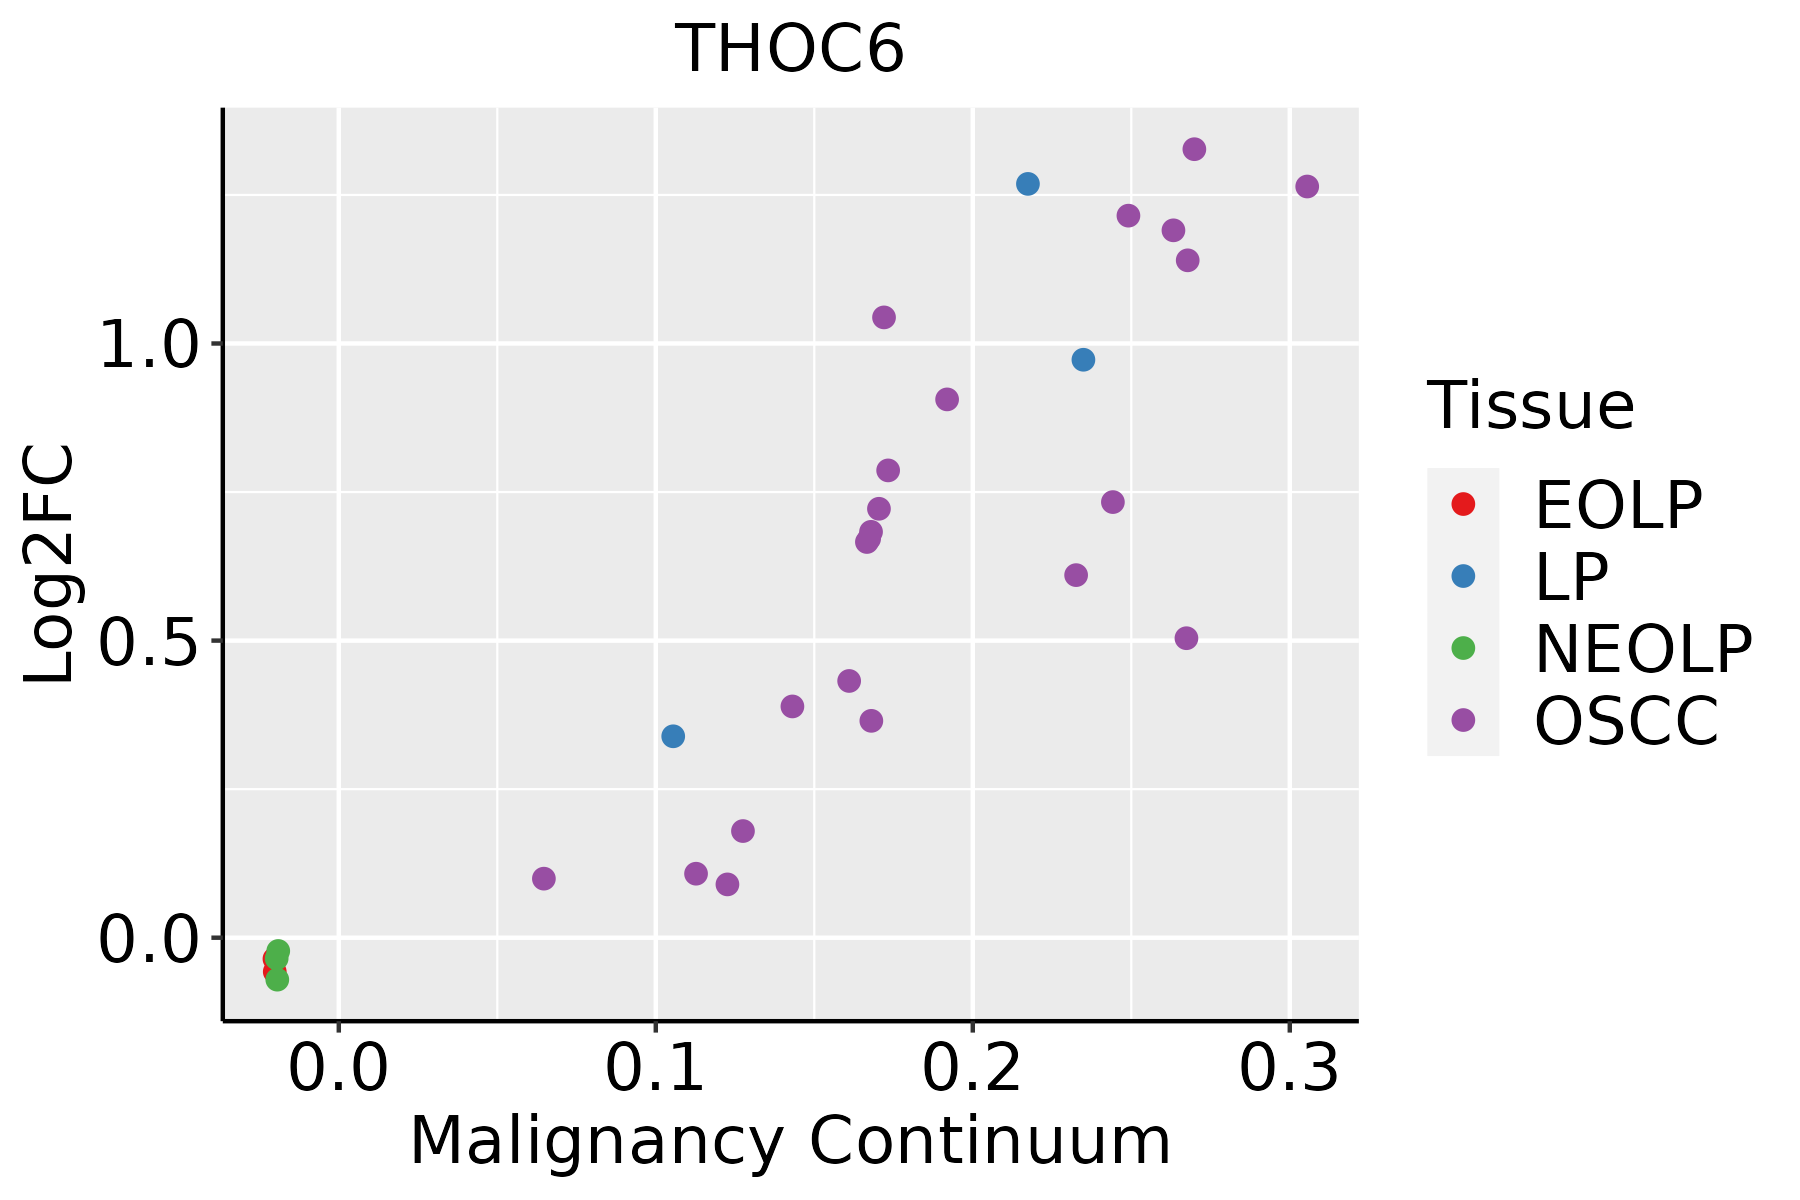 | EOLP: Erosive Oral lichen planus |
| LP: leukoplakia | ||
| NEOLP: Non-erosive oral lichen planus | ||
| OSCC: Oral squamous cell carcinoma | ||
| Skin | 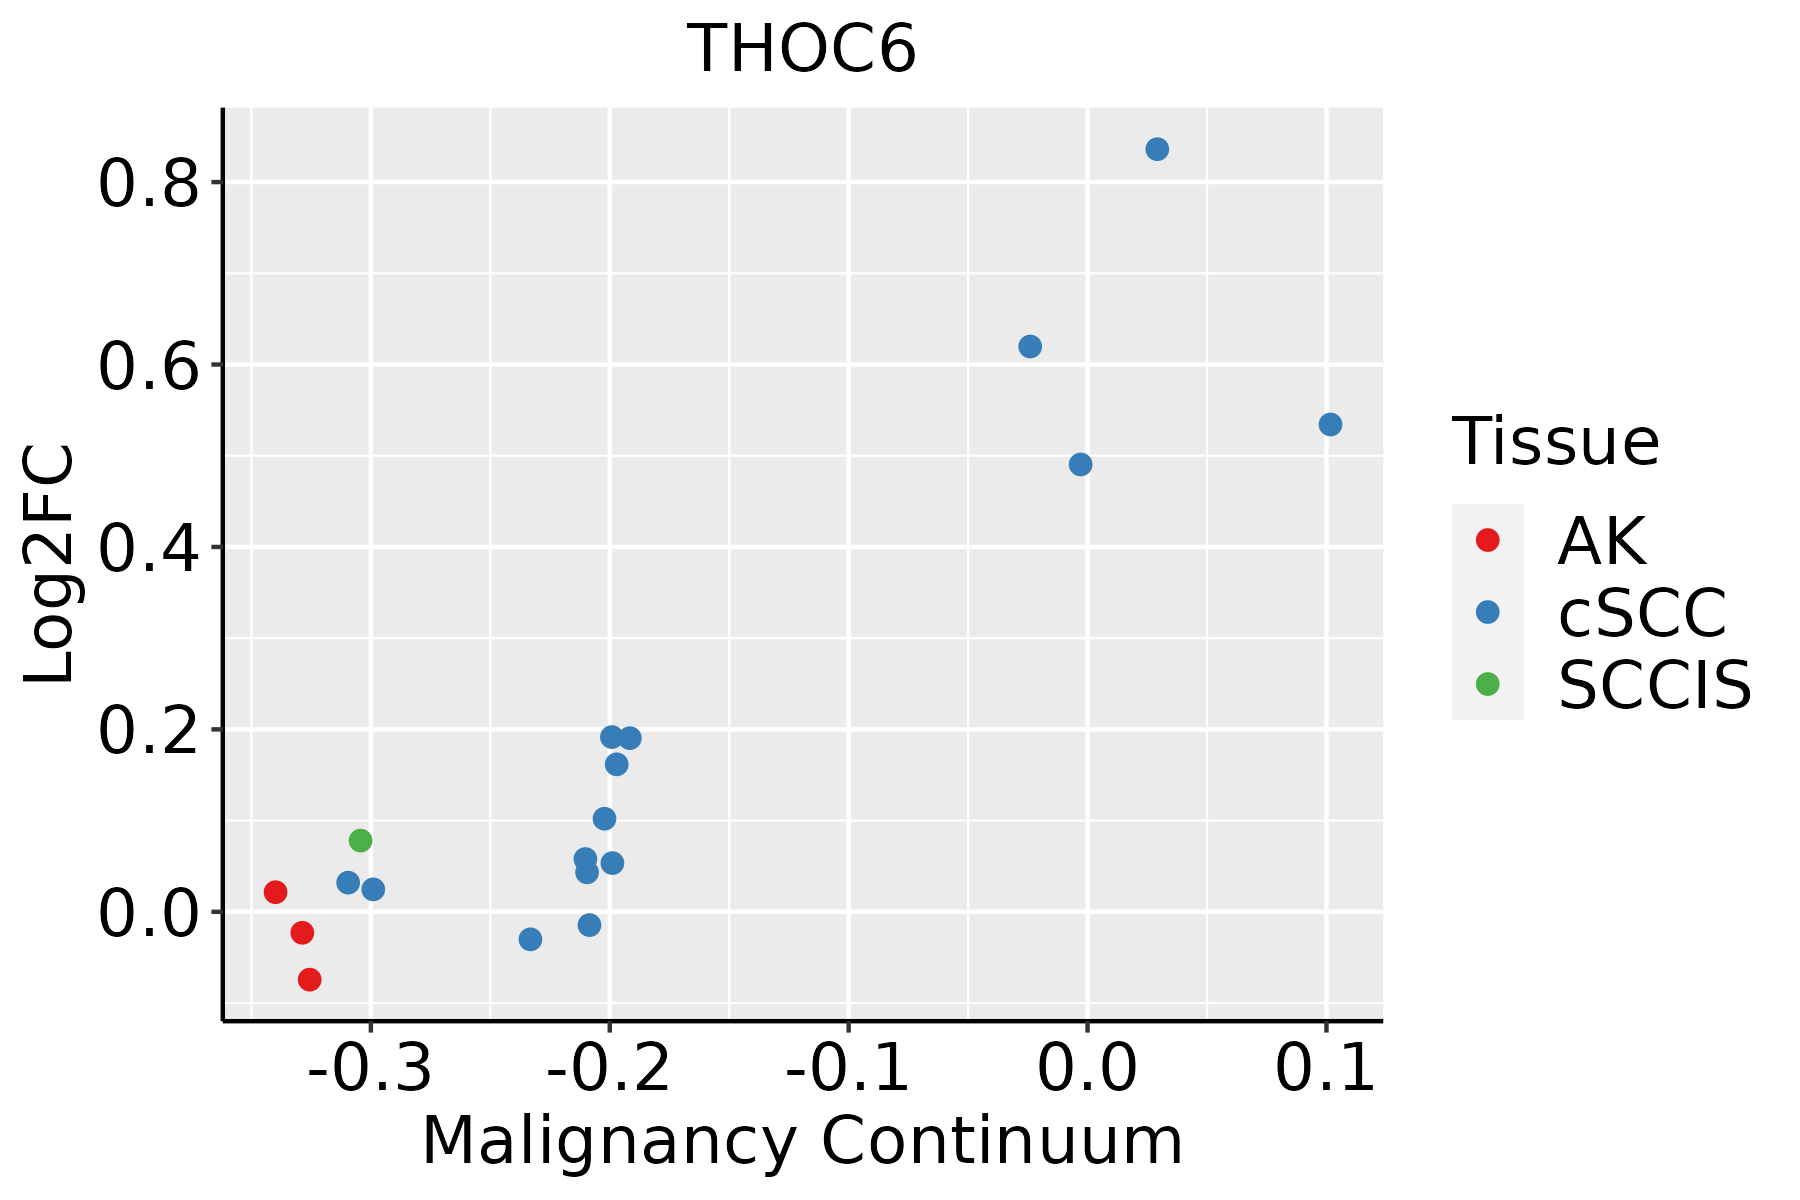 | AK: Actinic keratosis |
| cSCC: Cutaneous squamous cell carcinoma | ||
| SCCIS:squamous cell carcinoma in situ |
| ∗log2FC in expression of this searched gene in stem-like cells from each diseased tissue sample relative to stem-like cells in normal samples in each tissue plotted against the malignancy continuum. Samples are colored based on if they are from different disease stage. |
Top |
Malignant transformation related pathway analysis |
| Find out the enriched GO biological processes and KEGG pathways involved in transition from healthy to precancer to cancer |
| Tissue | Disease Stage | Enriched GO biological Processes |
| Colorectum | AD |  |
| Colorectum | SER |  |
| Colorectum | MSS |  |
| Colorectum | MSI-H |  |
| Colorectum | FAP |  |
| ∗Top 15 enriched GO BP terms are showed in the bar plot of each disease state in each tissue. Each row represents a significant GO biological process which is colored according to the -log10(p.adjust). |
| Page: 1 2 3 4 5 6 7 8 9 |
| GO ID | Tissue | Disease Stage | Description | Gene Ratio | Bg Ratio | pvalue | p.adjust | Count |
| GO:000838026 | Esophagus | HGIN | RNA splicing | 160/2587 | 434/18723 | 3.74e-34 | 1.12e-30 | 160 |
| GO:000640320 | Esophagus | HGIN | RNA localization | 66/2587 | 201/18723 | 4.06e-12 | 5.41e-10 | 66 |
| GO:000691319 | Esophagus | HGIN | nucleocytoplasmic transport | 83/2587 | 301/18723 | 2.14e-10 | 1.97e-08 | 83 |
| GO:005116919 | Esophagus | HGIN | nuclear transport | 83/2587 | 301/18723 | 2.14e-10 | 1.97e-08 | 83 |
| GO:005116819 | Esophagus | HGIN | nuclear export | 48/2587 | 154/18723 | 2.21e-08 | 1.34e-06 | 48 |
| GO:005065716 | Esophagus | HGIN | nucleic acid transport | 49/2587 | 163/18723 | 5.71e-08 | 3.06e-06 | 49 |
| GO:005065816 | Esophagus | HGIN | RNA transport | 49/2587 | 163/18723 | 5.71e-08 | 3.06e-06 | 49 |
| GO:005123616 | Esophagus | HGIN | establishment of RNA localization | 49/2587 | 166/18723 | 1.07e-07 | 5.47e-06 | 49 |
| GO:00510288 | Esophagus | HGIN | mRNA transport | 40/2587 | 130/18723 | 4.67e-07 | 2.07e-05 | 40 |
| GO:004440326 | Esophagus | HGIN | biological process involved in symbiotic interaction | 71/2587 | 290/18723 | 7.09e-07 | 3.00e-05 | 71 |
| GO:001593116 | Esophagus | HGIN | nucleobase-containing compound transport | 57/2587 | 222/18723 | 1.76e-06 | 6.52e-05 | 57 |
| GO:005170127 | Esophagus | HGIN | biological process involved in interaction with host | 51/2587 | 203/18723 | 1.16e-05 | 3.29e-04 | 51 |
| GO:00711665 | Esophagus | HGIN | ribonucleoprotein complex localization | 23/2587 | 77/18723 | 2.00e-04 | 3.72e-03 | 23 |
| GO:00315035 | Esophagus | HGIN | protein-containing complex localization | 50/2587 | 220/18723 | 2.18e-04 | 3.98e-03 | 50 |
| GO:00714265 | Esophagus | HGIN | ribonucleoprotein complex export from nucleus | 22/2587 | 76/18723 | 4.44e-04 | 6.62e-03 | 22 |
| GO:00064056 | Esophagus | HGIN | RNA export from nucleus | 23/2587 | 84/18723 | 7.90e-04 | 1.03e-02 | 23 |
| GO:0008380111 | Esophagus | ESCC | RNA splicing | 336/8552 | 434/18723 | 1.74e-42 | 3.67e-39 | 336 |
| GO:0006913110 | Esophagus | ESCC | nucleocytoplasmic transport | 230/8552 | 301/18723 | 6.04e-28 | 2.02e-25 | 230 |
| GO:0051169110 | Esophagus | ESCC | nuclear transport | 230/8552 | 301/18723 | 6.04e-28 | 2.02e-25 | 230 |
| GO:0006403110 | Esophagus | ESCC | RNA localization | 166/8552 | 201/18723 | 1.95e-27 | 6.18e-25 | 166 |
| Page: 1 2 3 4 5 |
| Pathway ID | Tissue | Disease Stage | Description | Gene Ratio | Bg Ratio | pvalue | p.adjust | qvalue | Count |
| hsa030137 | Esophagus | HGIN | Nucleocytoplasmic transport | 31/1383 | 108/8465 | 8.29e-04 | 7.95e-03 | 6.31e-03 | 31 |
| hsa0301312 | Esophagus | HGIN | Nucleocytoplasmic transport | 31/1383 | 108/8465 | 8.29e-04 | 7.95e-03 | 6.31e-03 | 31 |
| hsa0301321 | Esophagus | ESCC | Nucleocytoplasmic transport | 89/4205 | 108/8465 | 1.20e-12 | 2.37e-11 | 1.21e-11 | 89 |
| hsa0301331 | Esophagus | ESCC | Nucleocytoplasmic transport | 89/4205 | 108/8465 | 1.20e-12 | 2.37e-11 | 1.21e-11 | 89 |
| hsa030136 | Oral cavity | OSCC | Nucleocytoplasmic transport | 82/3704 | 108/8465 | 7.93e-12 | 1.33e-10 | 6.77e-11 | 82 |
| hsa0301311 | Oral cavity | OSCC | Nucleocytoplasmic transport | 82/3704 | 108/8465 | 7.93e-12 | 1.33e-10 | 6.77e-11 | 82 |
| hsa030132 | Oral cavity | LP | Nucleocytoplasmic transport | 53/2418 | 108/8465 | 4.68e-06 | 4.10e-05 | 2.64e-05 | 53 |
| hsa030133 | Oral cavity | LP | Nucleocytoplasmic transport | 53/2418 | 108/8465 | 4.68e-06 | 4.10e-05 | 2.64e-05 | 53 |
| Page: 1 |
Top |
Cell-cell communication analysis |
| Identification of potential cell-cell interactions between two cell types and their ligand-receptor pairs for different disease states |
| Ligand | Receptor | LRpair | Pathway | Tissue | Disease Stage |
| Page: 1 |
Top |
Single-cell gene regulatory network inference analysis |
| Find out the significant the regulons (TFs) and the target genes of each regulon across cell types for different disease states |
| TF | Cell Type | Tissue | Disease Stage | Target Gene | RSS | Regulon Activity |
| ∗The dot plots of a searched regulon are shown for all cell subpopulations in each disease state of each tissue based on the regulon specific score inferred using pySCENIC and by calculating the average expression. |
| Page: 1 |
Top |
Somatic mutation of malignant transformation related genes |
| Annotation of somatic variants for genes involved in malignant transformation |
| Hugo Symbol | Variant Class | Variant Classification | dbSNP RS | HGVSc | HGVSp | HGVSp Short | SWISSPROT | BIOTYPE | SIFT | PolyPhen | Tumor Sample Barcode | Tissue | Histology | Sex | Age | Stage | Therapy Types | Drugs | Outcome |
| THOC6 | insertion | Frame_Shift_Ins | novel | c.649_650insTACATGCAGAGGGTCCTCCGGGGCCACACAGACTACATCCACTG | p.Pro217LeufsTer69 | p.P217Lfs*69 | Q86W42 | protein_coding | TCGA-A2-A0EY-01 | Breast | breast invasive carcinoma | Female | <65 | I/II | Chemotherapy | adriamycin | SD | ||
| THOC6 | insertion | In_Frame_Ins | novel | c.378_379insTTTCATACGTCCCAGGCAGGCCTCATCCAGTCTTTC | p.Val126_Pro127insPheHisThrSerGlnAlaGlyLeuIleGlnSerPhe | p.V126_P127insFHTSQAGLIQSF | Q86W42 | protein_coding | TCGA-A8-A097-01 | Breast | breast invasive carcinoma | Female | >=65 | I/II | Hormone Therapy | tamoxiphen | SD | ||
| THOC6 | SNV | Missense_Mutation | rs374952281 | c.346C>T | p.Arg116Cys | p.R116C | Q86W42 | protein_coding | tolerated(0.15) | benign(0.001) | TCGA-2W-A8YY-01 | Cervix | cervical & endocervical cancer | Female | <65 | I/II | Chemotherapy | cisplatin | CR |
| THOC6 | SNV | Missense_Mutation | c.190N>A | p.Glu64Lys | p.E64K | Q86W42 | protein_coding | tolerated(0.35) | benign(0.01) | TCGA-AA-3712-01 | Colorectum | colon adenocarcinoma | Male | >=65 | III/IV | Unknown | Unknown | SD | |
| THOC6 | SNV | Missense_Mutation | c.419N>T | p.Ser140Phe | p.S140F | Q86W42 | protein_coding | deleterious(0.02) | benign(0.416) | TCGA-AA-A010-01 | Colorectum | colon adenocarcinoma | Female | <65 | I/II | Chemotherapy | folinic | CR | |
| THOC6 | SNV | Missense_Mutation | c.414N>T | p.Glu138Asp | p.E138D | Q86W42 | protein_coding | tolerated(1) | benign(0) | TCGA-A5-A1OF-01 | Endometrium | uterine corpus endometrioid carcinoma | Female | <65 | I/II | Unknown | Unknown | SD | |
| THOC6 | SNV | Missense_Mutation | rs780072471 | c.644C>T | p.Ser215Leu | p.S215L | Q86W42 | protein_coding | deleterious(0.05) | benign(0.017) | TCGA-A5-A2K5-01 | Endometrium | uterine corpus endometrioid carcinoma | Female | >=65 | I/II | Unknown | Unknown | SD |
| THOC6 | SNV | Missense_Mutation | c.256N>A | p.Asp86Asn | p.D86N | Q86W42 | protein_coding | deleterious(0.01) | benign(0.119) | TCGA-AP-A056-01 | Endometrium | uterine corpus endometrioid carcinoma | Female | <65 | I/II | Unknown | Unknown | SD | |
| THOC6 | SNV | Missense_Mutation | rs780815492 | c.592N>T | p.Arg198Cys | p.R198C | Q86W42 | protein_coding | deleterious(0) | probably_damaging(0.999) | TCGA-AP-A059-01 | Endometrium | uterine corpus endometrioid carcinoma | Female | >=65 | I/II | Unknown | Unknown | SD |
| THOC6 | SNV | Missense_Mutation | rs772081227 | c.1004N>A | p.Arg335Gln | p.R335Q | Q86W42 | protein_coding | deleterious(0.01) | possibly_damaging(0.886) | TCGA-AP-A0LM-01 | Endometrium | uterine corpus endometrioid carcinoma | Female | <65 | III/IV | Chemotherapy | cisplatin | SD |
| Page: 1 2 3 4 |
Top |
Related drugs of malignant transformation related genes |
| Identification of chemicals and drugs interact with genes involved in malignant transfromation |
| (DGIdb 4.0) |
| Entrez ID | Symbol | Category | Interaction Types | Drug Claim Name | Drug Name | PMIDs |
| Page: 1 |

Copyright 2023-Present -The University of Texas Health Science Center at Houston |