
|
|||||
|
 | |
| |
| |
| |
| |
| |
|
Gene: THOC3 |
Gene summary for THOC3 |
| Gene information | Species | Human | Gene symbol | THOC3 | Gene ID | 84321 |
| Gene name | THO complex 3 | |
| Gene Alias | THO3 | |
| Cytomap | 5q35.2 | |
| Gene Type | protein-coding | GO ID | GO:0006139 | UniProtAcc | Q96J01 |
Top |
Malignant transformation analysis |
| Identification of the aberrant gene expression in precancerous and cancerous lesions by comparing the gene expression of stem-like cells in diseased tissues with normal stem cells |
| Entrez ID | Symbol | Replicates | Species | Organ | Tissue | Adj P-value | Log2FC | Malignancy |
| 84321 | THOC3 | CCI_2 | Human | Cervix | CC | 2.68e-05 | 5.65e-01 | 0.5249 |
| 84321 | THOC3 | LZE2T | Human | Esophagus | ESCC | 2.96e-07 | 1.19e+00 | 0.082 |
| 84321 | THOC3 | LZE4T | Human | Esophagus | ESCC | 3.75e-41 | 1.37e+00 | 0.0811 |
| 84321 | THOC3 | LZE7T | Human | Esophagus | ESCC | 1.71e-13 | 9.75e-01 | 0.0667 |
| 84321 | THOC3 | LZE8T | Human | Esophagus | ESCC | 2.13e-29 | 1.11e+00 | 0.067 |
| 84321 | THOC3 | LZE20T | Human | Esophagus | ESCC | 7.14e-09 | 4.27e-01 | 0.0662 |
| 84321 | THOC3 | LZE22D1 | Human | Esophagus | HGIN | 1.49e-06 | 4.18e-01 | 0.0595 |
| 84321 | THOC3 | LZE22T | Human | Esophagus | ESCC | 1.63e-03 | 2.47e-01 | 0.068 |
| 84321 | THOC3 | LZE24T | Human | Esophagus | ESCC | 2.37e-33 | 9.87e-01 | 0.0596 |
| 84321 | THOC3 | LZE21T | Human | Esophagus | ESCC | 6.76e-12 | 1.45e+00 | 0.0655 |
| 84321 | THOC3 | LZE6T | Human | Esophagus | ESCC | 9.30e-15 | 7.20e-01 | 0.0845 |
| 84321 | THOC3 | P1T-E | Human | Esophagus | ESCC | 2.19e-13 | 1.07e+00 | 0.0875 |
| 84321 | THOC3 | P2T-E | Human | Esophagus | ESCC | 1.05e-87 | 1.57e+00 | 0.1177 |
| 84321 | THOC3 | P4T-E | Human | Esophagus | ESCC | 2.49e-64 | 1.55e+00 | 0.1323 |
| 84321 | THOC3 | P5T-E | Human | Esophagus | ESCC | 2.12e-75 | 1.63e+00 | 0.1327 |
| 84321 | THOC3 | P8T-E | Human | Esophagus | ESCC | 1.90e-65 | 1.29e+00 | 0.0889 |
| 84321 | THOC3 | P9T-E | Human | Esophagus | ESCC | 1.13e-33 | 8.76e-01 | 0.1131 |
| 84321 | THOC3 | P10T-E | Human | Esophagus | ESCC | 3.05e-91 | 1.44e+00 | 0.116 |
| 84321 | THOC3 | P11T-E | Human | Esophagus | ESCC | 3.29e-26 | 1.34e+00 | 0.1426 |
| 84321 | THOC3 | P12T-E | Human | Esophagus | ESCC | 1.76e-112 | 2.67e+00 | 0.1122 |
| Page: 1 2 3 4 5 6 |
| Tissue | Expression Dynamics | Abbreviation |
| Cervix | 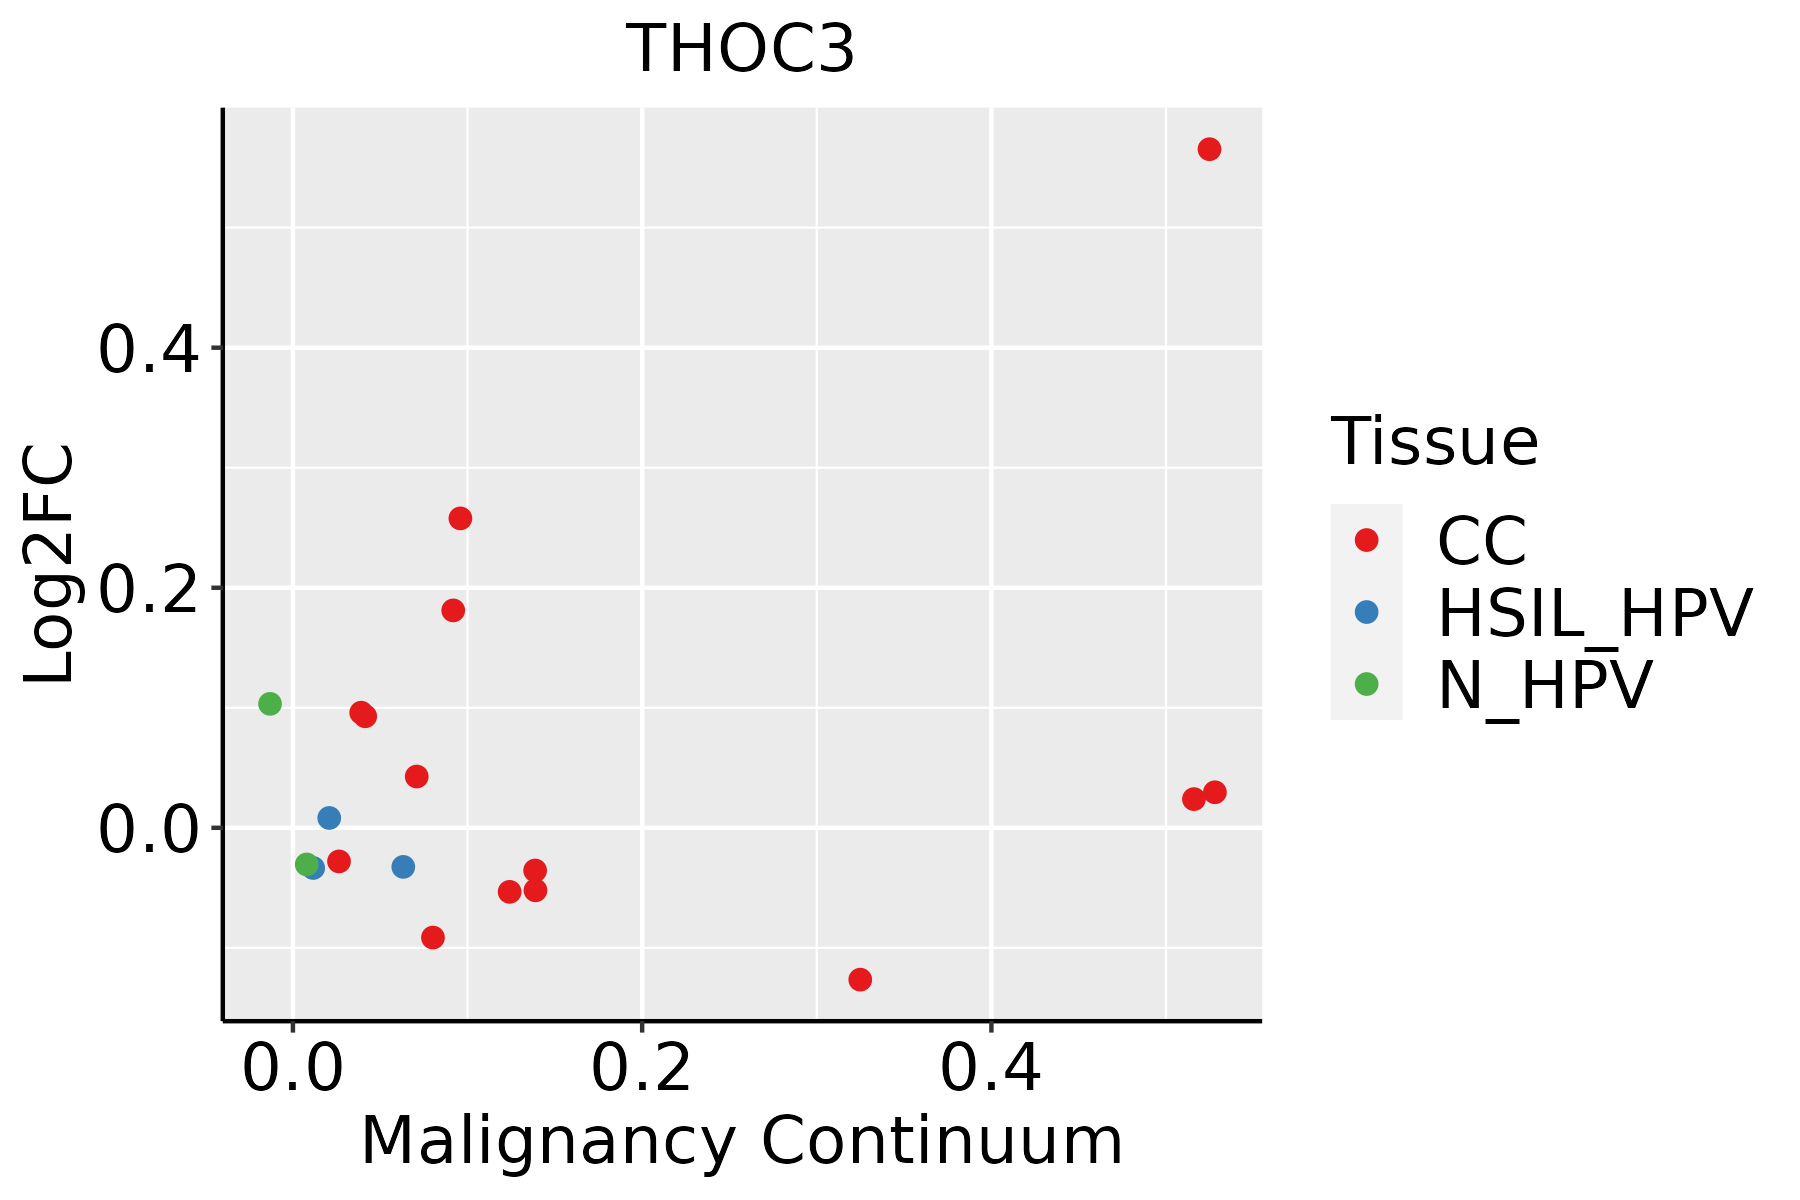 | CC: Cervix cancer |
| HSIL_HPV: HPV-infected high-grade squamous intraepithelial lesions | ||
| N_HPV: HPV-infected normal cervix | ||
| Esophagus |  | ESCC: Esophageal squamous cell carcinoma |
| HGIN: High-grade intraepithelial neoplasias | ||
| LGIN: Low-grade intraepithelial neoplasias | ||
| Liver |  | HCC: Hepatocellular carcinoma |
| NAFLD: Non-alcoholic fatty liver disease | ||
| Oral Cavity | 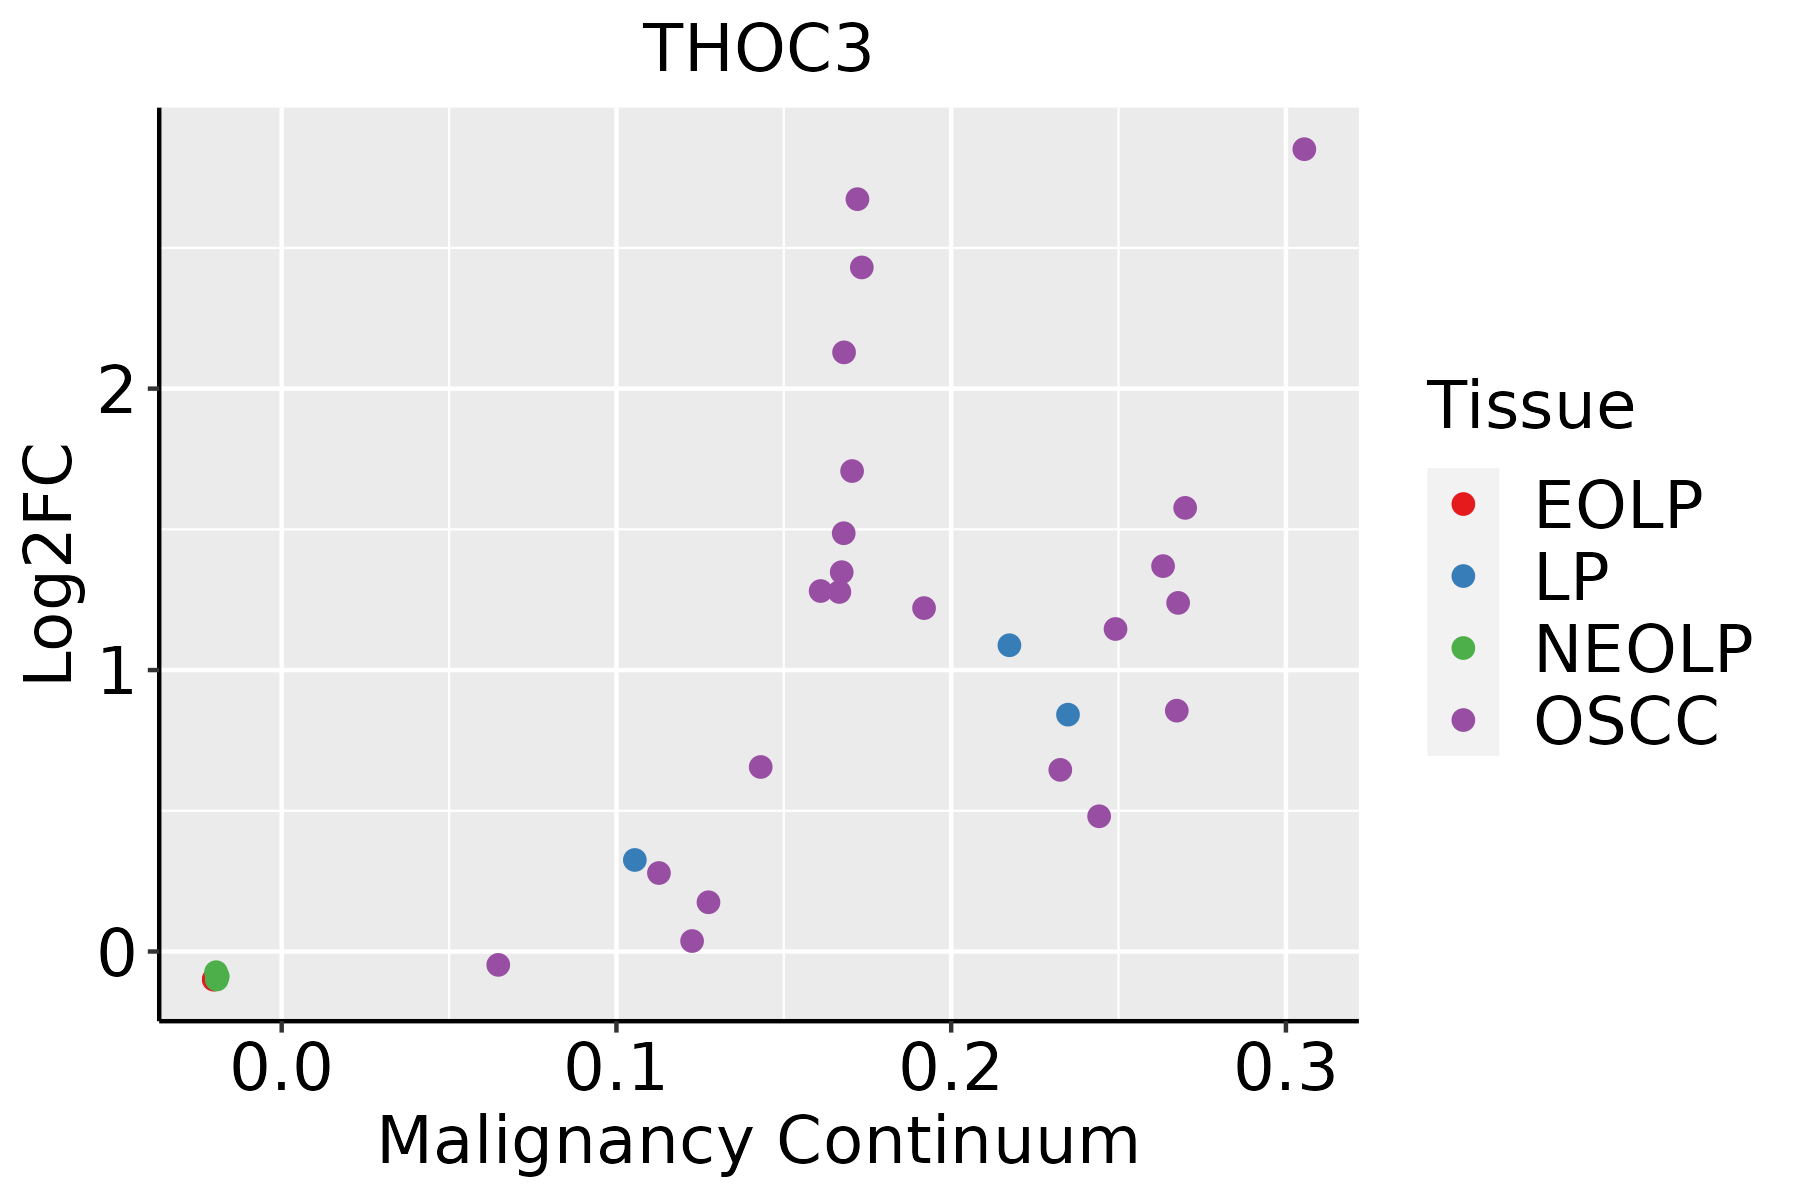 | EOLP: Erosive Oral lichen planus |
| LP: leukoplakia | ||
| NEOLP: Non-erosive oral lichen planus | ||
| OSCC: Oral squamous cell carcinoma | ||
| Skin |  | AK: Actinic keratosis |
| cSCC: Cutaneous squamous cell carcinoma | ||
| SCCIS:squamous cell carcinoma in situ | ||
| Thyroid |  | ATC: Anaplastic thyroid cancer |
| HT: Hashimoto's thyroiditis | ||
| PTC: Papillary thyroid cancer |
| ∗log2FC in expression of this searched gene in stem-like cells from each diseased tissue sample relative to stem-like cells in normal samples in each tissue plotted against the malignancy continuum. Samples are colored based on if they are from different disease stage. |
Top |
Malignant transformation related pathway analysis |
| Find out the enriched GO biological processes and KEGG pathways involved in transition from healthy to precancer to cancer |
| Tissue | Disease Stage | Enriched GO biological Processes |
| Colorectum | AD |  |
| Colorectum | SER |  |
| Colorectum | MSS |  |
| Colorectum | MSI-H |  |
| Colorectum | FAP |  |
| ∗Top 15 enriched GO BP terms are showed in the bar plot of each disease state in each tissue. Each row represents a significant GO biological process which is colored according to the -log10(p.adjust). |
| Page: 1 2 3 4 5 6 7 8 9 |
| GO ID | Tissue | Disease Stage | Description | Gene Ratio | Bg Ratio | pvalue | p.adjust | Count |
| GO:005170110 | Cervix | CC | biological process involved in interaction with host | 57/2311 | 203/18723 | 1.18e-09 | 1.41e-07 | 57 |
| GO:004440310 | Cervix | CC | biological process involved in symbiotic interaction | 71/2311 | 290/18723 | 7.94e-09 | 6.98e-07 | 71 |
| GO:00069139 | Cervix | CC | nucleocytoplasmic transport | 71/2311 | 301/18723 | 4.04e-08 | 2.54e-06 | 71 |
| GO:00511699 | Cervix | CC | nuclear transport | 71/2311 | 301/18723 | 4.04e-08 | 2.54e-06 | 71 |
| GO:00511689 | Cervix | CC | nuclear export | 38/2311 | 154/18723 | 1.86e-05 | 3.46e-04 | 38 |
| GO:00512368 | Cervix | CC | establishment of RNA localization | 39/2311 | 166/18723 | 4.76e-05 | 7.25e-04 | 39 |
| GO:00506578 | Cervix | CC | nucleic acid transport | 38/2311 | 163/18723 | 7.06e-05 | 9.85e-04 | 38 |
| GO:00506588 | Cervix | CC | RNA transport | 38/2311 | 163/18723 | 7.06e-05 | 9.85e-04 | 38 |
| GO:000640310 | Cervix | CC | RNA localization | 43/2311 | 201/18723 | 2.00e-04 | 2.29e-03 | 43 |
| GO:00510284 | Cervix | CC | mRNA transport | 31/2311 | 130/18723 | 2.05e-04 | 2.33e-03 | 31 |
| GO:000838010 | Cervix | CC | RNA splicing | 76/2311 | 434/18723 | 9.79e-04 | 8.19e-03 | 76 |
| GO:00159318 | Cervix | CC | nucleobase-containing compound transport | 43/2311 | 222/18723 | 1.72e-03 | 1.30e-02 | 43 |
| GO:00714262 | Cervix | CC | ribonucleoprotein complex export from nucleus | 18/2311 | 76/18723 | 4.45e-03 | 2.71e-02 | 18 |
| GO:00711662 | Cervix | CC | ribonucleoprotein complex localization | 18/2311 | 77/18723 | 5.15e-03 | 3.03e-02 | 18 |
| GO:00064054 | Cervix | CC | RNA export from nucleus | 19/2311 | 84/18723 | 6.02e-03 | 3.43e-02 | 19 |
| GO:000838026 | Esophagus | HGIN | RNA splicing | 160/2587 | 434/18723 | 3.74e-34 | 1.12e-30 | 160 |
| GO:000640320 | Esophagus | HGIN | RNA localization | 66/2587 | 201/18723 | 4.06e-12 | 5.41e-10 | 66 |
| GO:000691319 | Esophagus | HGIN | nucleocytoplasmic transport | 83/2587 | 301/18723 | 2.14e-10 | 1.97e-08 | 83 |
| GO:005116919 | Esophagus | HGIN | nuclear transport | 83/2587 | 301/18723 | 2.14e-10 | 1.97e-08 | 83 |
| GO:005116819 | Esophagus | HGIN | nuclear export | 48/2587 | 154/18723 | 2.21e-08 | 1.34e-06 | 48 |
| Page: 1 2 3 4 5 6 7 8 9 |
| Pathway ID | Tissue | Disease Stage | Description | Gene Ratio | Bg Ratio | pvalue | p.adjust | qvalue | Count |
| hsa0304018 | Esophagus | HGIN | Spliceosome | 79/1383 | 217/8465 | 3.22e-13 | 7.00e-12 | 5.56e-12 | 79 |
| hsa030137 | Esophagus | HGIN | Nucleocytoplasmic transport | 31/1383 | 108/8465 | 8.29e-04 | 7.95e-03 | 6.31e-03 | 31 |
| hsa0304019 | Esophagus | HGIN | Spliceosome | 79/1383 | 217/8465 | 3.22e-13 | 7.00e-12 | 5.56e-12 | 79 |
| hsa0301312 | Esophagus | HGIN | Nucleocytoplasmic transport | 31/1383 | 108/8465 | 8.29e-04 | 7.95e-03 | 6.31e-03 | 31 |
| hsa0301321 | Esophagus | ESCC | Nucleocytoplasmic transport | 89/4205 | 108/8465 | 1.20e-12 | 2.37e-11 | 1.21e-11 | 89 |
| hsa0304027 | Esophagus | ESCC | Spliceosome | 128/4205 | 217/8465 | 3.31e-03 | 8.79e-03 | 4.50e-03 | 128 |
| hsa0301331 | Esophagus | ESCC | Nucleocytoplasmic transport | 89/4205 | 108/8465 | 1.20e-12 | 2.37e-11 | 1.21e-11 | 89 |
| hsa0304037 | Esophagus | ESCC | Spliceosome | 128/4205 | 217/8465 | 3.31e-03 | 8.79e-03 | 4.50e-03 | 128 |
| hsa030407 | Liver | Cirrhotic | Spliceosome | 102/2530 | 217/8465 | 5.69e-08 | 9.47e-07 | 5.84e-07 | 102 |
| hsa0304012 | Liver | Cirrhotic | Spliceosome | 102/2530 | 217/8465 | 5.69e-08 | 9.47e-07 | 5.84e-07 | 102 |
| hsa03013 | Liver | HCC | Nucleocytoplasmic transport | 81/4020 | 108/8465 | 4.28e-09 | 6.83e-08 | 3.80e-08 | 81 |
| hsa0304022 | Liver | HCC | Spliceosome | 122/4020 | 217/8465 | 5.55e-03 | 1.60e-02 | 8.91e-03 | 122 |
| hsa030131 | Liver | HCC | Nucleocytoplasmic transport | 81/4020 | 108/8465 | 4.28e-09 | 6.83e-08 | 3.80e-08 | 81 |
| hsa0304032 | Liver | HCC | Spliceosome | 122/4020 | 217/8465 | 5.55e-03 | 1.60e-02 | 8.91e-03 | 122 |
| hsa030136 | Oral cavity | OSCC | Nucleocytoplasmic transport | 82/3704 | 108/8465 | 7.93e-12 | 1.33e-10 | 6.77e-11 | 82 |
| hsa0304016 | Oral cavity | OSCC | Spliceosome | 123/3704 | 217/8465 | 7.21e-05 | 2.74e-04 | 1.40e-04 | 123 |
| hsa0301311 | Oral cavity | OSCC | Nucleocytoplasmic transport | 82/3704 | 108/8465 | 7.93e-12 | 1.33e-10 | 6.77e-11 | 82 |
| hsa0304017 | Oral cavity | OSCC | Spliceosome | 123/3704 | 217/8465 | 7.21e-05 | 2.74e-04 | 1.40e-04 | 123 |
| hsa0304026 | Oral cavity | LP | Spliceosome | 106/2418 | 217/8465 | 1.30e-10 | 2.40e-09 | 1.55e-09 | 106 |
| hsa030132 | Oral cavity | LP | Nucleocytoplasmic transport | 53/2418 | 108/8465 | 4.68e-06 | 4.10e-05 | 2.64e-05 | 53 |
| Page: 1 2 |
Top |
Cell-cell communication analysis |
| Identification of potential cell-cell interactions between two cell types and their ligand-receptor pairs for different disease states |
| Ligand | Receptor | LRpair | Pathway | Tissue | Disease Stage |
| Page: 1 |
Top |
Single-cell gene regulatory network inference analysis |
| Find out the significant the regulons (TFs) and the target genes of each regulon across cell types for different disease states |
| TF | Cell Type | Tissue | Disease Stage | Target Gene | RSS | Regulon Activity |
| ∗The dot plots of a searched regulon are shown for all cell subpopulations in each disease state of each tissue based on the regulon specific score inferred using pySCENIC and by calculating the average expression. |
| Page: 1 |
Top |
Somatic mutation of malignant transformation related genes |
| Annotation of somatic variants for genes involved in malignant transformation |
| Hugo Symbol | Variant Class | Variant Classification | dbSNP RS | HGVSc | HGVSp | HGVSp Short | SWISSPROT | BIOTYPE | SIFT | PolyPhen | Tumor Sample Barcode | Tissue | Histology | Sex | Age | Stage | Therapy Types | Drugs | Outcome |
| THOC3 | SNV | Missense_Mutation | rs750071730 | c.205N>T | p.Arg69Cys | p.R69C | Q96J01 | protein_coding | deleterious(0) | possibly_damaging(0.863) | TCGA-EK-A3GK-01 | Cervix | cervical & endocervical cancer | Female | <65 | I/II | Unknown | Unknown | SD |
| THOC3 | SNV | Missense_Mutation | c.45N>C | p.Gln15His | p.Q15H | Q96J01 | protein_coding | deleterious_low_confidence(0.01) | benign(0.084) | TCGA-IR-A3LH-01 | Cervix | cervical & endocervical cancer | Female | <65 | I/II | Chemotherapy | cisplatin | CR | |
| THOC3 | SNV | Missense_Mutation | c.205N>A | p.Arg69Ser | p.R69S | Q96J01 | protein_coding | deleterious(0.01) | benign(0.373) | TCGA-JW-A5VL-01 | Cervix | cervical & endocervical cancer | Female | <65 | I/II | Unknown | Unknown | SD | |
| THOC3 | SNV | Missense_Mutation | novel | c.392C>T | p.Thr131Ile | p.T131I | Q96J01 | protein_coding | tolerated(0.06) | benign(0.003) | TCGA-A6-A56B-01 | Colorectum | colon adenocarcinoma | Male | <65 | III/IV | Chemotherapy | fluorouracil | PD |
| THOC3 | SNV | Missense_Mutation | rs777994083 | c.941N>T | p.Ala314Val | p.A314V | Q96J01 | protein_coding | deleterious(0.01) | possibly_damaging(0.799) | TCGA-AA-A01P-01 | Colorectum | colon adenocarcinoma | Female | >=65 | III/IV | Unknown | Unknown | PD |
| THOC3 | SNV | Missense_Mutation | novel | c.1018N>A | p.Gly340Arg | p.G340R | Q96J01 | protein_coding | deleterious(0.03) | probably_damaging(1) | TCGA-AD-6548-01 | Colorectum | colon adenocarcinoma | Female | >=65 | I/II | Unknown | Unknown | SD |
| THOC3 | SNV | Missense_Mutation | c.374N>A | p.Arg125His | p.R125H | Q96J01 | protein_coding | deleterious(0) | probably_damaging(0.961) | TCGA-AY-6197-01 | Colorectum | colon adenocarcinoma | Male | <65 | I/II | Unknown | Unknown | SD | |
| THOC3 | SNV | Missense_Mutation | novel | c.611G>A | p.Gly204Asp | p.G204D | Q96J01 | protein_coding | deleterious(0.01) | benign(0.263) | TCGA-CM-4746-01 | Colorectum | colon adenocarcinoma | Male | <65 | I/II | Unknown | Unknown | SD |
| THOC3 | SNV | Missense_Mutation | c.1004G>T | p.Ser335Ile | p.S335I | Q96J01 | protein_coding | tolerated(0.18) | benign(0.127) | TCGA-AG-A002-01 | Colorectum | rectum adenocarcinoma | Male | <65 | I/II | Unknown | Unknown | SD | |
| THOC3 | SNV | Missense_Mutation | rs367977934 | c.559G>A | p.Glu187Lys | p.E187K | Q96J01 | protein_coding | deleterious(0) | possibly_damaging(0.521) | TCGA-AG-A002-01 | Colorectum | rectum adenocarcinoma | Male | <65 | I/II | Unknown | Unknown | SD |
| Page: 1 2 3 |
Top |
Related drugs of malignant transformation related genes |
| Identification of chemicals and drugs interact with genes involved in malignant transfromation |
| (DGIdb 4.0) |
| Entrez ID | Symbol | Category | Interaction Types | Drug Claim Name | Drug Name | PMIDs |
| Page: 1 |

Copyright 2023-Present -The University of Texas Health Science Center at Houston |