
|
|||||
|
 | |
| |
| |
| |
| |
| |
|
Gene: THOC1 |
Gene summary for THOC1 |
| Gene information | Species | Human | Gene symbol | THOC1 | Gene ID | 9984 |
| Gene name | THO complex 1 | |
| Gene Alias | HPR1 | |
| Cytomap | 18p11.32 | |
| Gene Type | protein-coding | GO ID | GO:0000018 | UniProtAcc | Q96FV9 |
Top |
Malignant transformation analysis |
| Identification of the aberrant gene expression in precancerous and cancerous lesions by comparing the gene expression of stem-like cells in diseased tissues with normal stem cells |
| Entrez ID | Symbol | Replicates | Species | Organ | Tissue | Adj P-value | Log2FC | Malignancy |
| 9984 | THOC1 | LZE2T | Human | Esophagus | ESCC | 9.76e-05 | 9.80e-01 | 0.082 |
| 9984 | THOC1 | LZE4T | Human | Esophagus | ESCC | 8.70e-05 | 1.06e-01 | 0.0811 |
| 9984 | THOC1 | LZE7T | Human | Esophagus | ESCC | 2.92e-05 | 2.97e-01 | 0.0667 |
| 9984 | THOC1 | LZE24T | Human | Esophagus | ESCC | 4.33e-14 | 2.37e-01 | 0.0596 |
| 9984 | THOC1 | LZE6T | Human | Esophagus | ESCC | 9.69e-06 | 3.91e-01 | 0.0845 |
| 9984 | THOC1 | P1T-E | Human | Esophagus | ESCC | 4.45e-03 | 1.17e-01 | 0.0875 |
| 9984 | THOC1 | P2T-E | Human | Esophagus | ESCC | 7.02e-26 | 4.33e-01 | 0.1177 |
| 9984 | THOC1 | P4T-E | Human | Esophagus | ESCC | 1.35e-16 | 3.62e-01 | 0.1323 |
| 9984 | THOC1 | P5T-E | Human | Esophagus | ESCC | 1.31e-19 | 3.72e-01 | 0.1327 |
| 9984 | THOC1 | P8T-E | Human | Esophagus | ESCC | 5.57e-25 | 1.43e-01 | 0.0889 |
| 9984 | THOC1 | P9T-E | Human | Esophagus | ESCC | 1.90e-06 | 1.28e-01 | 0.1131 |
| 9984 | THOC1 | P10T-E | Human | Esophagus | ESCC | 1.28e-17 | 1.87e-01 | 0.116 |
| 9984 | THOC1 | P11T-E | Human | Esophagus | ESCC | 1.31e-04 | 2.08e-01 | 0.1426 |
| 9984 | THOC1 | P12T-E | Human | Esophagus | ESCC | 4.30e-25 | 5.20e-01 | 0.1122 |
| 9984 | THOC1 | P15T-E | Human | Esophagus | ESCC | 4.71e-15 | 3.80e-01 | 0.1149 |
| 9984 | THOC1 | P16T-E | Human | Esophagus | ESCC | 3.81e-19 | 1.73e-01 | 0.1153 |
| 9984 | THOC1 | P19T-E | Human | Esophagus | ESCC | 2.51e-05 | 4.59e-01 | 0.1662 |
| 9984 | THOC1 | P20T-E | Human | Esophagus | ESCC | 2.77e-12 | 3.30e-01 | 0.1124 |
| 9984 | THOC1 | P21T-E | Human | Esophagus | ESCC | 1.57e-23 | 3.43e-01 | 0.1617 |
| 9984 | THOC1 | P22T-E | Human | Esophagus | ESCC | 9.75e-13 | 1.66e-01 | 0.1236 |
| Page: 1 2 3 4 5 |
| Tissue | Expression Dynamics | Abbreviation |
| Esophagus | 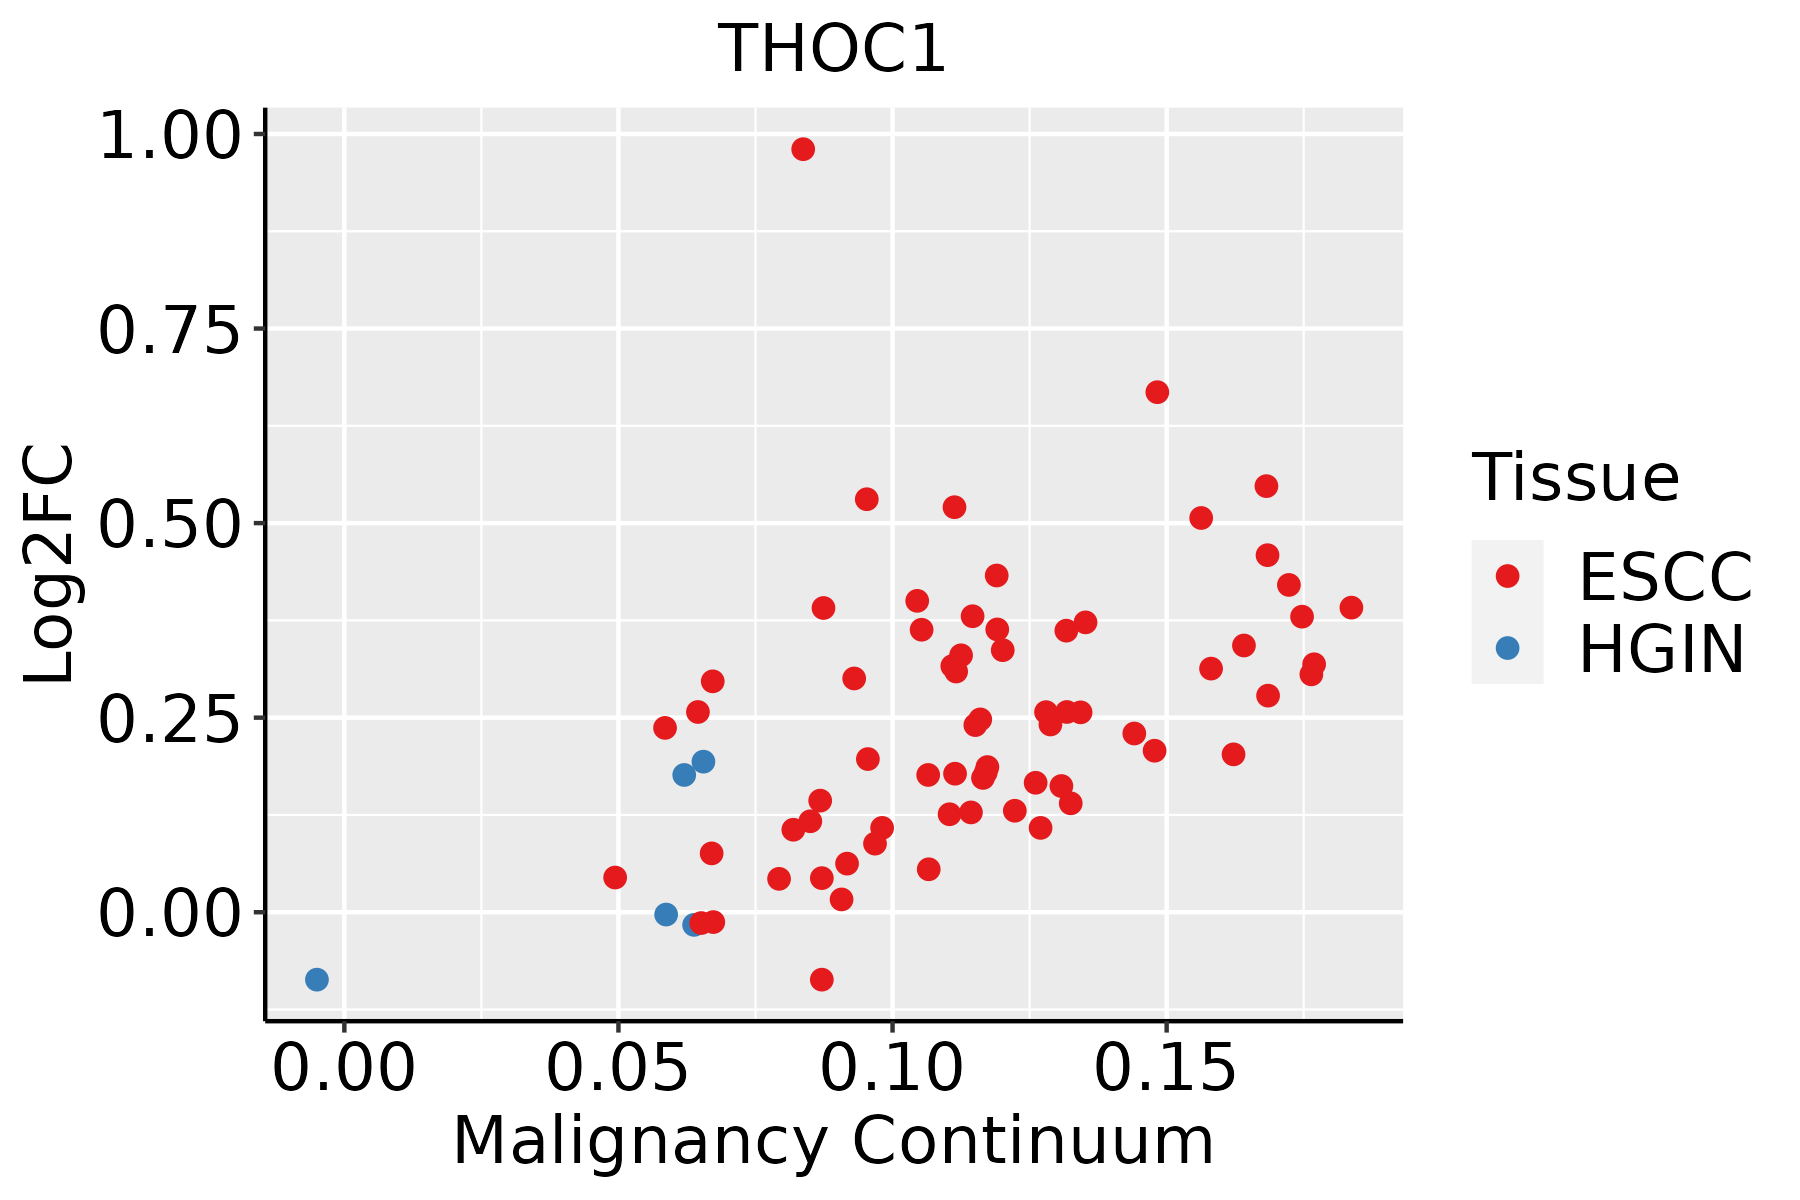 | ESCC: Esophageal squamous cell carcinoma |
| HGIN: High-grade intraepithelial neoplasias | ||
| LGIN: Low-grade intraepithelial neoplasias | ||
| Liver | 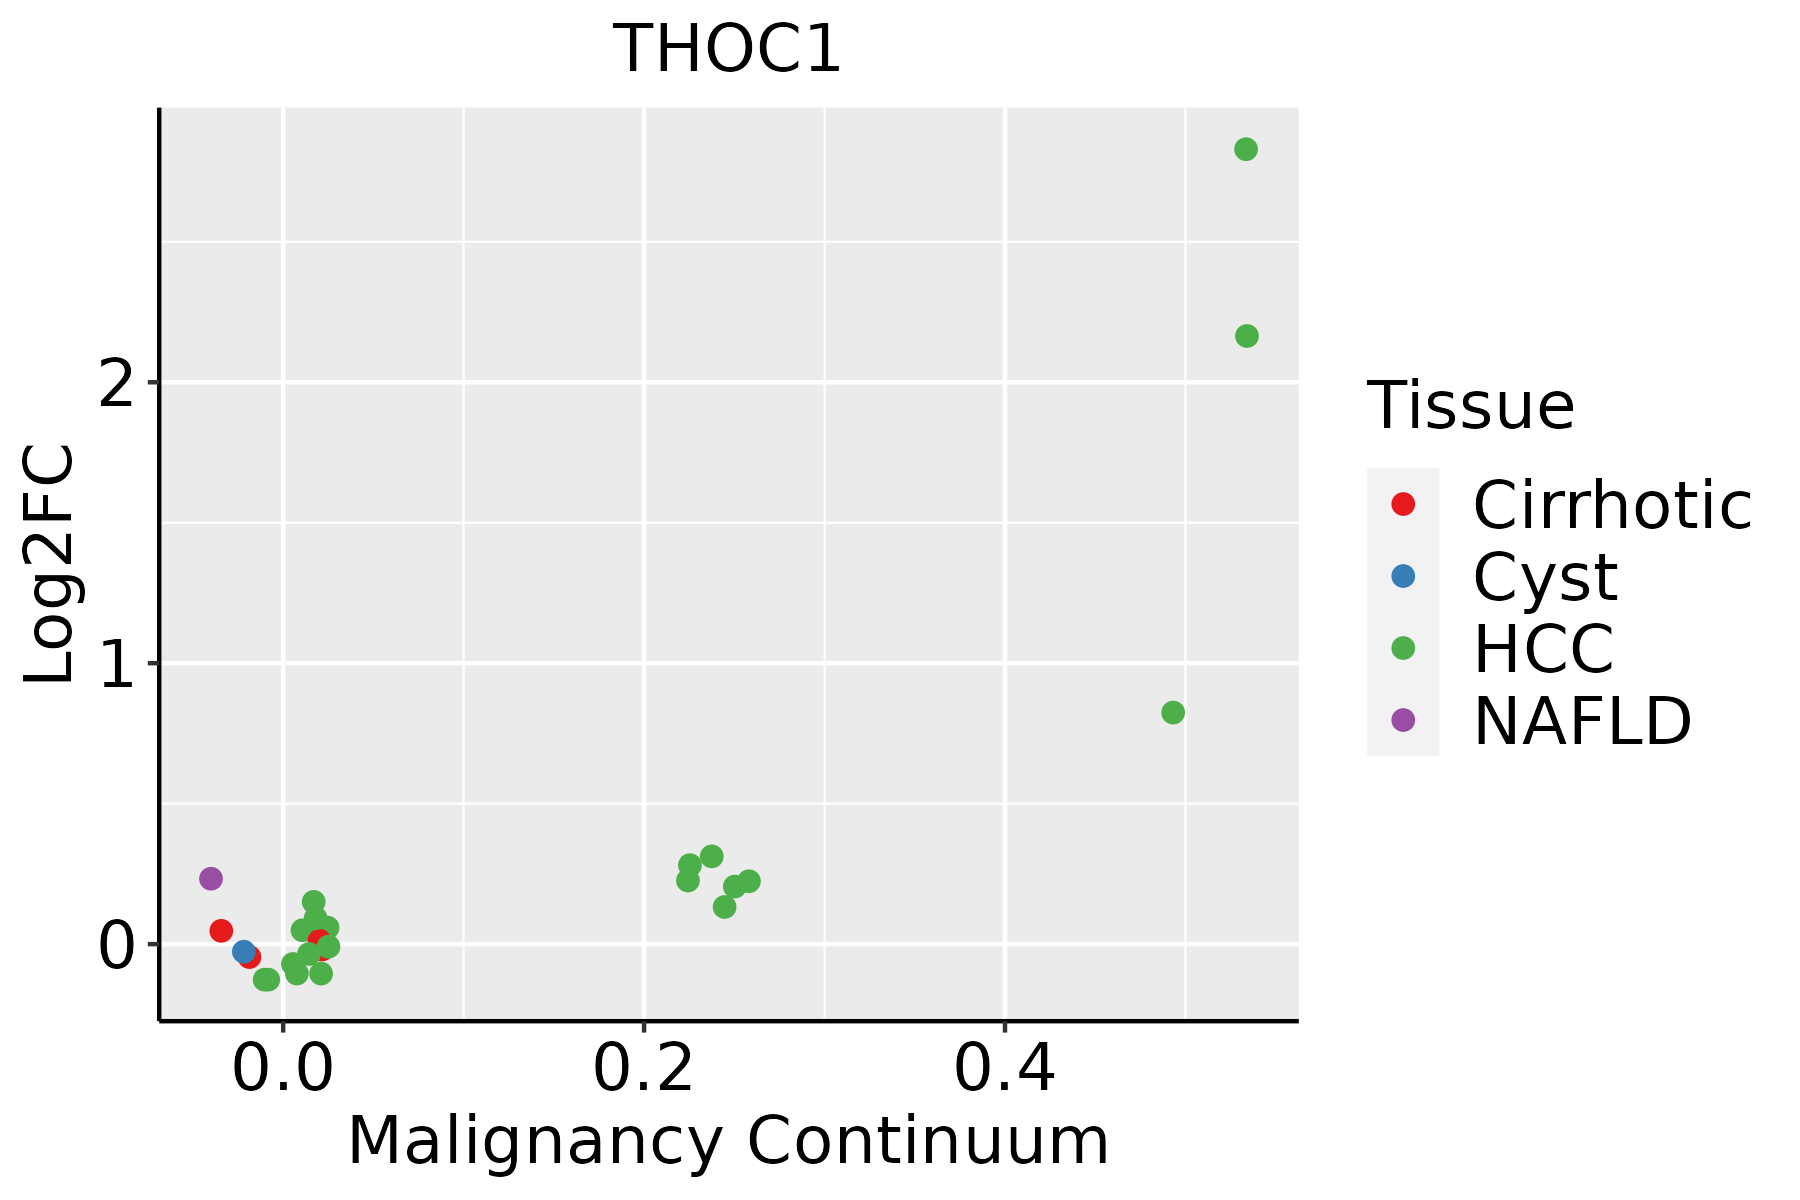 | HCC: Hepatocellular carcinoma |
| NAFLD: Non-alcoholic fatty liver disease | ||
| Thyroid |  | ATC: Anaplastic thyroid cancer |
| HT: Hashimoto's thyroiditis | ||
| PTC: Papillary thyroid cancer |
| ∗log2FC in expression of this searched gene in stem-like cells from each diseased tissue sample relative to stem-like cells in normal samples in each tissue plotted against the malignancy continuum. Samples are colored based on if they are from different disease stage. |
Top |
Malignant transformation related pathway analysis |
| Find out the enriched GO biological processes and KEGG pathways involved in transition from healthy to precancer to cancer |
| Tissue | Disease Stage | Enriched GO biological Processes |
| Colorectum | AD |  |
| Colorectum | SER |  |
| Colorectum | MSS |  |
| Colorectum | MSI-H |  |
| Colorectum | FAP |  |
| ∗Top 15 enriched GO BP terms are showed in the bar plot of each disease state in each tissue. Each row represents a significant GO biological process which is colored according to the -log10(p.adjust). |
| Page: 1 2 3 4 5 6 7 8 9 |
| GO ID | Tissue | Disease Stage | Description | Gene Ratio | Bg Ratio | pvalue | p.adjust | Count |
| GO:0008380111 | Esophagus | ESCC | RNA splicing | 336/8552 | 434/18723 | 1.74e-42 | 3.67e-39 | 336 |
| GO:0006913110 | Esophagus | ESCC | nucleocytoplasmic transport | 230/8552 | 301/18723 | 6.04e-28 | 2.02e-25 | 230 |
| GO:0051169110 | Esophagus | ESCC | nuclear transport | 230/8552 | 301/18723 | 6.04e-28 | 2.02e-25 | 230 |
| GO:0006403110 | Esophagus | ESCC | RNA localization | 166/8552 | 201/18723 | 1.95e-27 | 6.18e-25 | 166 |
| GO:005123617 | Esophagus | ESCC | establishment of RNA localization | 134/8552 | 166/18723 | 1.23e-20 | 1.81e-18 | 134 |
| GO:0051168110 | Esophagus | ESCC | nuclear export | 126/8552 | 154/18723 | 1.88e-20 | 2.65e-18 | 126 |
| GO:005102815 | Esophagus | ESCC | mRNA transport | 110/8552 | 130/18723 | 2.76e-20 | 3.80e-18 | 110 |
| GO:005065717 | Esophagus | ESCC | nucleic acid transport | 131/8552 | 163/18723 | 6.94e-20 | 8.46e-18 | 131 |
| GO:005065817 | Esophagus | ESCC | RNA transport | 131/8552 | 163/18723 | 6.94e-20 | 8.46e-18 | 131 |
| GO:001593117 | Esophagus | ESCC | nucleobase-containing compound transport | 162/8552 | 222/18723 | 9.87e-17 | 7.93e-15 | 162 |
| GO:00062604 | Esophagus | ESCC | DNA replication | 181/8552 | 260/18723 | 3.55e-15 | 2.05e-13 | 181 |
| GO:000635414 | Esophagus | ESCC | DNA-templated transcription, elongation | 76/8552 | 91/18723 | 8.35e-14 | 4.11e-12 | 76 |
| GO:005105215 | Esophagus | ESCC | regulation of DNA metabolic process | 232/8552 | 359/18723 | 2.40e-13 | 1.13e-11 | 232 |
| GO:007116612 | Esophagus | ESCC | ribonucleoprotein complex localization | 66/8552 | 77/18723 | 2.94e-13 | 1.38e-11 | 66 |
| GO:007142612 | Esophagus | ESCC | ribonucleoprotein complex export from nucleus | 65/8552 | 76/18723 | 5.56e-13 | 2.50e-11 | 65 |
| GO:000640512 | Esophagus | ESCC | RNA export from nucleus | 68/8552 | 84/18723 | 2.99e-11 | 1.01e-09 | 68 |
| GO:190198713 | Esophagus | ESCC | regulation of cell cycle phase transition | 242/8552 | 390/18723 | 3.86e-11 | 1.26e-09 | 242 |
| GO:00064064 | Esophagus | ESCC | mRNA export from nucleus | 51/8552 | 59/18723 | 7.98e-11 | 2.47e-09 | 51 |
| GO:00714274 | Esophagus | ESCC | mRNA-containing ribonucleoprotein complex export from nucleus | 51/8552 | 59/18723 | 7.98e-11 | 2.47e-09 | 51 |
| GO:0044403111 | Esophagus | ESCC | biological process involved in symbiotic interaction | 186/8552 | 290/18723 | 1.43e-10 | 4.16e-09 | 186 |
| Page: 1 2 3 4 5 6 7 8 9 |
| Pathway ID | Tissue | Disease Stage | Description | Gene Ratio | Bg Ratio | pvalue | p.adjust | qvalue | Count |
| hsa0301321 | Esophagus | ESCC | Nucleocytoplasmic transport | 89/4205 | 108/8465 | 1.20e-12 | 2.37e-11 | 1.21e-11 | 89 |
| hsa0304027 | Esophagus | ESCC | Spliceosome | 128/4205 | 217/8465 | 3.31e-03 | 8.79e-03 | 4.50e-03 | 128 |
| hsa0301331 | Esophagus | ESCC | Nucleocytoplasmic transport | 89/4205 | 108/8465 | 1.20e-12 | 2.37e-11 | 1.21e-11 | 89 |
| hsa0304037 | Esophagus | ESCC | Spliceosome | 128/4205 | 217/8465 | 3.31e-03 | 8.79e-03 | 4.50e-03 | 128 |
| hsa03013 | Liver | HCC | Nucleocytoplasmic transport | 81/4020 | 108/8465 | 4.28e-09 | 6.83e-08 | 3.80e-08 | 81 |
| hsa0304022 | Liver | HCC | Spliceosome | 122/4020 | 217/8465 | 5.55e-03 | 1.60e-02 | 8.91e-03 | 122 |
| hsa030131 | Liver | HCC | Nucleocytoplasmic transport | 81/4020 | 108/8465 | 4.28e-09 | 6.83e-08 | 3.80e-08 | 81 |
| hsa0304032 | Liver | HCC | Spliceosome | 122/4020 | 217/8465 | 5.55e-03 | 1.60e-02 | 8.91e-03 | 122 |
| Page: 1 |
Top |
Cell-cell communication analysis |
| Identification of potential cell-cell interactions between two cell types and their ligand-receptor pairs for different disease states |
| Ligand | Receptor | LRpair | Pathway | Tissue | Disease Stage |
| Page: 1 |
Top |
Single-cell gene regulatory network inference analysis |
| Find out the significant the regulons (TFs) and the target genes of each regulon across cell types for different disease states |
| TF | Cell Type | Tissue | Disease Stage | Target Gene | RSS | Regulon Activity |
| ∗The dot plots of a searched regulon are shown for all cell subpopulations in each disease state of each tissue based on the regulon specific score inferred using pySCENIC and by calculating the average expression. |
| Page: 1 |
Top |
Somatic mutation of malignant transformation related genes |
| Annotation of somatic variants for genes involved in malignant transformation |
| Hugo Symbol | Variant Class | Variant Classification | dbSNP RS | HGVSc | HGVSp | HGVSp Short | SWISSPROT | BIOTYPE | SIFT | PolyPhen | Tumor Sample Barcode | Tissue | Histology | Sex | Age | Stage | Therapy Types | Drugs | Outcome |
| THOC1 | SNV | Missense_Mutation | c.1516C>T | p.His506Tyr | p.H506Y | Q96FV9 | protein_coding | deleterious(0) | probably_damaging(0.998) | TCGA-AC-A23H-01 | Breast | breast invasive carcinoma | Female | >=65 | I/II | Unknown | Unknown | PD | |
| THOC1 | SNV | Missense_Mutation | c.1240N>T | p.Arg414Trp | p.R414W | Q96FV9 | protein_coding | deleterious(0) | benign(0.033) | TCGA-AN-A046-01 | Breast | breast invasive carcinoma | Female | >=65 | I/II | Unknown | Unknown | SD | |
| THOC1 | SNV | Missense_Mutation | c.757G>A | p.Glu253Lys | p.E253K | Q96FV9 | protein_coding | tolerated(0.36) | benign(0.015) | TCGA-AO-A0J9-01 | Breast | breast invasive carcinoma | Female | <65 | III/IV | Chemotherapy | cyclophosphamide | PD | |
| THOC1 | SNV | Missense_Mutation | c.419N>A | p.Cys140Tyr | p.C140Y | Q96FV9 | protein_coding | deleterious(0) | probably_damaging(0.999) | TCGA-B6-A0RL-01 | Breast | breast invasive carcinoma | Female | <65 | I/II | Unknown | Unknown | SD | |
| THOC1 | SNV | Missense_Mutation | novel | c.513N>C | p.Glu171Asp | p.E171D | Q96FV9 | protein_coding | deleterious(0.04) | probably_damaging(0.998) | TCGA-E2-A9RU-01 | Breast | breast invasive carcinoma | Female | >=65 | III/IV | Hormone Therapy | arimidex | SD |
| THOC1 | deletion | Frame_Shift_Del | c.1107delN | p.Asp370MetfsTer9 | p.D370Mfs*9 | Q96FV9 | protein_coding | TCGA-EW-A1IZ-01 | Breast | breast invasive carcinoma | Female | <65 | III/IV | Chemotherapy | taxotere | SD | |||
| THOC1 | SNV | Missense_Mutation | novel | c.685N>A | p.Pro229Thr | p.P229T | Q96FV9 | protein_coding | tolerated(0.08) | probably_damaging(0.999) | TCGA-2W-A8YY-01 | Cervix | cervical & endocervical cancer | Female | <65 | I/II | Chemotherapy | cisplatin | CR |
| THOC1 | SNV | Missense_Mutation | c.796N>C | p.Glu266Gln | p.E266Q | Q96FV9 | protein_coding | tolerated(0.07) | probably_damaging(0.977) | TCGA-DR-A0ZM-01 | Cervix | cervical & endocervical cancer | Female | <65 | III/IV | Unspecific | Cisplatin | SD | |
| THOC1 | SNV | Missense_Mutation | novel | c.71N>T | p.Ala24Val | p.A24V | Q96FV9 | protein_coding | deleterious(0.01) | probably_damaging(0.978) | TCGA-ZJ-AB0I-01 | Cervix | cervical & endocervical cancer | Female | <65 | I/II | Unknown | Unknown | SD |
| THOC1 | insertion | Frame_Shift_Ins | rs746975641 | c.144_145insA | p.Cys49MetfsTer4 | p.C49Mfs*4 | Q96FV9 | protein_coding | TCGA-2W-A8YY-01 | Cervix | cervical & endocervical cancer | Female | <65 | I/II | Chemotherapy | cisplatin | CR |
| Page: 1 2 3 4 5 6 7 8 |
Top |
Related drugs of malignant transformation related genes |
| Identification of chemicals and drugs interact with genes involved in malignant transfromation |
| (DGIdb 4.0) |
| Entrez ID | Symbol | Category | Interaction Types | Drug Claim Name | Drug Name | PMIDs |
| Page: 1 |

Copyright 2023-Present -The University of Texas Health Science Center at Houston |