
|
|||||
|
 | |
| |
| |
| |
| |
| |
|
Gene: THG1L |
Gene summary for THG1L |
| Gene information | Species | Human | Gene symbol | THG1L | Gene ID | 54974 |
| Gene name | tRNA-histidine guanylyltransferase 1 like | |
| Gene Alias | ICF45 | |
| Cytomap | 5q33.3 | |
| Gene Type | protein-coding | GO ID | GO:0000966 | UniProtAcc | B4E366 |
Top |
Malignant transformation analysis |
| Identification of the aberrant gene expression in precancerous and cancerous lesions by comparing the gene expression of stem-like cells in diseased tissues with normal stem cells |
| Entrez ID | Symbol | Replicates | Species | Organ | Tissue | Adj P-value | Log2FC | Malignancy |
| 54974 | THG1L | LZE4T | Human | Esophagus | ESCC | 5.21e-05 | 5.88e-02 | 0.0811 |
| 54974 | THG1L | LZE24T | Human | Esophagus | ESCC | 2.32e-09 | 1.87e-01 | 0.0596 |
| 54974 | THG1L | LZE21T | Human | Esophagus | ESCC | 7.91e-04 | 1.34e-01 | 0.0655 |
| 54974 | THG1L | LZE6T | Human | Esophagus | ESCC | 2.29e-03 | 1.16e-01 | 0.0845 |
| 54974 | THG1L | P2T-E | Human | Esophagus | ESCC | 6.00e-25 | 4.13e-01 | 0.1177 |
| 54974 | THG1L | P4T-E | Human | Esophagus | ESCC | 1.49e-19 | 2.73e-01 | 0.1323 |
| 54974 | THG1L | P5T-E | Human | Esophagus | ESCC | 1.03e-08 | 1.83e-01 | 0.1327 |
| 54974 | THG1L | P8T-E | Human | Esophagus | ESCC | 1.62e-07 | 1.11e-01 | 0.0889 |
| 54974 | THG1L | P9T-E | Human | Esophagus | ESCC | 7.80e-09 | 1.62e-01 | 0.1131 |
| 54974 | THG1L | P10T-E | Human | Esophagus | ESCC | 3.53e-08 | 1.58e-01 | 0.116 |
| 54974 | THG1L | P11T-E | Human | Esophagus | ESCC | 9.88e-15 | 5.46e-01 | 0.1426 |
| 54974 | THG1L | P12T-E | Human | Esophagus | ESCC | 4.16e-14 | 1.67e-01 | 0.1122 |
| 54974 | THG1L | P15T-E | Human | Esophagus | ESCC | 3.16e-15 | 2.48e-01 | 0.1149 |
| 54974 | THG1L | P16T-E | Human | Esophagus | ESCC | 2.84e-16 | 1.70e-01 | 0.1153 |
| 54974 | THG1L | P17T-E | Human | Esophagus | ESCC | 1.32e-05 | 2.42e-01 | 0.1278 |
| 54974 | THG1L | P19T-E | Human | Esophagus | ESCC | 6.84e-06 | 3.91e-01 | 0.1662 |
| 54974 | THG1L | P20T-E | Human | Esophagus | ESCC | 1.37e-08 | 1.72e-01 | 0.1124 |
| 54974 | THG1L | P21T-E | Human | Esophagus | ESCC | 4.18e-25 | 3.34e-01 | 0.1617 |
| 54974 | THG1L | P22T-E | Human | Esophagus | ESCC | 3.01e-13 | 1.37e-01 | 0.1236 |
| 54974 | THG1L | P23T-E | Human | Esophagus | ESCC | 1.38e-18 | 4.01e-01 | 0.108 |
| Page: 1 2 3 4 5 |
| Tissue | Expression Dynamics | Abbreviation |
| Esophagus | 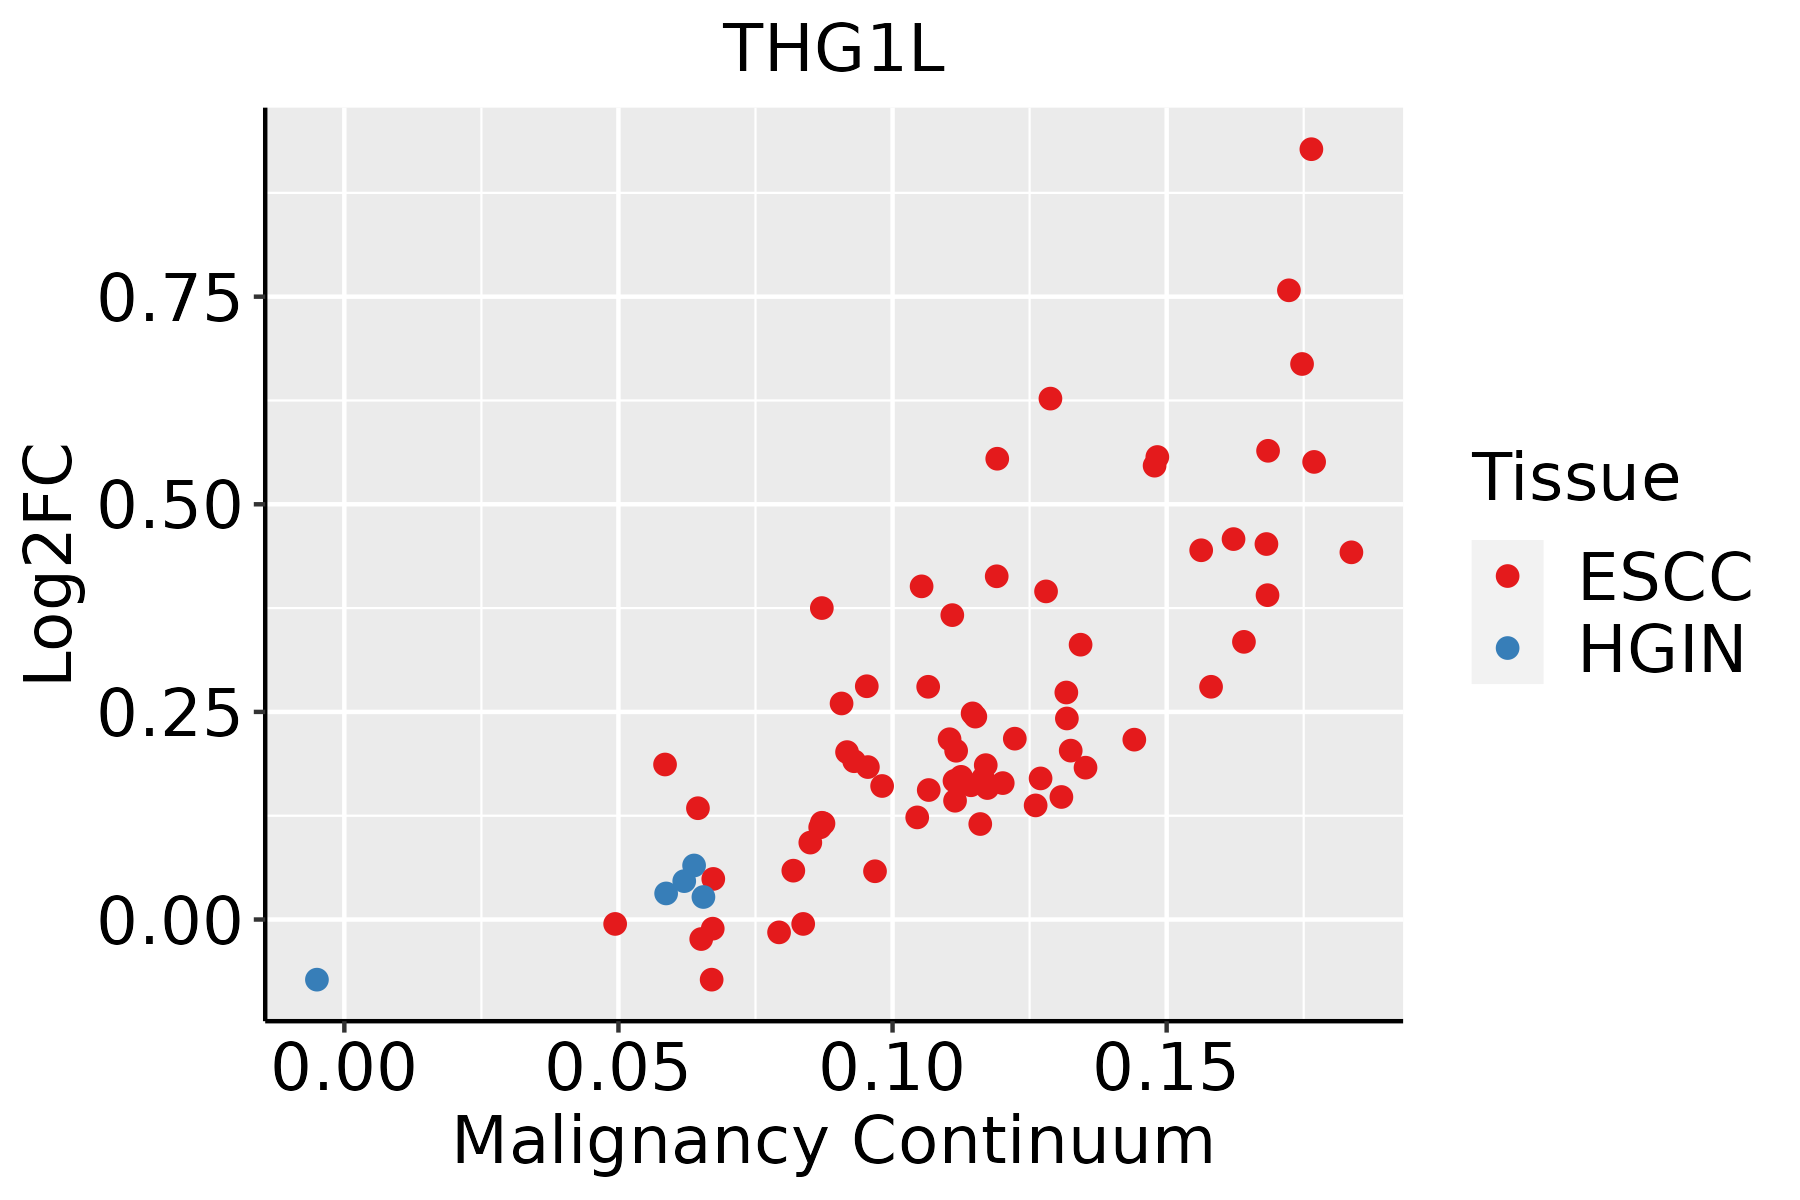 | ESCC: Esophageal squamous cell carcinoma |
| HGIN: High-grade intraepithelial neoplasias | ||
| LGIN: Low-grade intraepithelial neoplasias | ||
| Liver | 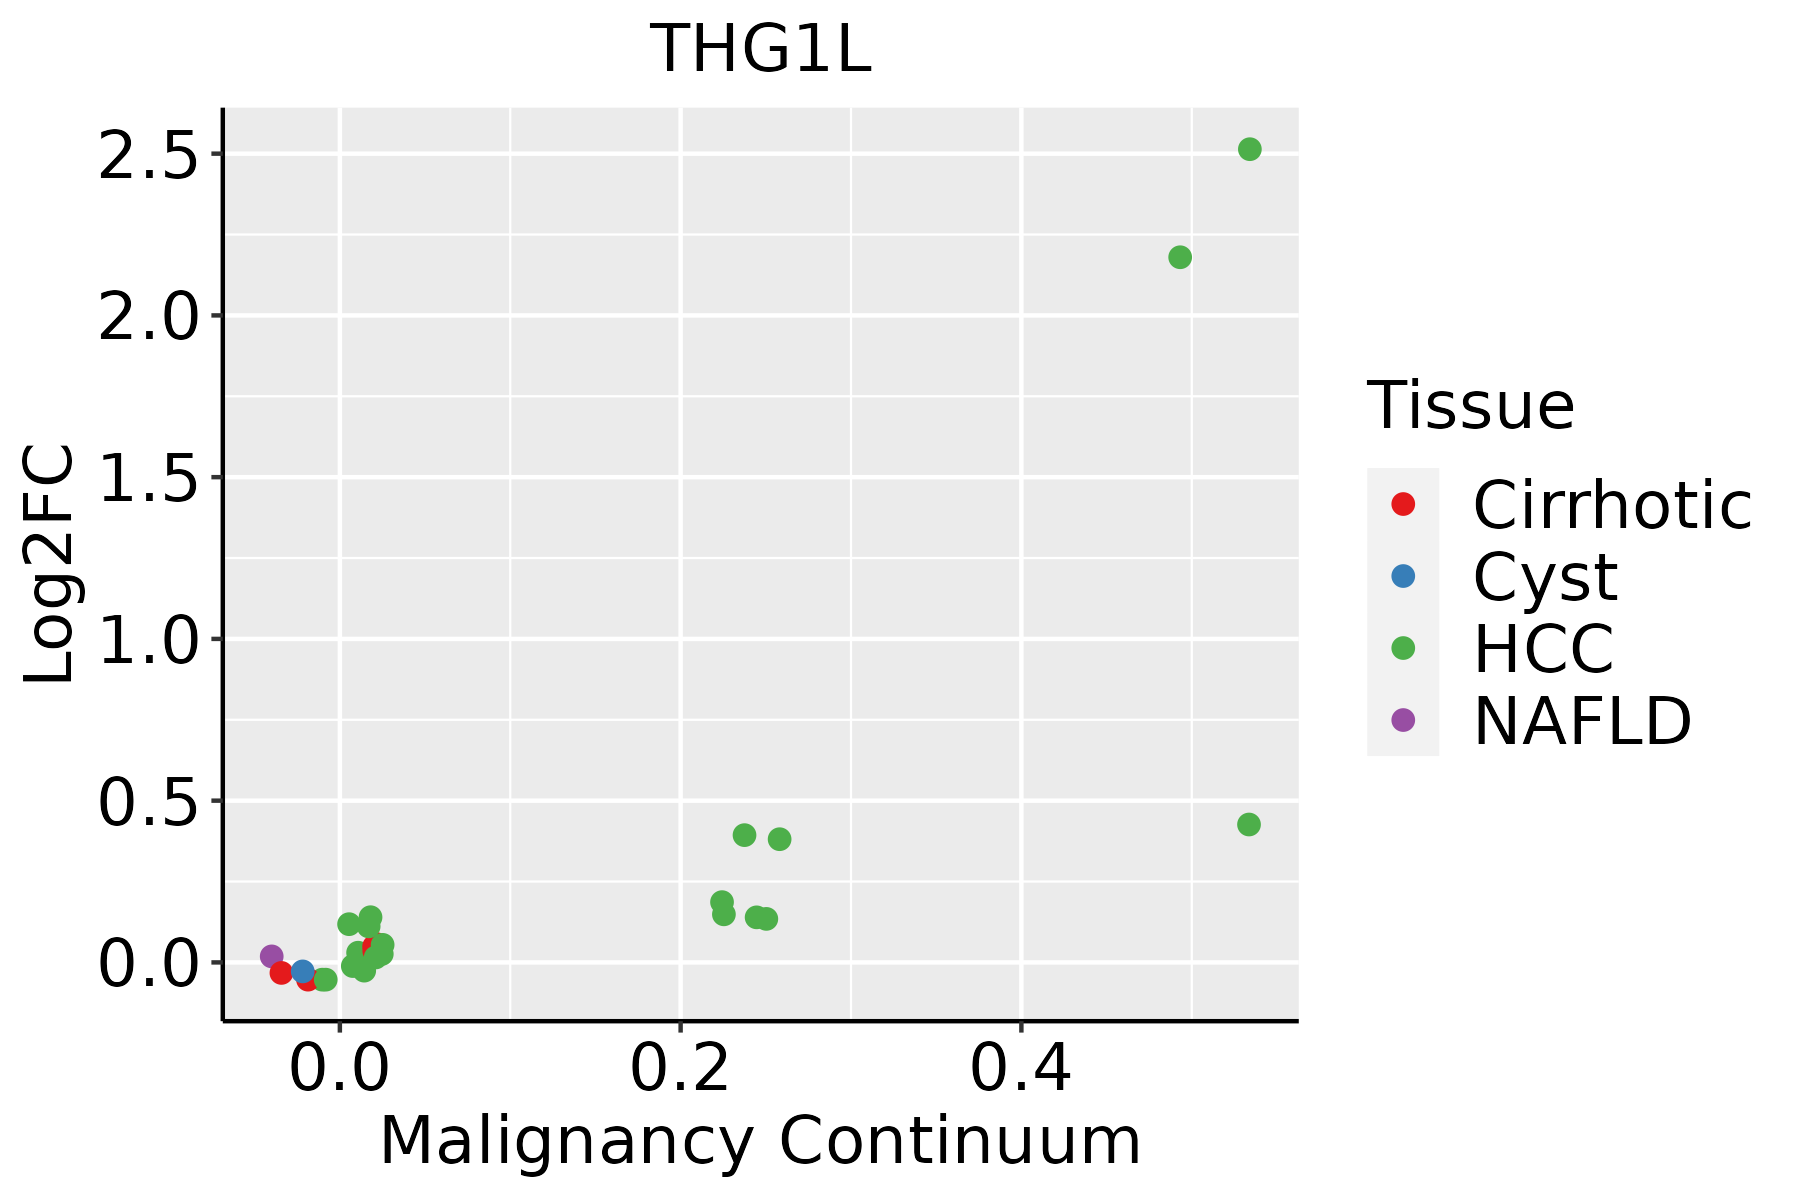 | HCC: Hepatocellular carcinoma |
| NAFLD: Non-alcoholic fatty liver disease | ||
| Oral Cavity |  | EOLP: Erosive Oral lichen planus |
| LP: leukoplakia | ||
| NEOLP: Non-erosive oral lichen planus | ||
| OSCC: Oral squamous cell carcinoma | ||
| Thyroid |  | ATC: Anaplastic thyroid cancer |
| HT: Hashimoto's thyroiditis | ||
| PTC: Papillary thyroid cancer |
| ∗log2FC in expression of this searched gene in stem-like cells from each diseased tissue sample relative to stem-like cells in normal samples in each tissue plotted against the malignancy continuum. Samples are colored based on if they are from different disease stage. |
Top |
Malignant transformation related pathway analysis |
| Find out the enriched GO biological processes and KEGG pathways involved in transition from healthy to precancer to cancer |
| Tissue | Disease Stage | Enriched GO biological Processes |
| Colorectum | AD |  |
| Colorectum | SER |  |
| Colorectum | MSS |  |
| Colorectum | MSI-H |  |
| Colorectum | FAP |  |
| ∗Top 15 enriched GO BP terms are showed in the bar plot of each disease state in each tissue. Each row represents a significant GO biological process which is colored according to the -log10(p.adjust). |
| Page: 1 2 3 4 5 6 7 8 9 |
| GO ID | Tissue | Disease Stage | Description | Gene Ratio | Bg Ratio | pvalue | p.adjust | Count |
| GO:003447015 | Esophagus | ESCC | ncRNA processing | 300/8552 | 395/18723 | 3.09e-35 | 3.26e-32 | 300 |
| GO:003466012 | Esophagus | ESCC | ncRNA metabolic process | 346/8552 | 485/18723 | 4.35e-31 | 2.51e-28 | 346 |
| GO:0006979111 | Esophagus | ESCC | response to oxidative stress | 303/8552 | 446/18723 | 7.15e-22 | 1.30e-19 | 303 |
| GO:00080333 | Esophagus | ESCC | tRNA processing | 92/8552 | 127/18723 | 7.83e-10 | 1.93e-08 | 92 |
| GO:00063992 | Esophagus | ESCC | tRNA metabolic process | 122/8552 | 179/18723 | 9.03e-10 | 2.19e-08 | 122 |
| GO:00094512 | Esophagus | ESCC | RNA modification | 114/8552 | 167/18723 | 2.76e-09 | 6.04e-08 | 114 |
| GO:00482844 | Esophagus | ESCC | organelle fusion | 94/8552 | 141/18723 | 3.72e-07 | 5.16e-06 | 94 |
| GO:00064002 | Esophagus | ESCC | tRNA modification | 62/8552 | 90/18723 | 7.02e-06 | 7.04e-05 | 62 |
| GO:00344713 | Esophagus | ESCC | ncRNA 5'-end processing | 18/8552 | 21/18723 | 1.81e-04 | 1.16e-03 | 18 |
| GO:00009663 | Esophagus | ESCC | RNA 5'-end processing | 19/8552 | 23/18723 | 3.12e-04 | 1.85e-03 | 19 |
| GO:00991163 | Esophagus | ESCC | tRNA 5'-end processing | 14/8552 | 16/18723 | 6.78e-04 | 3.56e-03 | 14 |
| GO:00512623 | Esophagus | ESCC | protein tetramerization | 54/8552 | 87/18723 | 1.50e-03 | 7.06e-03 | 54 |
| GO:00080532 | Esophagus | ESCC | mitochondrial fusion | 20/8552 | 27/18723 | 2.61e-03 | 1.11e-02 | 20 |
| GO:00512592 | Esophagus | ESCC | protein complex oligomerization | 130/8552 | 238/18723 | 3.29e-03 | 1.36e-02 | 130 |
| GO:00344702 | Liver | HCC | ncRNA processing | 293/7958 | 395/18723 | 4.26e-38 | 6.76e-35 | 293 |
| GO:00346601 | Liver | HCC | ncRNA metabolic process | 332/7958 | 485/18723 | 1.48e-31 | 7.80e-29 | 332 |
| GO:000697922 | Liver | HCC | response to oxidative stress | 281/7958 | 446/18723 | 9.75e-19 | 1.24e-16 | 281 |
| GO:0008033 | Liver | HCC | tRNA processing | 87/7958 | 127/18723 | 2.66e-09 | 7.23e-08 | 87 |
| GO:0006399 | Liver | HCC | tRNA metabolic process | 108/7958 | 179/18723 | 1.07e-06 | 1.59e-05 | 108 |
| GO:0009451 | Liver | HCC | RNA modification | 101/7958 | 167/18723 | 2.02e-06 | 2.78e-05 | 101 |
| Page: 1 2 3 |
| Pathway ID | Tissue | Disease Stage | Description | Gene Ratio | Bg Ratio | pvalue | p.adjust | qvalue | Count |
| Page: 1 |
Top |
Cell-cell communication analysis |
| Identification of potential cell-cell interactions between two cell types and their ligand-receptor pairs for different disease states |
| Ligand | Receptor | LRpair | Pathway | Tissue | Disease Stage |
| Page: 1 |
Top |
Single-cell gene regulatory network inference analysis |
| Find out the significant the regulons (TFs) and the target genes of each regulon across cell types for different disease states |
| TF | Cell Type | Tissue | Disease Stage | Target Gene | RSS | Regulon Activity |
| ∗The dot plots of a searched regulon are shown for all cell subpopulations in each disease state of each tissue based on the regulon specific score inferred using pySCENIC and by calculating the average expression. |
| Page: 1 |
Top |
Somatic mutation of malignant transformation related genes |
| Annotation of somatic variants for genes involved in malignant transformation |
| Hugo Symbol | Variant Class | Variant Classification | dbSNP RS | HGVSc | HGVSp | HGVSp Short | SWISSPROT | BIOTYPE | SIFT | PolyPhen | Tumor Sample Barcode | Tissue | Histology | Sex | Age | Stage | Therapy Types | Drugs | Outcome |
| THG1L | SNV | Missense_Mutation | novel | c.535G>A | p.Asp179Asn | p.D179N | Q9NWX6 | protein_coding | deleterious(0) | probably_damaging(0.986) | TCGA-C8-A8HQ-01 | Breast | breast invasive carcinoma | Female | <65 | I/II | Unknown | Unknown | SD |
| THG1L | SNV | Missense_Mutation | c.191N>C | p.Arg64Pro | p.R64P | Q9NWX6 | protein_coding | deleterious(0) | probably_damaging(0.949) | TCGA-E9-A1R5-01 | Breast | breast invasive carcinoma | Female | <65 | I/II | Hormone Therapy | tamoxiphen | SD | |
| THG1L | insertion | Nonsense_Mutation | novel | c.616_617insTAACGCGGTAGCCAATGAGTGC | p.Gly206ValfsTer4 | p.G206Vfs*4 | Q9NWX6 | protein_coding | TCGA-A2-A0EM-01 | Breast | breast invasive carcinoma | Female | >=65 | I/II | Hormone Therapy | tamoxiphen | SD | ||
| THG1L | SNV | Missense_Mutation | c.569N>C | p.Phe190Ser | p.F190S | Q9NWX6 | protein_coding | deleterious(0) | probably_damaging(0.974) | TCGA-FU-A3HZ-01 | Cervix | cervical & endocervical cancer | Female | <65 | I/II | Chemotherapy | cisplatin | CR | |
| THG1L | SNV | Missense_Mutation | novel | c.742N>A | p.Glu248Lys | p.E248K | Q9NWX6 | protein_coding | tolerated(0.07) | benign(0.332) | TCGA-IR-A3LL-01 | Cervix | cervical & endocervical cancer | Female | <65 | I/II | Chemotherapy | cisplatin | CR |
| THG1L | SNV | Missense_Mutation | c.488N>G | p.Tyr163Cys | p.Y163C | Q9NWX6 | protein_coding | deleterious(0) | probably_damaging(0.999) | TCGA-AA-3811-01 | Colorectum | colon adenocarcinoma | Female | >=65 | III/IV | Unknown | Unknown | PD | |
| THG1L | SNV | Missense_Mutation | novel | c.697C>T | p.Pro233Ser | p.P233S | Q9NWX6 | protein_coding | tolerated(0.48) | benign(0.003) | TCGA-AA-3950-01 | Colorectum | colon adenocarcinoma | Female | >=65 | I/II | Unknown | Unknown | SD |
| THG1L | SNV | Missense_Mutation | novel | c.83N>T | p.Ala28Val | p.A28V | Q9NWX6 | protein_coding | tolerated(0.27) | benign(0) | TCGA-G4-6304-01 | Colorectum | colon adenocarcinoma | Female | >=65 | I/II | Chemotherapy | fluorouracil | PD |
| THG1L | SNV | Missense_Mutation | rs201525305 | c.176G>A | p.Gly59Asp | p.G59D | Q9NWX6 | protein_coding | deleterious(0) | probably_damaging(1) | TCGA-G4-6586-01 | Colorectum | colon adenocarcinoma | Female | >=65 | I/II | Unknown | Unknown | SD |
| THG1L | deletion | Frame_Shift_Del | c.20_24delTTAAG | p.Val7GlyfsTer36 | p.V7Gfs*36 | Q9NWX6 | protein_coding | TCGA-CK-6747-01 | Colorectum | colon adenocarcinoma | Female | >=65 | I/II | Unknown | Unknown | SD |
| Page: 1 2 3 |
Top |
Related drugs of malignant transformation related genes |
| Identification of chemicals and drugs interact with genes involved in malignant transfromation |
| (DGIdb 4.0) |
| Entrez ID | Symbol | Category | Interaction Types | Drug Claim Name | Drug Name | PMIDs |
| Page: 1 |

Copyright 2023-Present -The University of Texas Health Science Center at Houston |