
|
|||||
|
 | |
| |
| |
| |
| |
| |
|
Gene: THBS4 |
Gene summary for THBS4 |
| Gene information | Species | Human | Gene symbol | THBS4 | Gene ID | 7060 |
| Gene name | thrombospondin 4 | |
| Gene Alias | TSP-4 | |
| Cytomap | 5q14.1 | |
| Gene Type | protein-coding | GO ID | GO:0001525 | UniProtAcc | E7ES19 |
Top |
Malignant transformation analysis |
| Identification of the aberrant gene expression in precancerous and cancerous lesions by comparing the gene expression of stem-like cells in diseased tissues with normal stem cells |
| Entrez ID | Symbol | Replicates | Species | Organ | Tissue | Adj P-value | Log2FC | Malignancy |
| 7060 | THBS4 | Pt13.a | Human | Liver | HCC | 4.80e-13 | 4.81e-01 | 0.021 |
| 7060 | THBS4 | Pt13.b | Human | Liver | HCC | 6.89e-37 | 1.01e+00 | 0.0251 |
| 7060 | THBS4 | Pt13.c | Human | Liver | HCC | 7.21e-07 | 5.39e-01 | 0.0076 |
| 7060 | THBS4 | C46 | Human | Oral cavity | OSCC | 2.16e-10 | 3.64e-01 | 0.1673 |
| 7060 | THBS4 | LN22 | Human | Oral cavity | OSCC | 5.62e-05 | 5.14e-01 | 0.1733 |
| 7060 | THBS4 | LN46 | Human | Oral cavity | OSCC | 5.39e-09 | 1.67e-01 | 0.1666 |
| 7060 | THBS4 | LP17 | Human | Oral cavity | LP | 1.77e-02 | 5.22e-01 | 0.2349 |
| Page: 1 |
| Tissue | Expression Dynamics | Abbreviation |
| Liver | 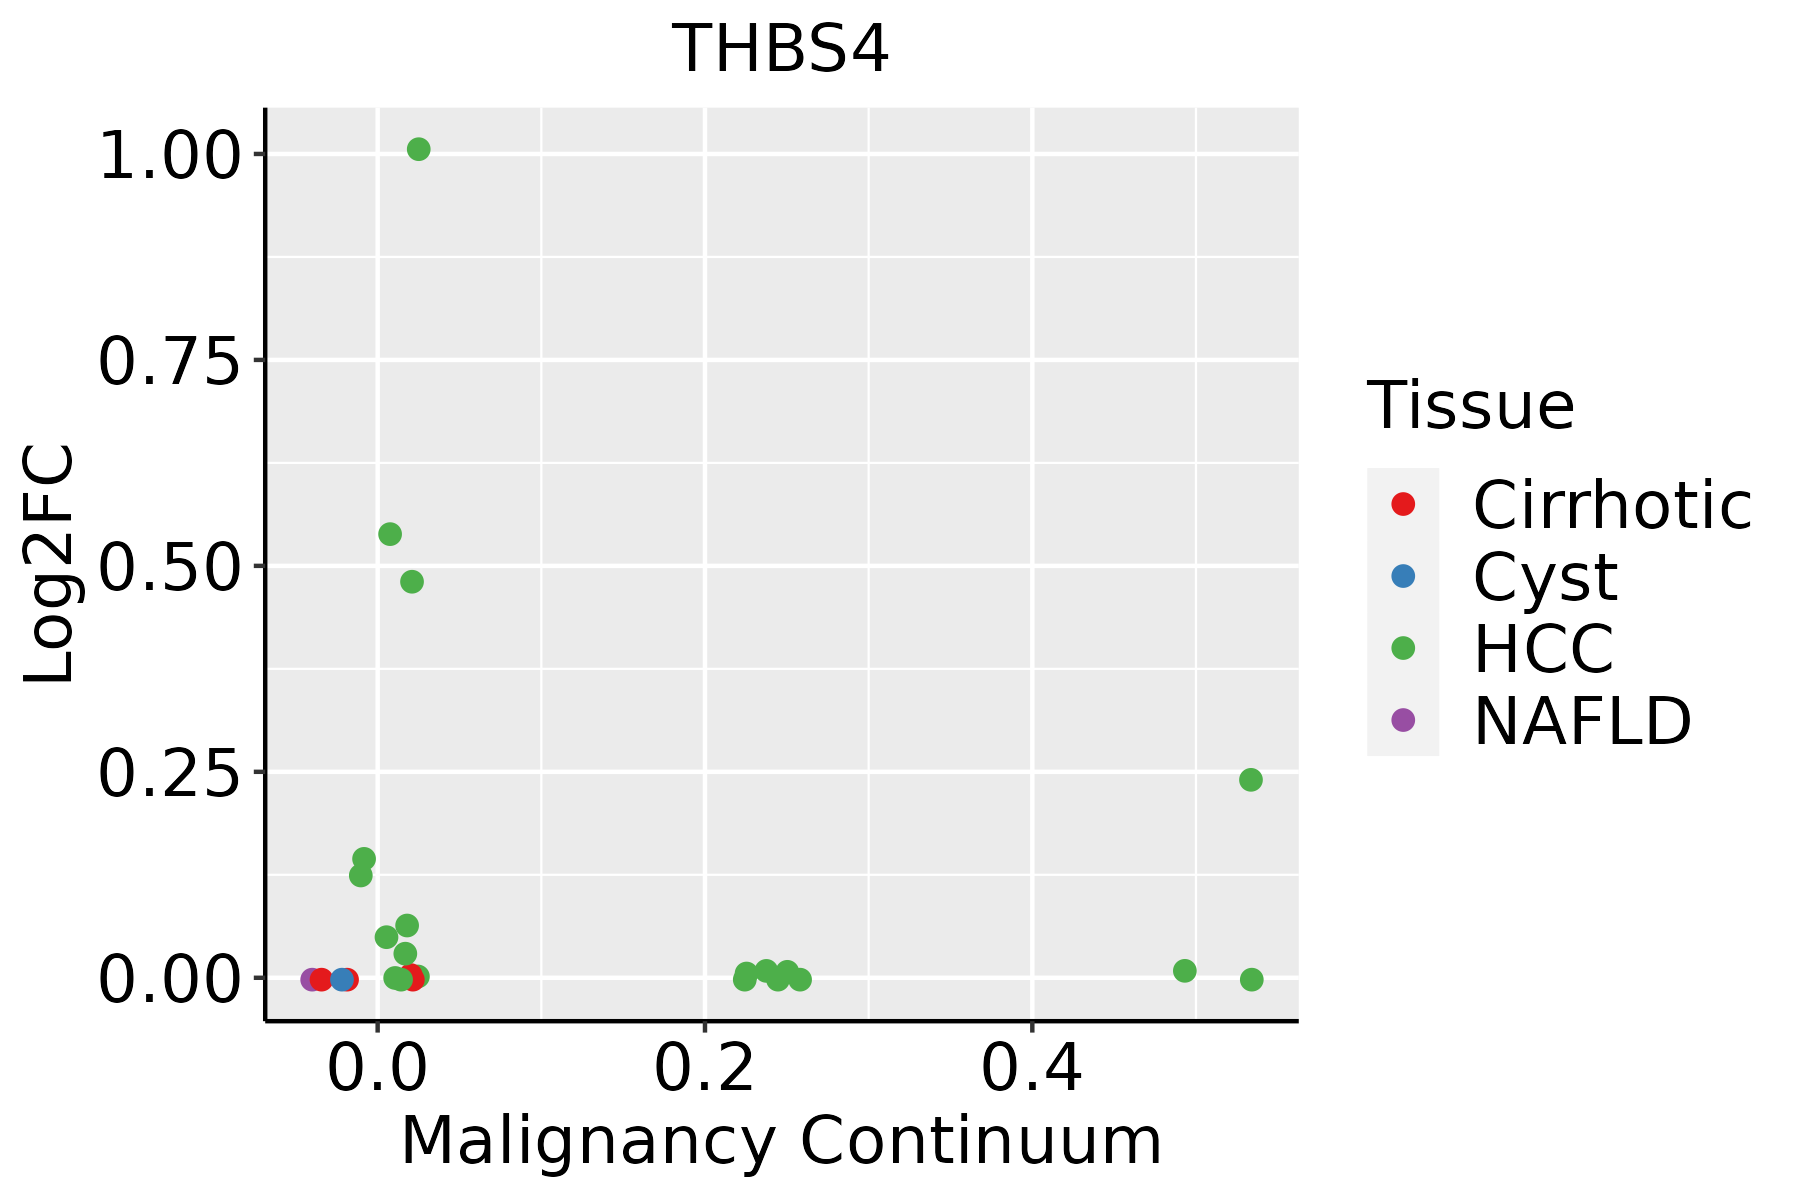 | HCC: Hepatocellular carcinoma |
| NAFLD: Non-alcoholic fatty liver disease | ||
| Oral Cavity | 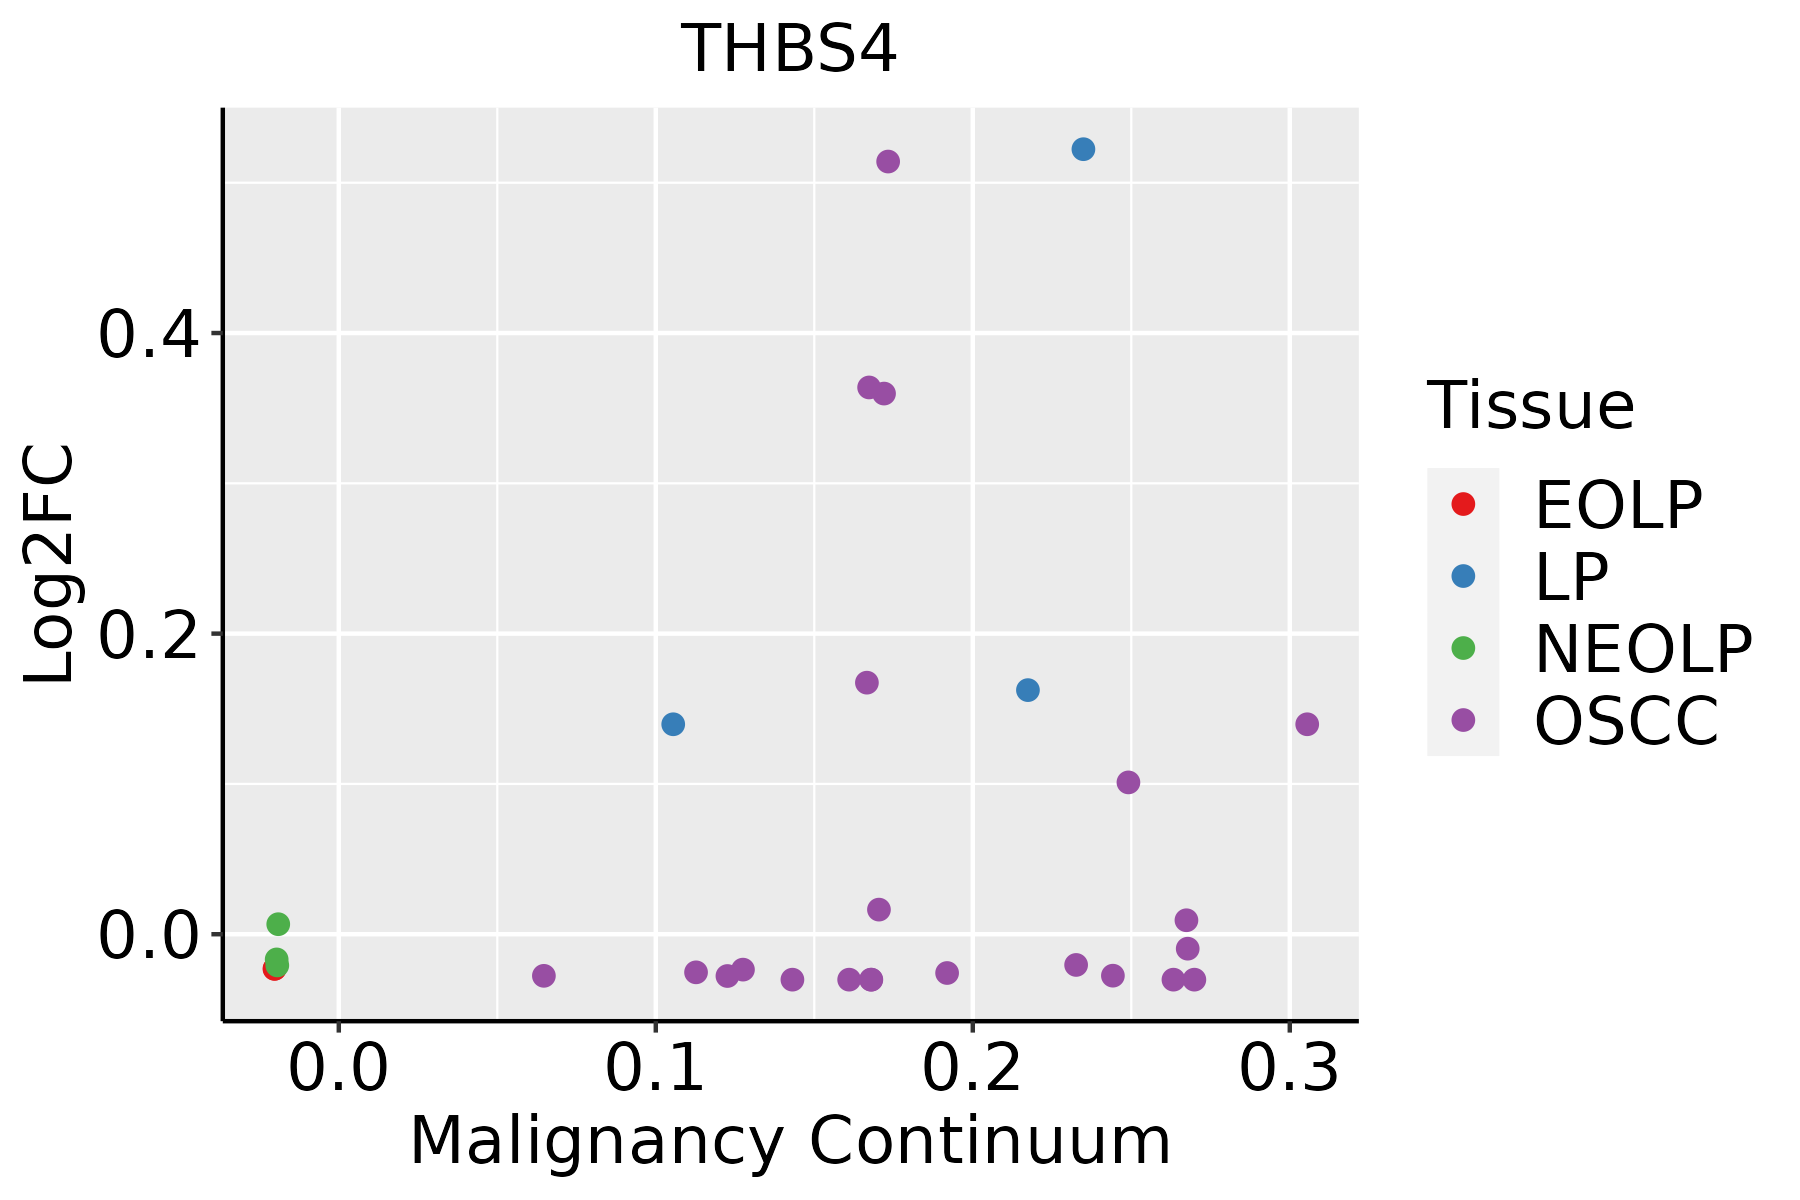 | EOLP: Erosive Oral lichen planus |
| LP: leukoplakia | ||
| NEOLP: Non-erosive oral lichen planus | ||
| OSCC: Oral squamous cell carcinoma |
| ∗log2FC in expression of this searched gene in stem-like cells from each diseased tissue sample relative to stem-like cells in normal samples in each tissue plotted against the malignancy continuum. Samples are colored based on if they are from different disease stage. |
Top |
Malignant transformation related pathway analysis |
| Find out the enriched GO biological processes and KEGG pathways involved in transition from healthy to precancer to cancer |
| Tissue | Disease Stage | Enriched GO biological Processes |
| Colorectum | AD |  |
| Colorectum | SER |  |
| Colorectum | MSS |  |
| Colorectum | MSI-H |  |
| Colorectum | FAP |  |
| ∗Top 15 enriched GO BP terms are showed in the bar plot of each disease state in each tissue. Each row represents a significant GO biological process which is colored according to the -log10(p.adjust). |
| Page: 1 2 3 4 5 6 7 8 9 |
| GO ID | Tissue | Disease Stage | Description | Gene Ratio | Bg Ratio | pvalue | p.adjust | Count |
| GO:003497612 | Liver | HCC | response to endoplasmic reticulum stress | 189/7958 | 256/18723 | 1.43e-24 | 4.06e-22 | 189 |
| GO:003596612 | Liver | HCC | response to topologically incorrect protein | 123/7958 | 159/18723 | 2.60e-19 | 3.44e-17 | 123 |
| GO:000698612 | Liver | HCC | response to unfolded protein | 103/7958 | 137/18723 | 6.50e-15 | 4.48e-13 | 103 |
| GO:003497620 | Oral cavity | OSCC | response to endoplasmic reticulum stress | 178/7305 | 256/18723 | 2.59e-23 | 6.06e-21 | 178 |
| GO:003596620 | Oral cavity | OSCC | response to topologically incorrect protein | 117/7305 | 159/18723 | 6.93e-19 | 8.60e-17 | 117 |
| GO:000698620 | Oral cavity | OSCC | response to unfolded protein | 103/7305 | 137/18723 | 6.47e-18 | 6.50e-16 | 103 |
| GO:000268714 | Oral cavity | OSCC | positive regulation of leukocyte migration | 78/7305 | 135/18723 | 7.43e-06 | 8.08e-05 | 78 |
| GO:005067310 | Oral cavity | OSCC | epithelial cell proliferation | 212/7305 | 437/18723 | 2.82e-05 | 2.61e-04 | 212 |
| GO:000268510 | Oral cavity | OSCC | regulation of leukocyte migration | 108/7305 | 210/18723 | 1.63e-04 | 1.13e-03 | 108 |
| GO:00321037 | Oral cavity | OSCC | positive regulation of response to external stimulus | 203/7305 | 427/18723 | 1.79e-04 | 1.22e-03 | 203 |
| GO:00509216 | Oral cavity | OSCC | positive regulation of chemotaxis | 76/7305 | 141/18723 | 2.30e-04 | 1.49e-03 | 76 |
| GO:00182123 | Oral cavity | OSCC | peptidyl-tyrosine modification | 180/7305 | 378/18723 | 3.63e-04 | 2.22e-03 | 180 |
| GO:005090010 | Oral cavity | OSCC | leukocyte migration | 176/7305 | 369/18723 | 3.80e-04 | 2.31e-03 | 176 |
| GO:00026908 | Oral cavity | OSCC | positive regulation of leukocyte chemotaxis | 53/7305 | 94/18723 | 4.71e-04 | 2.79e-03 | 53 |
| GO:005067810 | Oral cavity | OSCC | regulation of epithelial cell proliferation | 180/7305 | 381/18723 | 5.88e-04 | 3.35e-03 | 180 |
| GO:0050730 | Oral cavity | OSCC | regulation of peptidyl-tyrosine phosphorylation | 129/7305 | 264/18723 | 6.70e-04 | 3.75e-03 | 129 |
| GO:00181083 | Oral cavity | OSCC | peptidyl-tyrosine phosphorylation | 177/7305 | 375/18723 | 6.86e-04 | 3.83e-03 | 177 |
| GO:00603269 | Oral cavity | OSCC | cell chemotaxis | 146/7305 | 310/18723 | 2.13e-03 | 9.80e-03 | 146 |
| GO:00513024 | Oral cavity | OSCC | regulation of cell division | 87/7305 | 177/18723 | 3.75e-03 | 1.55e-02 | 87 |
| GO:00305959 | Oral cavity | OSCC | leukocyte chemotaxis | 110/7305 | 230/18723 | 3.86e-03 | 1.58e-02 | 110 |
| Page: 1 2 |
| Pathway ID | Tissue | Disease Stage | Description | Gene Ratio | Bg Ratio | pvalue | p.adjust | qvalue | Count |
| hsa0451041 | Liver | HCC | Focal adhesion | 125/4020 | 203/8465 | 3.12e-05 | 1.88e-04 | 1.04e-04 | 125 |
| hsa051652 | Liver | HCC | Human papillomavirus infection | 188/4020 | 331/8465 | 3.34e-04 | 1.49e-03 | 8.29e-04 | 188 |
| hsa0414521 | Liver | HCC | Phagosome | 93/4020 | 152/8465 | 4.27e-04 | 1.88e-03 | 1.05e-03 | 93 |
| hsa0451051 | Liver | HCC | Focal adhesion | 125/4020 | 203/8465 | 3.12e-05 | 1.88e-04 | 1.04e-04 | 125 |
| hsa051653 | Liver | HCC | Human papillomavirus infection | 188/4020 | 331/8465 | 3.34e-04 | 1.49e-03 | 8.29e-04 | 188 |
| hsa0414531 | Liver | HCC | Phagosome | 93/4020 | 152/8465 | 4.27e-04 | 1.88e-03 | 1.05e-03 | 93 |
| hsa0414528 | Oral cavity | OSCC | Phagosome | 88/3704 | 152/8465 | 2.83e-04 | 9.13e-04 | 4.65e-04 | 88 |
| hsa04145113 | Oral cavity | OSCC | Phagosome | 88/3704 | 152/8465 | 2.83e-04 | 9.13e-04 | 4.65e-04 | 88 |
| Page: 1 |
Top |
Cell-cell communication analysis |
| Identification of potential cell-cell interactions between two cell types and their ligand-receptor pairs for different disease states |
| Ligand | Receptor | LRpair | Pathway | Tissue | Disease Stage |
| THBS4 | ITGA3_ITGB1 | THBS4_ITGA3_ITGB1 | THBS | Esophagus | ESCC |
| THBS4 | SDC1 | THBS4_SDC1 | THBS | Esophagus | ESCC |
| THBS4 | SDC4 | THBS4_SDC4 | THBS | Esophagus | ESCC |
| THBS4 | CD36 | THBS4_CD36 | THBS | Esophagus | ESCC |
| THBS4 | CD47 | THBS4_CD47 | THBS | Esophagus | ESCC |
| THBS4 | SDC1 | THBS4_SDC1 | THBS | HNSCC | ADJ |
| THBS4 | SDC4 | THBS4_SDC4 | THBS | HNSCC | ADJ |
| THBS4 | CD36 | THBS4_CD36 | THBS | HNSCC | ADJ |
| THBS4 | CD47 | THBS4_CD47 | THBS | HNSCC | ADJ |
| THBS4 | SDC4 | THBS4_SDC4 | THBS | HNSCC | Healthy |
| THBS4 | CD36 | THBS4_CD36 | THBS | HNSCC | Healthy |
| THBS4 | CD47 | THBS4_CD47 | THBS | HNSCC | Healthy |
| THBS4 | ITGA3_ITGB1 | THBS4_ITGA3_ITGB1 | THBS | HNSCC | OSCC |
| THBS4 | SDC1 | THBS4_SDC1 | THBS | HNSCC | OSCC |
| THBS4 | SDC4 | THBS4_SDC4 | THBS | HNSCC | OSCC |
| THBS4 | CD36 | THBS4_CD36 | THBS | HNSCC | OSCC |
| THBS4 | CD47 | THBS4_CD47 | THBS | HNSCC | OSCC |
| THBS4 | ITGA3_ITGB1 | THBS4_ITGA3_ITGB1 | THBS | HNSCC | Precancer |
| THBS4 | SDC1 | THBS4_SDC1 | THBS | HNSCC | Precancer |
| THBS4 | SDC4 | THBS4_SDC4 | THBS | HNSCC | Precancer |
| Page: 1 2 |
Top |
Single-cell gene regulatory network inference analysis |
| Find out the significant the regulons (TFs) and the target genes of each regulon across cell types for different disease states |
| TF | Cell Type | Tissue | Disease Stage | Target Gene | RSS | Regulon Activity |
| ∗The dot plots of a searched regulon are shown for all cell subpopulations in each disease state of each tissue based on the regulon specific score inferred using pySCENIC and by calculating the average expression. |
| Page: 1 |
Top |
Somatic mutation of malignant transformation related genes |
| Annotation of somatic variants for genes involved in malignant transformation |
| Hugo Symbol | Variant Class | Variant Classification | dbSNP RS | HGVSc | HGVSp | HGVSp Short | SWISSPROT | BIOTYPE | SIFT | PolyPhen | Tumor Sample Barcode | Tissue | Histology | Sex | Age | Stage | Therapy Types | Drugs | Outcome |
| THBS4 | SNV | Missense_Mutation | c.1690G>A | p.Asp564Asn | p.D564N | P35443 | protein_coding | deleterious(0.02) | probably_damaging(0.997) | TCGA-A2-A0CM-01 | Breast | breast invasive carcinoma | Female | <65 | I/II | Chemotherapy | adriamycin | PD | |
| THBS4 | SNV | Missense_Mutation | rs777353986 | c.1054N>A | p.Ala352Thr | p.A352T | P35443 | protein_coding | tolerated(0.09) | benign(0.005) | TCGA-A8-A09Q-01 | Breast | breast invasive carcinoma | Female | >=65 | III/IV | Hormone Therapy | anastrozole | SD |
| THBS4 | SNV | Missense_Mutation | c.185N>G | p.Ser62Cys | p.S62C | P35443 | protein_coding | deleterious(0.01) | benign(0.319) | TCGA-AC-A23H-01 | Breast | breast invasive carcinoma | Female | >=65 | I/II | Unknown | Unknown | PD | |
| THBS4 | SNV | Missense_Mutation | c.1559N>G | p.Gln520Arg | p.Q520R | P35443 | protein_coding | deleterious(0.05) | benign(0.007) | TCGA-AO-A128-01 | Breast | breast invasive carcinoma | Female | <65 | I/II | Chemotherapy | doxorubicin | SD | |
| THBS4 | SNV | Missense_Mutation | novel | c.451G>C | p.Asp151His | p.D151H | P35443 | protein_coding | tolerated(0.19) | possibly_damaging(0.751) | TCGA-C8-A8HQ-01 | Breast | breast invasive carcinoma | Female | <65 | I/II | Unknown | Unknown | SD |
| THBS4 | SNV | Missense_Mutation | rs144667558 | c.890G>A | p.Arg297Gln | p.R297Q | P35443 | protein_coding | tolerated(0.31) | benign(0.005) | TCGA-EW-A1PE-01 | Breast | breast invasive carcinoma | Female | <65 | I/II | Chemotherapy | fluorouracil | SD |
| THBS4 | insertion | Frame_Shift_Ins | novel | c.1486_1487insC | p.Glu496AlafsTer13 | p.E496Afs*13 | P35443 | protein_coding | TCGA-A2-A0CP-01 | Breast | breast invasive carcinoma | Female | <65 | I/II | Chemotherapy | cytoxan | SD | ||
| THBS4 | insertion | Frame_Shift_Ins | novel | c.1489_1490insTGAGCAGGAACCAGGAGCCCGGGAGGGTCTCTCTGGAGTTCTG | p.Asp497ValfsTer15 | p.D497Vfs*15 | P35443 | protein_coding | TCGA-A2-A0CP-01 | Breast | breast invasive carcinoma | Female | <65 | I/II | Chemotherapy | cytoxan | SD | ||
| THBS4 | insertion | Frame_Shift_Ins | novel | c.1870_1871insATCTC | p.Ser624TyrfsTer106 | p.S624Yfs*106 | P35443 | protein_coding | TCGA-A8-A09B-01 | Breast | breast invasive carcinoma | Female | <65 | III/IV | Chemotherapy | 5-fluorouracil | SD | ||
| THBS4 | deletion | Frame_Shift_Del | novel | c.2497delN | p.Gly833AlafsTer7 | p.G833Afs*7 | P35443 | protein_coding | TCGA-D8-A27V-01 | Breast | breast invasive carcinoma | Female | <65 | I/II | Hormone Therapy | tamoxiphen | SD |
| Page: 1 2 3 4 5 6 7 8 9 10 |
Top |
Related drugs of malignant transformation related genes |
| Identification of chemicals and drugs interact with genes involved in malignant transfromation |
| (DGIdb 4.0) |
| Entrez ID | Symbol | Category | Interaction Types | Drug Claim Name | Drug Name | PMIDs |
| 7060 | THBS4 | DRUGGABLE GENOME, TRANSCRIPTION FACTOR, GROWTH FACTOR | VASOPRESSIN | VASOPRESSIN | 18541142 |
| Page: 1 |

Copyright 2023-Present -The University of Texas Health Science Center at Houston |