| Tissue | Expression Dynamics | Abbreviation |
| Esophagus | 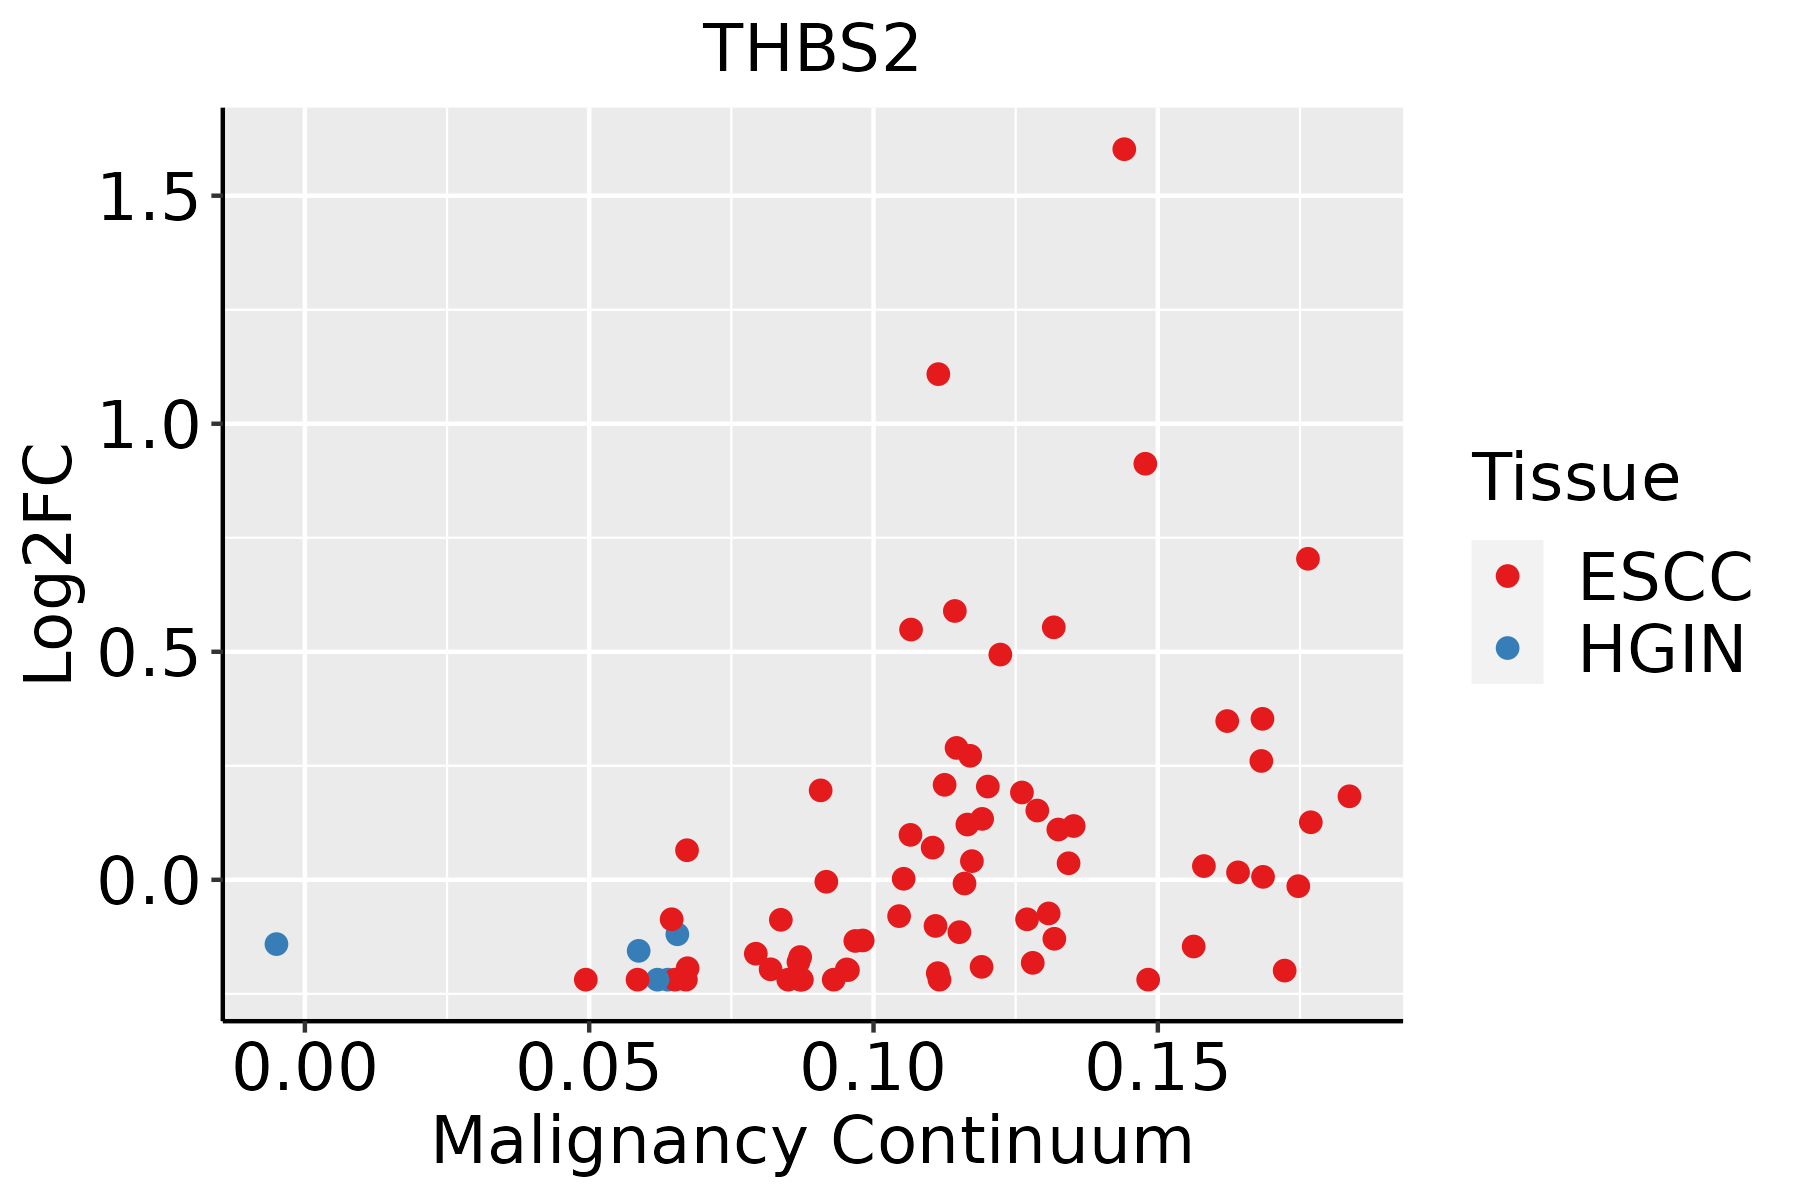 | ESCC: Esophageal squamous cell carcinoma |
| HGIN: High-grade intraepithelial neoplasias |
| LGIN: Low-grade intraepithelial neoplasias |
| Oral Cavity | 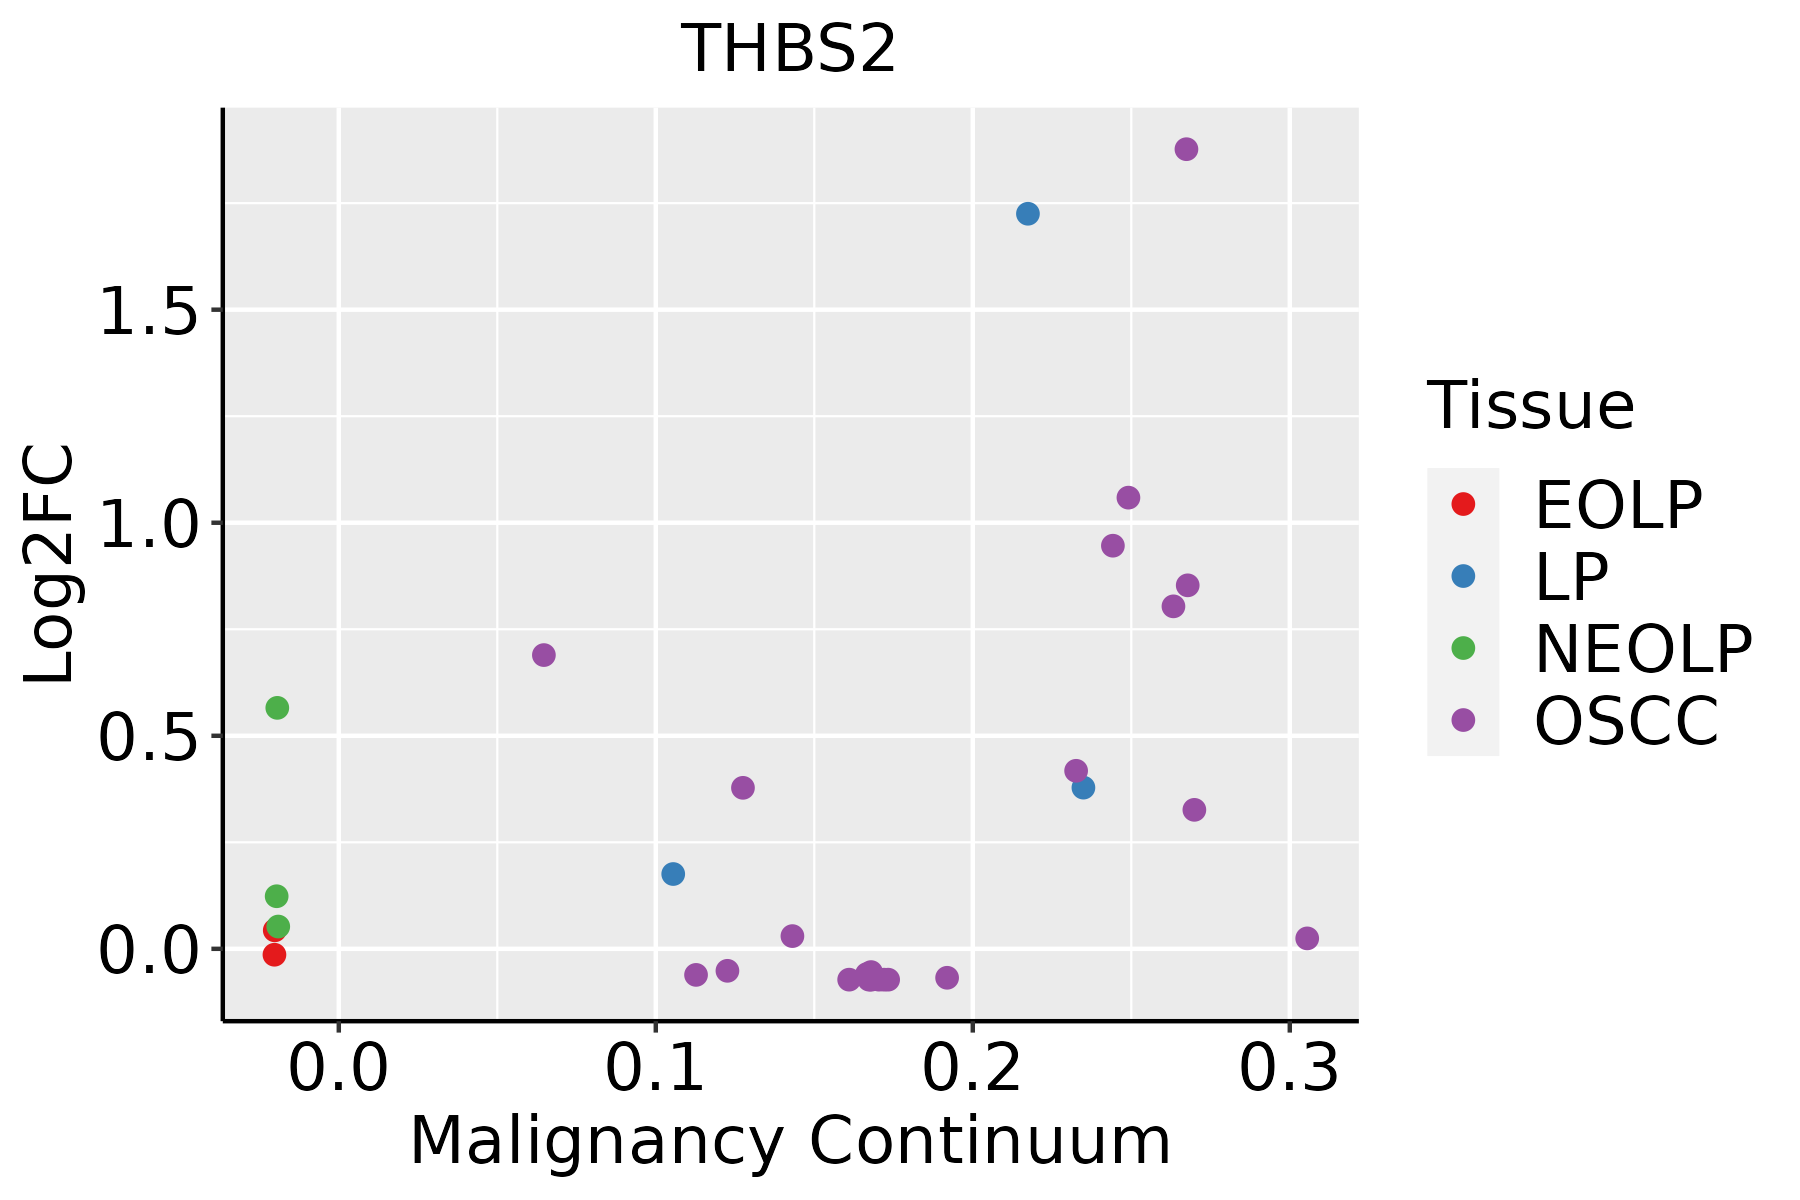 | EOLP: Erosive Oral lichen planus |
| LP: leukoplakia |
| NEOLP: Non-erosive oral lichen planus |
| OSCC: Oral squamous cell carcinoma |
| Skin |  | AK: Actinic keratosis |
| cSCC: Cutaneous squamous cell carcinoma |
| SCCIS:squamous cell carcinoma in situ |
| Thyroid | 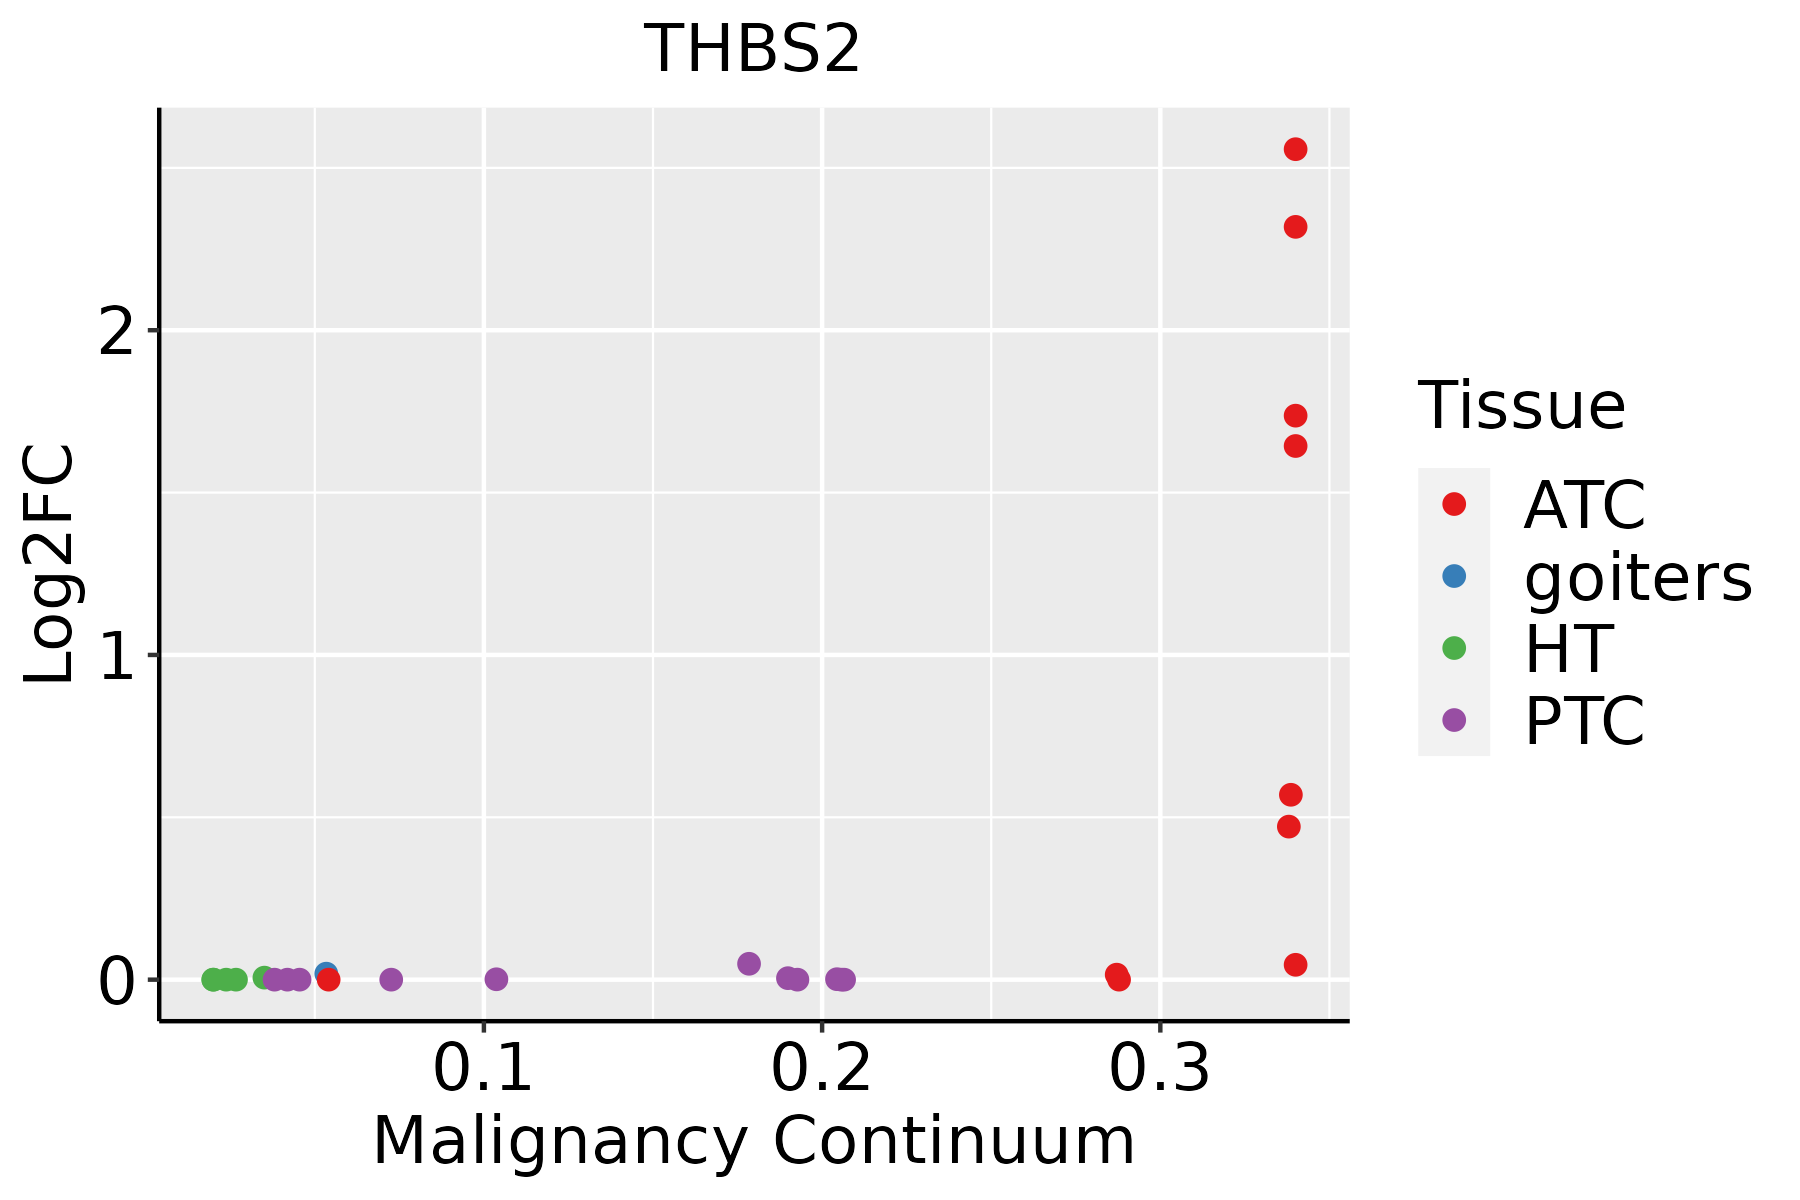 | ATC: Anaplastic thyroid cancer |
| HT: Hashimoto's thyroiditis |
| PTC: Papillary thyroid cancer |
| GO ID | Tissue | Disease Stage | Description | Gene Ratio | Bg Ratio | pvalue | p.adjust | Count |
| GO:003432918 | Esophagus | ESCC | cell junction assembly | 227/8552 | 420/18723 | 3.06e-04 | 1.83e-03 | 227 |
| GO:00519606 | Esophagus | ESCC | regulation of nervous system development | 237/8552 | 443/18723 | 5.02e-04 | 2.78e-03 | 237 |
| GO:00519625 | Esophagus | ESCC | positive regulation of nervous system development | 149/8552 | 272/18723 | 1.50e-03 | 7.06e-03 | 149 |
| GO:190188810 | Esophagus | ESCC | regulation of cell junction assembly | 109/8552 | 204/18723 | 1.53e-02 | 4.96e-02 | 109 |
| GO:00519624 | Oral cavity | OSCC | positive regulation of nervous system development | 135/7305 | 272/18723 | 2.20e-04 | 1.44e-03 | 135 |
| GO:00519605 | Oral cavity | OSCC | regulation of nervous system development | 205/7305 | 443/18723 | 9.80e-04 | 5.11e-03 | 205 |
| GO:003432916 | Oral cavity | OSCC | cell junction assembly | 190/7305 | 420/18723 | 4.99e-03 | 1.96e-02 | 190 |
| GO:003432923 | Oral cavity | NEOLP | cell junction assembly | 88/2005 | 420/18723 | 4.18e-10 | 3.44e-08 | 88 |
| GO:190188814 | Oral cavity | NEOLP | regulation of cell junction assembly | 47/2005 | 204/18723 | 2.82e-07 | 8.96e-06 | 47 |
| GO:190134213 | Oral cavity | NEOLP | regulation of vasculature development | 59/2005 | 348/18723 | 2.42e-04 | 2.52e-03 | 59 |
| GO:00457655 | Oral cavity | NEOLP | regulation of angiogenesis | 58/2005 | 342/18723 | 2.70e-04 | 2.72e-03 | 58 |
| GO:005196212 | Oral cavity | NEOLP | positive regulation of nervous system development | 47/2005 | 272/18723 | 6.49e-04 | 5.47e-03 | 47 |
| GO:005196012 | Oral cavity | NEOLP | regulation of nervous system development | 68/2005 | 443/18723 | 1.46e-03 | 1.03e-02 | 68 |
| GO:003432919 | Skin | AK | cell junction assembly | 86/1910 | 420/18723 | 1.95e-10 | 2.68e-08 | 86 |
| GO:190188815 | Skin | AK | regulation of cell junction assembly | 43/1910 | 204/18723 | 2.99e-06 | 7.93e-05 | 43 |
| GO:00508088 | Skin | AK | synapse organization | 71/1910 | 426/18723 | 2.21e-05 | 4.07e-04 | 71 |
| GO:00519607 | Skin | AK | regulation of nervous system development | 72/1910 | 443/18723 | 4.53e-05 | 7.11e-04 | 72 |
| GO:00519626 | Skin | AK | positive regulation of nervous system development | 49/1910 | 272/18723 | 5.65e-05 | 8.50e-04 | 49 |
| GO:00508031 | Skin | AK | regulation of synapse structure or activity | 38/1910 | 218/18723 | 7.06e-04 | 6.01e-03 | 38 |
| GO:00508073 | Skin | AK | regulation of synapse organization | 37/1910 | 211/18723 | 7.35e-04 | 6.20e-03 | 37 |
| Pathway ID | Tissue | Disease Stage | Description | Gene Ratio | Bg Ratio | pvalue | p.adjust | qvalue | Count |
| hsa0516510 | Esophagus | ESCC | Human papillomavirus infection | 215/4205 | 331/8465 | 7.86e-09 | 7.12e-08 | 3.65e-08 | 215 |
| hsa0414530 | Esophagus | ESCC | Phagosome | 100/4205 | 152/8465 | 3.81e-05 | 1.72e-04 | 8.82e-05 | 100 |
| hsa0451020 | Esophagus | ESCC | Focal adhesion | 127/4205 | 203/8465 | 1.25e-04 | 4.99e-04 | 2.56e-04 | 127 |
| hsa041517 | Esophagus | ESCC | PI3K-Akt signaling pathway | 197/4205 | 354/8465 | 1.24e-02 | 2.83e-02 | 1.45e-02 | 197 |
| hsa0516515 | Esophagus | ESCC | Human papillomavirus infection | 215/4205 | 331/8465 | 7.86e-09 | 7.12e-08 | 3.65e-08 | 215 |
| hsa04145114 | Esophagus | ESCC | Phagosome | 100/4205 | 152/8465 | 3.81e-05 | 1.72e-04 | 8.82e-05 | 100 |
| hsa04510111 | Esophagus | ESCC | Focal adhesion | 127/4205 | 203/8465 | 1.25e-04 | 4.99e-04 | 2.56e-04 | 127 |
| hsa0415114 | Esophagus | ESCC | PI3K-Akt signaling pathway | 197/4205 | 354/8465 | 1.24e-02 | 2.83e-02 | 1.45e-02 | 197 |
| hsa051659 | Oral cavity | OSCC | Human papillomavirus infection | 200/3704 | 331/8465 | 3.83e-10 | 4.93e-09 | 2.51e-09 | 200 |
| hsa0451019 | Oral cavity | OSCC | Focal adhesion | 128/3704 | 203/8465 | 1.71e-08 | 1.63e-07 | 8.31e-08 | 128 |
| hsa0414528 | Oral cavity | OSCC | Phagosome | 88/3704 | 152/8465 | 2.83e-04 | 9.13e-04 | 4.65e-04 | 88 |
| hsa041516 | Oral cavity | OSCC | PI3K-Akt signaling pathway | 185/3704 | 354/8465 | 6.26e-04 | 1.86e-03 | 9.49e-04 | 185 |
| hsa0516514 | Oral cavity | OSCC | Human papillomavirus infection | 200/3704 | 331/8465 | 3.83e-10 | 4.93e-09 | 2.51e-09 | 200 |
| hsa04510110 | Oral cavity | OSCC | Focal adhesion | 128/3704 | 203/8465 | 1.71e-08 | 1.63e-07 | 8.31e-08 | 128 |
| hsa04145113 | Oral cavity | OSCC | Phagosome | 88/3704 | 152/8465 | 2.83e-04 | 9.13e-04 | 4.65e-04 | 88 |
| hsa0415113 | Oral cavity | OSCC | PI3K-Akt signaling pathway | 185/3704 | 354/8465 | 6.26e-04 | 1.86e-03 | 9.49e-04 | 185 |
| hsa0414529 | Oral cavity | LP | Phagosome | 73/2418 | 152/8465 | 2.37e-07 | 3.29e-06 | 2.12e-06 | 73 |
| hsa0516523 | Oral cavity | LP | Human papillomavirus infection | 121/2418 | 331/8465 | 8.00e-04 | 3.86e-03 | 2.49e-03 | 121 |
| hsa0414536 | Oral cavity | LP | Phagosome | 73/2418 | 152/8465 | 2.37e-07 | 3.29e-06 | 2.12e-06 | 73 |
| hsa0516533 | Oral cavity | LP | Human papillomavirus infection | 121/2418 | 331/8465 | 8.00e-04 | 3.86e-03 | 2.49e-03 | 121 |
| Hugo Symbol | Variant Class | Variant Classification | dbSNP RS | HGVSc | HGVSp | HGVSp Short | SWISSPROT | BIOTYPE | SIFT | PolyPhen | Tumor Sample Barcode | Tissue | Histology | Sex | Age | Stage | Therapy Types | Drugs | Outcome |
| THBS2 | SNV | Missense_Mutation | rs142358231 | c.47C>T | p.Thr16Met | p.T16M | P35442 | protein_coding | tolerated_low_confidence(0.26) | benign(0.05) | TCGA-3C-AALK-01 | Breast | breast invasive carcinoma | Female | <65 | I/II | Chemotherapy | docetaxel | SD |
| THBS2 | SNV | Missense_Mutation | | c.2500C>A | p.His834Asn | p.H834N | P35442 | protein_coding | tolerated(0.43) | benign(0.212) | TCGA-AC-A23H-01 | Breast | breast invasive carcinoma | Female | >=65 | I/II | Unknown | Unknown | PD |
| THBS2 | SNV | Missense_Mutation | rs202062355 | c.706N>A | p.Ala236Thr | p.A236T | P35442 | protein_coding | tolerated_low_confidence(0.67) | benign(0.003) | TCGA-AC-A8OR-01 | Breast | breast invasive carcinoma | Female | >=65 | I/II | Unknown | Unknown | SD |
| THBS2 | SNV | Missense_Mutation | | c.1378N>T | p.Arg460Cys | p.R460C | P35442 | protein_coding | deleterious(0) | probably_damaging(0.992) | TCGA-AN-A0AK-01 | Breast | breast invasive carcinoma | Female | >=65 | I/II | Unknown | Unknown | SD |
| THBS2 | SNV | Missense_Mutation | | c.2464N>A | p.Asp822Asn | p.D822N | P35442 | protein_coding | tolerated(0.11) | possibly_damaging(0.722) | TCGA-BH-A0DX-01 | Breast | breast invasive carcinoma | Female | <65 | I/II | Chemotherapy | taxotere | CR |
| THBS2 | SNV | Missense_Mutation | rs748278174 | c.55G>A | p.Gly19Ser | p.G19S | P35442 | protein_coding | tolerated_low_confidence(0.39) | benign(0.011) | TCGA-E2-A14N-01 | Breast | breast invasive carcinoma | Female | <65 | I/II | Chemotherapy | cyclophosphamide | SD |
| THBS2 | SNV | Missense_Mutation | rs756790082 | c.790G>A | p.Glu264Lys | p.E264K | P35442 | protein_coding | tolerated_low_confidence(0.42) | benign(0.157) | TCGA-LL-A73Z-01 | Breast | breast invasive carcinoma | Female | <65 | III/IV | Chemotherapy | adriamycin | PD |
| THBS2 | SNV | Missense_Mutation | novel | c.424G>A | p.Val142Ile | p.V142I | P35442 | protein_coding | deleterious(0.01) | probably_damaging(0.99) | TCGA-LL-A73Z-01 | Breast | breast invasive carcinoma | Female | <65 | III/IV | Chemotherapy | adriamycin | PD |
| THBS2 | insertion | Frame_Shift_Ins | novel | c.2803_2804insCTCCCATGCAGCT | p.Asp935AlafsTer7 | p.D935Afs*7 | P35442 | protein_coding | | | TCGA-A8-A093-01 | Breast | breast invasive carcinoma | Female | <65 | I/II | Hormone Therapy | tamoxiphen | SD |
| THBS2 | deletion | Frame_Shift_Del | novel | c.2497delN | p.Asp833IlefsTer32 | p.D833Ifs*32 | P35442 | protein_coding | | | TCGA-D8-A27V-01 | Breast | breast invasive carcinoma | Female | <65 | I/II | Hormone Therapy | tamoxiphen | SD |


