
|
|||||
|
 | |
| |
| |
| |
| |
| |
|
Gene: THBD |
Gene summary for THBD |
| Gene information | Species | Human | Gene symbol | THBD | Gene ID | 7056 |
| Gene name | thrombomodulin | |
| Gene Alias | AHUS6 | |
| Cytomap | 20p11.21 | |
| Gene Type | protein-coding | GO ID | GO:0000003 | UniProtAcc | P07204 |
Top |
Malignant transformation analysis |
| Identification of the aberrant gene expression in precancerous and cancerous lesions by comparing the gene expression of stem-like cells in diseased tissues with normal stem cells |
| Entrez ID | Symbol | Replicates | Species | Organ | Tissue | Adj P-value | Log2FC | Malignancy |
| 7056 | THBD | LZE2T | Human | Esophagus | ESCC | 1.17e-02 | 2.01e-01 | 0.082 |
| 7056 | THBD | P2T-E | Human | Esophagus | ESCC | 2.20e-05 | -2.53e-01 | 0.1177 |
| 7056 | THBD | P5T-E | Human | Esophagus | ESCC | 1.17e-04 | 4.96e-01 | 0.1327 |
| 7056 | THBD | P9T-E | Human | Esophagus | ESCC | 1.10e-09 | 6.30e-01 | 0.1131 |
| 7056 | THBD | P12T-E | Human | Esophagus | ESCC | 2.79e-02 | -1.91e-01 | 0.1122 |
| 7056 | THBD | P16T-E | Human | Esophagus | ESCC | 3.55e-26 | 9.75e-01 | 0.1153 |
| 7056 | THBD | P22T-E | Human | Esophagus | ESCC | 8.74e-05 | -2.47e-01 | 0.1236 |
| 7056 | THBD | P23T-E | Human | Esophagus | ESCC | 6.43e-18 | 1.45e+00 | 0.108 |
| 7056 | THBD | P26T-E | Human | Esophagus | ESCC | 2.69e-05 | -2.20e-01 | 0.1276 |
| 7056 | THBD | P28T-E | Human | Esophagus | ESCC | 1.35e-18 | 1.08e+00 | 0.1149 |
| 7056 | THBD | P30T-E | Human | Esophagus | ESCC | 3.05e-14 | 1.14e+00 | 0.137 |
| 7056 | THBD | P36T-E | Human | Esophagus | ESCC | 2.15e-05 | 1.08e+00 | 0.1187 |
| 7056 | THBD | P47T-E | Human | Esophagus | ESCC | 1.62e-08 | 5.83e-01 | 0.1067 |
| 7056 | THBD | P52T-E | Human | Esophagus | ESCC | 1.15e-02 | 5.64e-01 | 0.1555 |
| 7056 | THBD | P54T-E | Human | Esophagus | ESCC | 1.48e-09 | 7.01e-01 | 0.0975 |
| 7056 | THBD | P61T-E | Human | Esophagus | ESCC | 2.42e-02 | -1.38e-01 | 0.099 |
| 7056 | THBD | P65T-E | Human | Esophagus | ESCC | 1.67e-02 | -7.10e-02 | 0.0978 |
| 7056 | THBD | P80T-E | Human | Esophagus | ESCC | 1.17e-16 | 1.89e+00 | 0.155 |
| 7056 | THBD | P83T-E | Human | Esophagus | ESCC | 3.30e-23 | 1.53e+00 | 0.1738 |
| 7056 | THBD | P130T-E | Human | Esophagus | ESCC | 7.05e-07 | -1.68e-01 | 0.1676 |
| Page: 1 2 |
| Tissue | Expression Dynamics | Abbreviation |
| Esophagus |  | ESCC: Esophageal squamous cell carcinoma |
| HGIN: High-grade intraepithelial neoplasias | ||
| LGIN: Low-grade intraepithelial neoplasias | ||
| Oral Cavity | 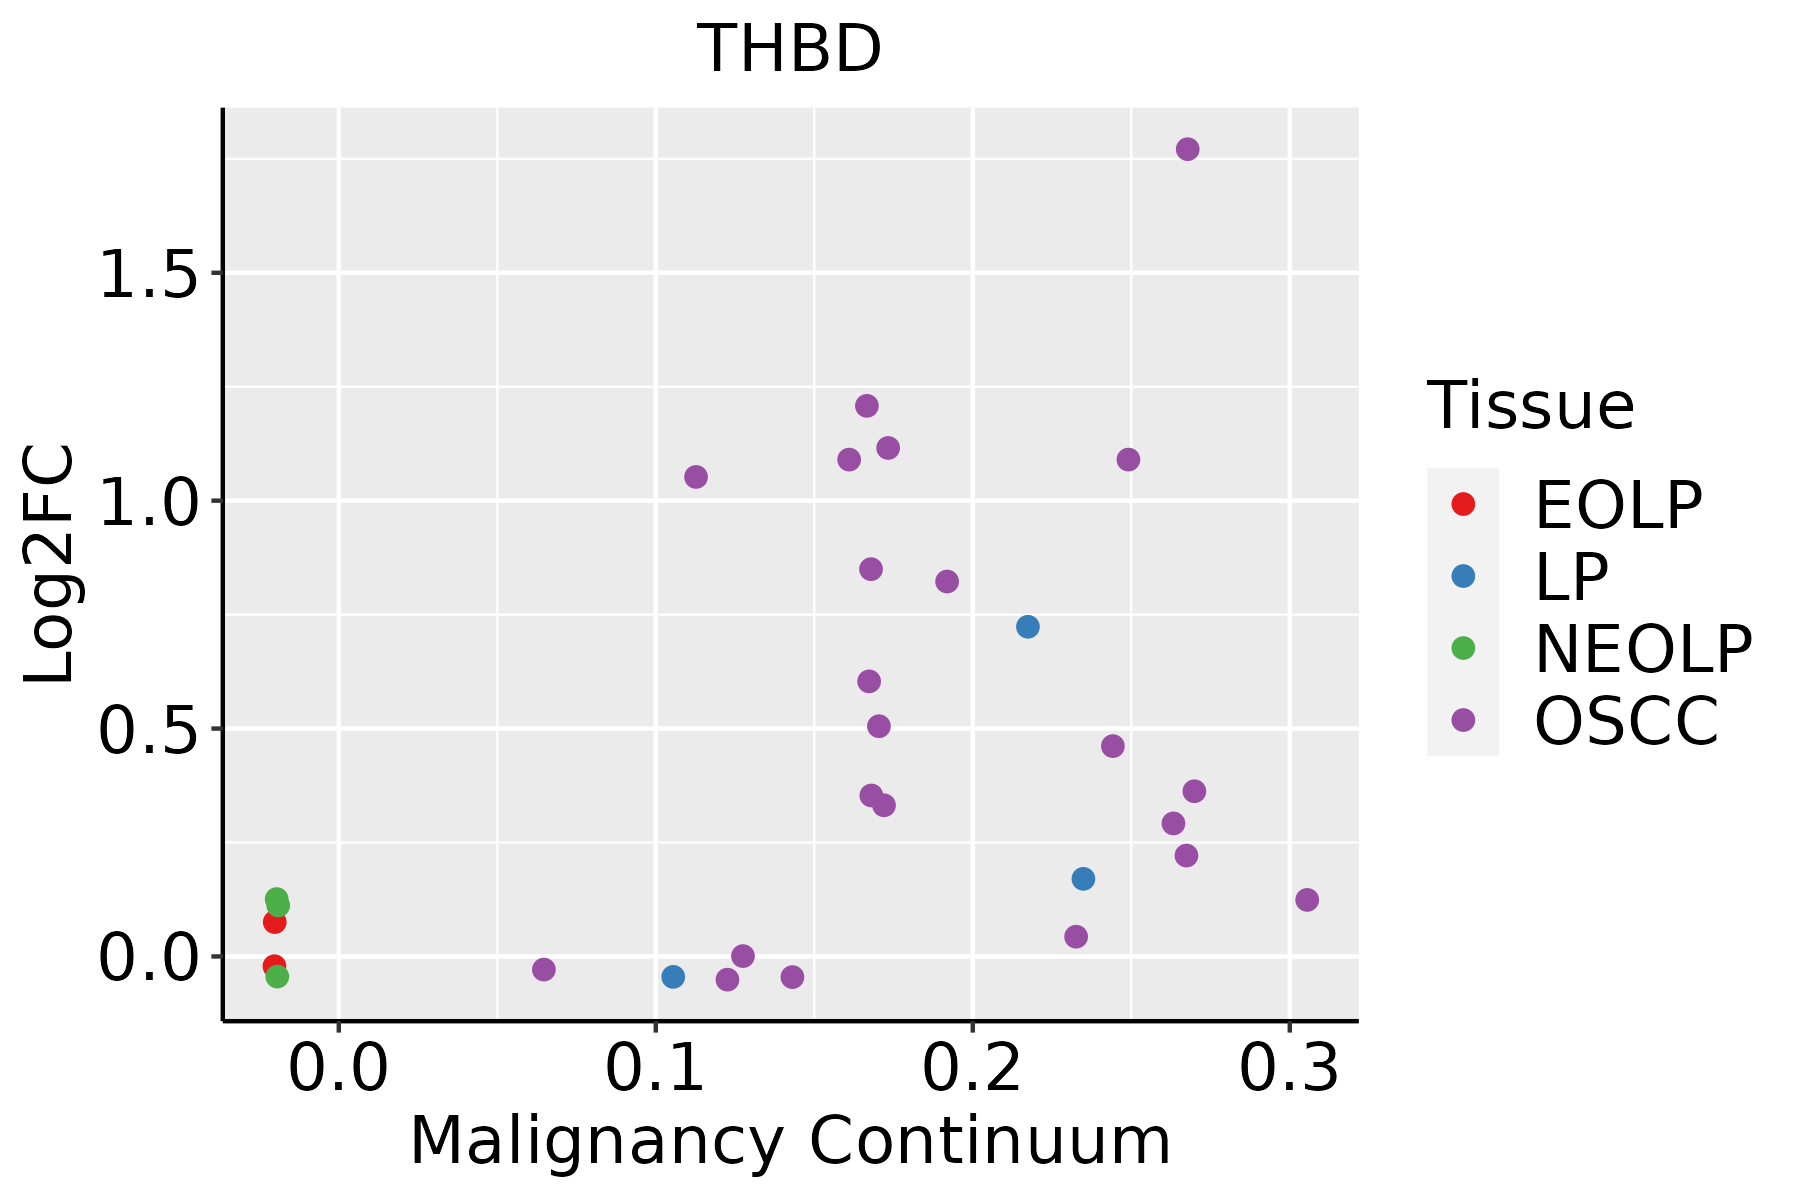 | EOLP: Erosive Oral lichen planus |
| LP: leukoplakia | ||
| NEOLP: Non-erosive oral lichen planus | ||
| OSCC: Oral squamous cell carcinoma | ||
| Skin | 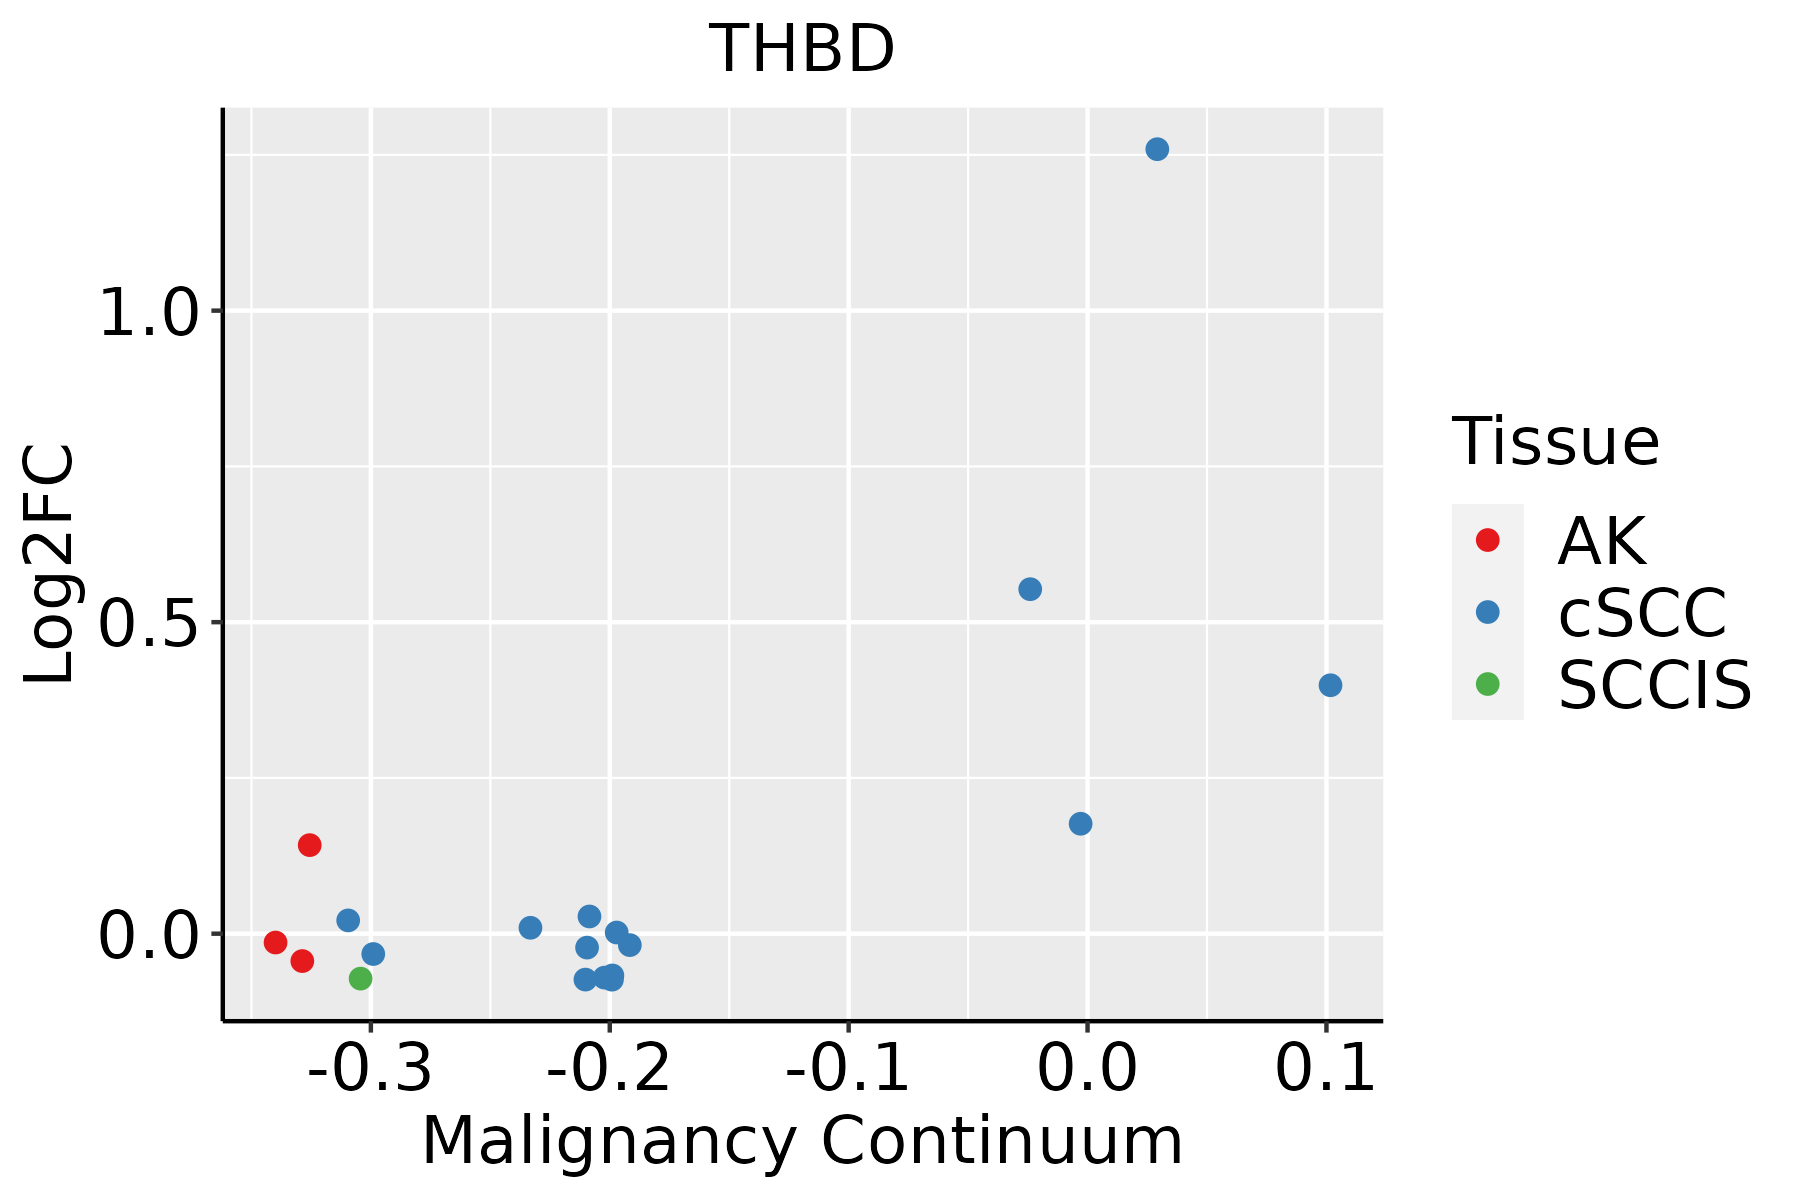 | AK: Actinic keratosis |
| cSCC: Cutaneous squamous cell carcinoma | ||
| SCCIS:squamous cell carcinoma in situ |
| ∗log2FC in expression of this searched gene in stem-like cells from each diseased tissue sample relative to stem-like cells in normal samples in each tissue plotted against the malignancy continuum. Samples are colored based on if they are from different disease stage. |
Top |
Malignant transformation related pathway analysis |
| Find out the enriched GO biological processes and KEGG pathways involved in transition from healthy to precancer to cancer |
| Tissue | Disease Stage | Enriched GO biological Processes |
| Colorectum | AD |  |
| Colorectum | SER |  |
| Colorectum | MSS |  |
| Colorectum | MSI-H |  |
| Colorectum | FAP |  |
| ∗Top 15 enriched GO BP terms are showed in the bar plot of each disease state in each tissue. Each row represents a significant GO biological process which is colored according to the -log10(p.adjust). |
| Page: 1 2 3 4 5 6 7 8 9 |
| GO ID | Tissue | Disease Stage | Description | Gene Ratio | Bg Ratio | pvalue | p.adjust | Count |
| GO:001021217 | Esophagus | ESCC | response to ionizing radiation | 110/8552 | 148/18723 | 1.11e-12 | 4.78e-11 | 110 |
| GO:000931419 | Esophagus | ESCC | response to radiation | 277/8552 | 456/18723 | 4.42e-11 | 1.43e-09 | 277 |
| GO:004206027 | Esophagus | ESCC | wound healing | 243/8552 | 422/18723 | 4.62e-07 | 6.25e-06 | 243 |
| GO:003249619 | Esophagus | ESCC | response to lipopolysaccharide | 191/8552 | 343/18723 | 1.11e-04 | 7.73e-04 | 191 |
| GO:00101653 | Esophagus | ESCC | response to X-ray | 24/8552 | 33/18723 | 1.50e-03 | 7.06e-03 | 24 |
| GO:000223719 | Esophagus | ESCC | response to molecule of bacterial origin | 194/8552 | 363/18723 | 1.64e-03 | 7.61e-03 | 194 |
| GO:190303420 | Esophagus | ESCC | regulation of response to wounding | 93/8552 | 167/18723 | 5.77e-03 | 2.14e-02 | 93 |
| GO:190303617 | Esophagus | ESCC | positive regulation of response to wounding | 43/8552 | 72/18723 | 1.14e-02 | 3.84e-02 | 43 |
| GO:009030310 | Esophagus | ESCC | positive regulation of wound healing | 36/8552 | 59/18723 | 1.27e-02 | 4.21e-02 | 36 |
| GO:004206020 | Oral cavity | OSCC | wound healing | 237/7305 | 422/18723 | 4.51e-13 | 2.18e-11 | 237 |
| GO:00102128 | Oral cavity | OSCC | response to ionizing radiation | 99/7305 | 148/18723 | 5.49e-12 | 2.08e-10 | 99 |
| GO:000931416 | Oral cavity | OSCC | response to radiation | 241/7305 | 456/18723 | 9.76e-10 | 2.40e-08 | 241 |
| GO:003249617 | Oral cavity | OSCC | response to lipopolysaccharide | 178/7305 | 343/18723 | 7.27e-07 | 1.03e-05 | 178 |
| GO:000223717 | Oral cavity | OSCC | response to molecule of bacterial origin | 181/7305 | 363/18723 | 1.48e-05 | 1.49e-04 | 181 |
| GO:00321037 | Oral cavity | OSCC | positive regulation of response to external stimulus | 203/7305 | 427/18723 | 1.79e-04 | 1.22e-03 | 203 |
| GO:190303418 | Oral cavity | OSCC | regulation of response to wounding | 87/7305 | 167/18723 | 3.91e-04 | 2.38e-03 | 87 |
| GO:00075657 | Oral cavity | OSCC | female pregnancy | 98/7305 | 193/18723 | 5.66e-04 | 3.27e-03 | 98 |
| GO:005087819 | Oral cavity | OSCC | regulation of body fluid levels | 179/7305 | 379/18723 | 6.19e-04 | 3.50e-03 | 179 |
| GO:00101652 | Oral cavity | OSCC | response to X-ray | 22/7305 | 33/18723 | 1.19e-03 | 6.03e-03 | 22 |
| GO:006104116 | Oral cavity | OSCC | regulation of wound healing | 69/7305 | 134/18723 | 2.19e-03 | 9.95e-03 | 69 |
| Page: 1 2 |
| Pathway ID | Tissue | Disease Stage | Description | Gene Ratio | Bg Ratio | pvalue | p.adjust | qvalue | Count |
| hsa05418211 | Esophagus | ESCC | Fluid shear stress and atherosclerosis | 109/4205 | 139/8465 | 2.00e-12 | 3.72e-11 | 1.90e-11 | 109 |
| hsa0493310 | Esophagus | ESCC | AGE-RAGE signaling pathway in diabetic complications | 72/4205 | 100/8465 | 4.15e-06 | 2.28e-05 | 1.17e-05 | 72 |
| hsa05418310 | Esophagus | ESCC | Fluid shear stress and atherosclerosis | 109/4205 | 139/8465 | 2.00e-12 | 3.72e-11 | 1.90e-11 | 109 |
| hsa0493317 | Esophagus | ESCC | AGE-RAGE signaling pathway in diabetic complications | 72/4205 | 100/8465 | 4.15e-06 | 2.28e-05 | 1.17e-05 | 72 |
| hsa0541830 | Oral cavity | OSCC | Fluid shear stress and atherosclerosis | 92/3704 | 139/8465 | 6.51e-08 | 4.84e-07 | 2.47e-07 | 92 |
| hsa049339 | Oral cavity | OSCC | AGE-RAGE signaling pathway in diabetic complications | 69/3704 | 100/8465 | 2.61e-07 | 1.65e-06 | 8.41e-07 | 69 |
| hsa05418114 | Oral cavity | OSCC | Fluid shear stress and atherosclerosis | 92/3704 | 139/8465 | 6.51e-08 | 4.84e-07 | 2.47e-07 | 92 |
| hsa0493316 | Oral cavity | OSCC | AGE-RAGE signaling pathway in diabetic complications | 69/3704 | 100/8465 | 2.61e-07 | 1.65e-06 | 8.41e-07 | 69 |
| Page: 1 |
Top |
Cell-cell communication analysis |
| Identification of potential cell-cell interactions between two cell types and their ligand-receptor pairs for different disease states |
| Ligand | Receptor | LRpair | Pathway | Tissue | Disease Stage |
| Page: 1 |
Top |
Single-cell gene regulatory network inference analysis |
| Find out the significant the regulons (TFs) and the target genes of each regulon across cell types for different disease states |
| TF | Cell Type | Tissue | Disease Stage | Target Gene | RSS | Regulon Activity |
| ∗The dot plots of a searched regulon are shown for all cell subpopulations in each disease state of each tissue based on the regulon specific score inferred using pySCENIC and by calculating the average expression. |
| Page: 1 |
Top |
Somatic mutation of malignant transformation related genes |
| Annotation of somatic variants for genes involved in malignant transformation |
| Hugo Symbol | Variant Class | Variant Classification | dbSNP RS | HGVSc | HGVSp | HGVSp Short | SWISSPROT | BIOTYPE | SIFT | PolyPhen | Tumor Sample Barcode | Tissue | Histology | Sex | Age | Stage | Therapy Types | Drugs | Outcome |
| THBD | SNV | Missense_Mutation | c.1093N>A | p.Pro365Thr | p.P365T | P07204 | protein_coding | tolerated(0.57) | benign(0.005) | TCGA-AN-A0AK-01 | Breast | breast invasive carcinoma | Female | >=65 | I/II | Unknown | Unknown | SD | |
| THBD | SNV | Missense_Mutation | rs200712265 | c.1198G>A | p.Glu400Lys | p.E400K | P07204 | protein_coding | tolerated(0.1) | benign(0.028) | TCGA-PE-A5DE-01 | Breast | breast invasive carcinoma | Female | <65 | I/II | Chemotherapy | taxotere | CR |
| THBD | SNV | Missense_Mutation | novel | c.1262C>A | p.Thr421Asn | p.T421N | P07204 | protein_coding | tolerated(0.6) | benign(0) | TCGA-C5-A8YQ-01 | Cervix | cervical & endocervical cancer | Female | >=65 | I/II | Chemotherapy | cisplatin | PD |
| THBD | SNV | Missense_Mutation | c.391N>T | p.Pro131Ser | p.P131S | P07204 | protein_coding | tolerated(0.07) | benign(0.01) | TCGA-Q1-A73O-01 | Cervix | cervical & endocervical cancer | Female | <65 | I/II | Chemotherapy | cisplatin | CR | |
| THBD | SNV | Missense_Mutation | rs764904057 | c.317N>A | p.Arg106His | p.R106H | P07204 | protein_coding | deleterious(0) | probably_damaging(0.992) | TCGA-A6-6142-01 | Colorectum | colon adenocarcinoma | Female | <65 | I/II | Chemotherapy | fluorouracil | PD |
| THBD | SNV | Missense_Mutation | c.1004N>T | p.Pro335Leu | p.P335L | P07204 | protein_coding | tolerated(1) | benign(0.012) | TCGA-AA-3854-01 | Colorectum | colon adenocarcinoma | Female | >=65 | I/II | Unknown | Unknown | SD | |
| THBD | SNV | Missense_Mutation | novel | c.1544C>T | p.Ser515Leu | p.S515L | P07204 | protein_coding | deleterious(0.03) | probably_damaging(0.926) | TCGA-AA-A01P-01 | Colorectum | colon adenocarcinoma | Female | >=65 | III/IV | Unknown | Unknown | PD |
| THBD | SNV | Missense_Mutation | c.1664N>T | p.Ala555Val | p.A555V | P07204 | protein_coding | deleterious(0.01) | possibly_damaging(0.47) | TCGA-AA-A022-01 | Colorectum | colon adenocarcinoma | Female | >=65 | I/II | Unknown | Unknown | SD | |
| THBD | SNV | Missense_Mutation | c.1183N>A | p.Ala395Thr | p.A395T | P07204 | protein_coding | tolerated(0.15) | benign(0.062) | TCGA-CK-5916-01 | Colorectum | colon adenocarcinoma | Female | >=65 | I/II | Unknown | Unknown | PD | |
| THBD | SNV | Missense_Mutation | rs768321291 | c.128N>T | p.Ala43Val | p.A43V | P07204 | protein_coding | tolerated(0.18) | benign(0.005) | TCGA-CM-4743-01 | Colorectum | colon adenocarcinoma | Male | >=65 | I/II | Chemotherapy | capecitabine | SD |
| Page: 1 2 3 4 |
Top |
Related drugs of malignant transformation related genes |
| Identification of chemicals and drugs interact with genes involved in malignant transfromation |
| (DGIdb 4.0) |
| Entrez ID | Symbol | Category | Interaction Types | Drug Claim Name | Drug Name | PMIDs |
| 7056 | THBD | CELL SURFACE, EXTERNAL SIDE OF PLASMA MEMBRANE, DRUGGABLE GENOME | SIMVASTATIN | SIMVASTATIN | 18663903 | |
| 7056 | THBD | CELL SURFACE, EXTERNAL SIDE OF PLASMA MEMBRANE, DRUGGABLE GENOME | CILOSTAZOL | CILOSTAZOL | 10918946 | |
| 7056 | THBD | CELL SURFACE, EXTERNAL SIDE OF PLASMA MEMBRANE, DRUGGABLE GENOME | LEVOTHYROXINE | LEVOTHYROXINE | 14763909 | |
| 7056 | THBD | CELL SURFACE, EXTERNAL SIDE OF PLASMA MEMBRANE, DRUGGABLE GENOME | GINKGO BILOBA | 17044640 | ||
| 7056 | THBD | CELL SURFACE, EXTERNAL SIDE OF PLASMA MEMBRANE, DRUGGABLE GENOME | warfarin | WARFARIN | 24602049 | |
| 7056 | THBD | CELL SURFACE, EXTERNAL SIDE OF PLASMA MEMBRANE, DRUGGABLE GENOME | CURCUMIN | CURCUMIN | 15733976 | |
| 7056 | THBD | CELL SURFACE, EXTERNAL SIDE OF PLASMA MEMBRANE, DRUGGABLE GENOME | PROSTAGLANDIN E1 | 7684300 |
| Page: 1 |

Copyright 2023-Present -The University of Texas Health Science Center at Houston |