
|
|||||
|
 | |
| |
| |
| |
| |
| |
|
Gene: THAP7 |
Gene summary for THAP7 |
| Gene information | Species | Human | Gene symbol | THAP7 | Gene ID | 80764 |
| Gene name | THAP domain containing 7 | |
| Gene Alias | THAP7 | |
| Cytomap | 22q11.21 | |
| Gene Type | protein-coding | GO ID | GO:0000122 | UniProtAcc | Q9BT49 |
Top |
Malignant transformation analysis |
| Identification of the aberrant gene expression in precancerous and cancerous lesions by comparing the gene expression of stem-like cells in diseased tissues with normal stem cells |
| Entrez ID | Symbol | Replicates | Species | Organ | Tissue | Adj P-value | Log2FC | Malignancy |
| 80764 | THAP7 | LZE4T | Human | Esophagus | ESCC | 1.44e-07 | 1.94e-01 | 0.0811 |
| 80764 | THAP7 | LZE7T | Human | Esophagus | ESCC | 1.06e-06 | 4.54e-01 | 0.0667 |
| 80764 | THAP7 | LZE8T | Human | Esophagus | ESCC | 5.04e-08 | 2.80e-01 | 0.067 |
| 80764 | THAP7 | LZE22D1 | Human | Esophagus | HGIN | 5.94e-05 | 2.07e-01 | 0.0595 |
| 80764 | THAP7 | LZE24T | Human | Esophagus | ESCC | 4.58e-21 | 6.27e-01 | 0.0596 |
| 80764 | THAP7 | LZE21T | Human | Esophagus | ESCC | 1.30e-02 | 2.98e-01 | 0.0655 |
| 80764 | THAP7 | LZE6T | Human | Esophagus | ESCC | 3.48e-07 | 2.44e-01 | 0.0845 |
| 80764 | THAP7 | P1T-E | Human | Esophagus | ESCC | 3.09e-07 | 3.64e-01 | 0.0875 |
| 80764 | THAP7 | P2T-E | Human | Esophagus | ESCC | 2.90e-22 | 4.06e-01 | 0.1177 |
| 80764 | THAP7 | P4T-E | Human | Esophagus | ESCC | 1.99e-27 | 6.97e-01 | 0.1323 |
| 80764 | THAP7 | P5T-E | Human | Esophagus | ESCC | 4.45e-30 | 6.53e-01 | 0.1327 |
| 80764 | THAP7 | P8T-E | Human | Esophagus | ESCC | 1.18e-15 | 3.11e-01 | 0.0889 |
| 80764 | THAP7 | P9T-E | Human | Esophagus | ESCC | 2.13e-14 | 4.54e-01 | 0.1131 |
| 80764 | THAP7 | P10T-E | Human | Esophagus | ESCC | 3.70e-46 | 8.99e-01 | 0.116 |
| 80764 | THAP7 | P11T-E | Human | Esophagus | ESCC | 6.66e-16 | 7.00e-01 | 0.1426 |
| 80764 | THAP7 | P12T-E | Human | Esophagus | ESCC | 1.59e-28 | 5.05e-01 | 0.1122 |
| 80764 | THAP7 | P15T-E | Human | Esophagus | ESCC | 2.22e-19 | 3.86e-01 | 0.1149 |
| 80764 | THAP7 | P16T-E | Human | Esophagus | ESCC | 1.03e-29 | 5.93e-01 | 0.1153 |
| 80764 | THAP7 | P17T-E | Human | Esophagus | ESCC | 2.30e-10 | 4.80e-01 | 0.1278 |
| 80764 | THAP7 | P19T-E | Human | Esophagus | ESCC | 7.36e-10 | 5.56e-01 | 0.1662 |
| Page: 1 2 3 4 5 |
| Tissue | Expression Dynamics | Abbreviation |
| Esophagus | 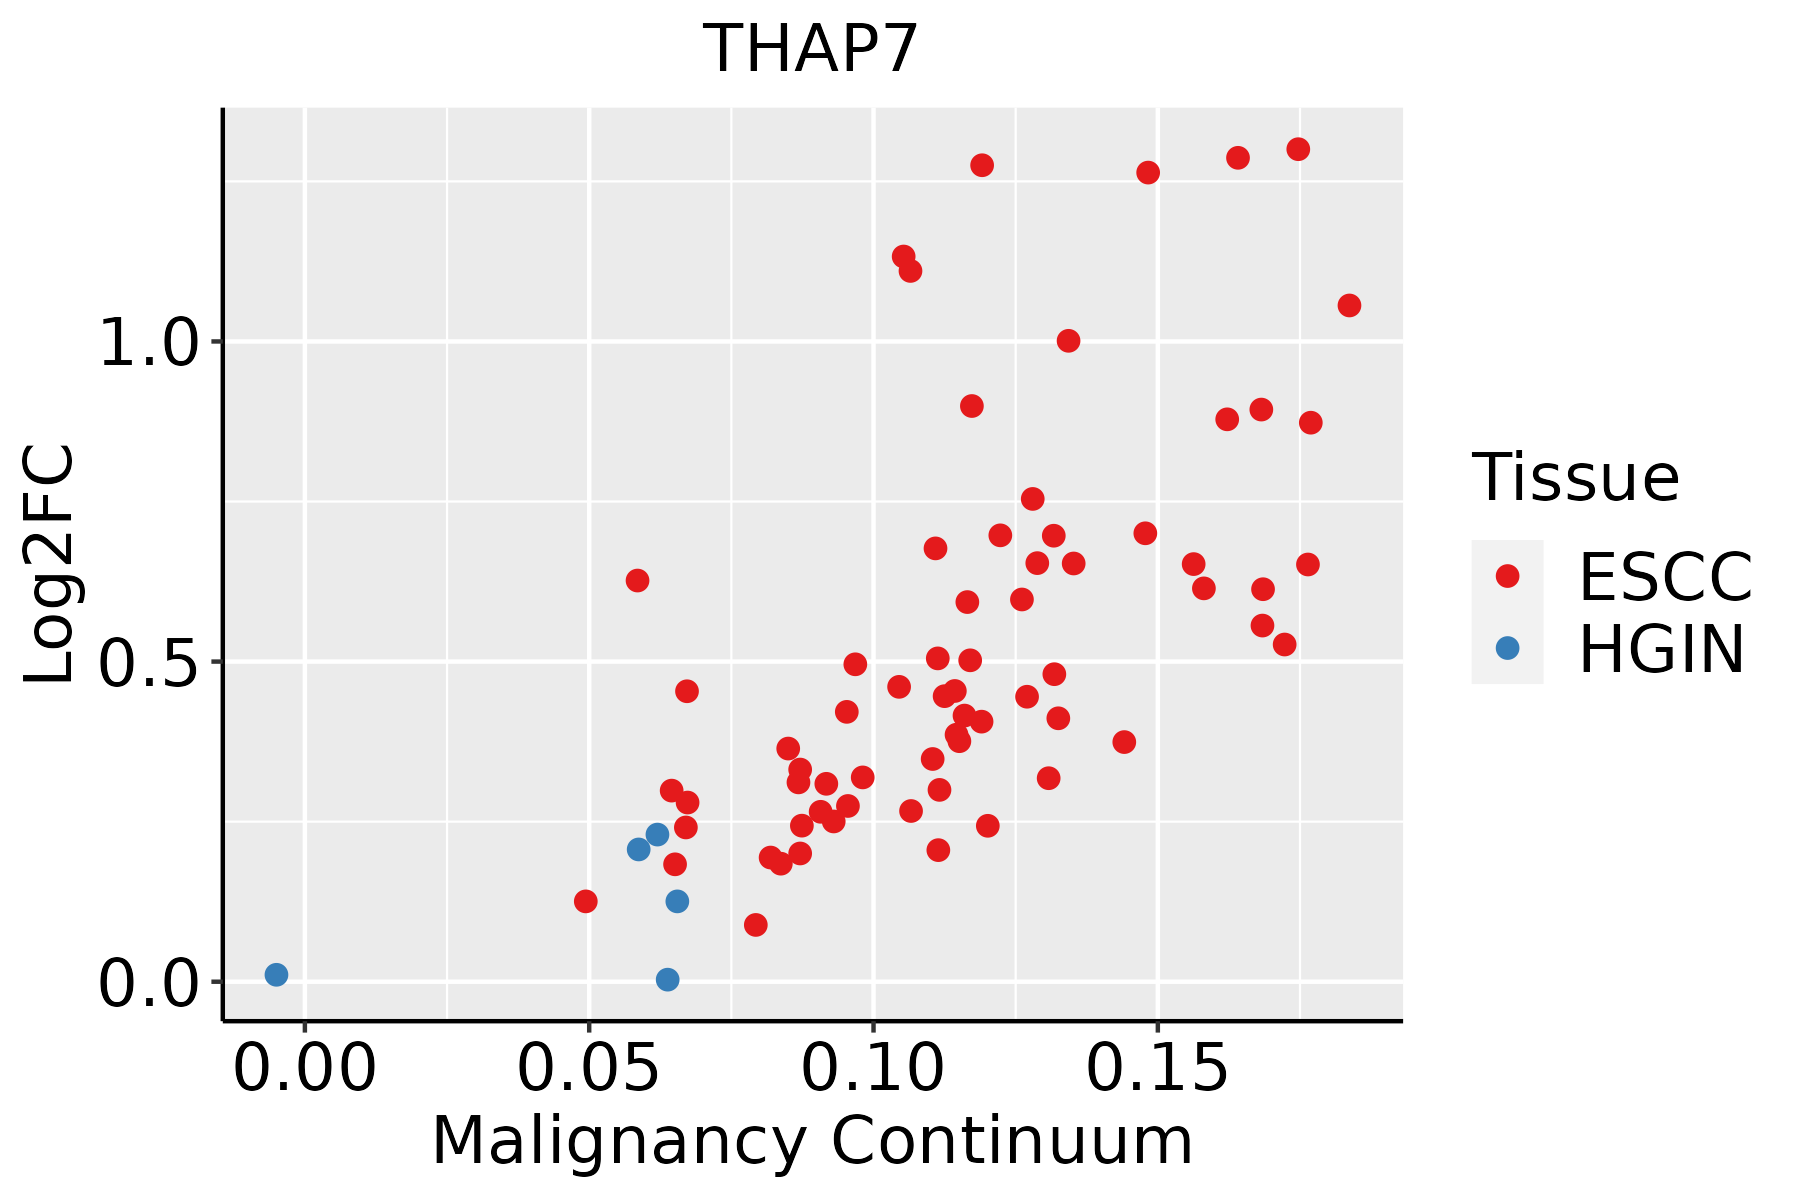 | ESCC: Esophageal squamous cell carcinoma |
| HGIN: High-grade intraepithelial neoplasias | ||
| LGIN: Low-grade intraepithelial neoplasias | ||
| Liver | 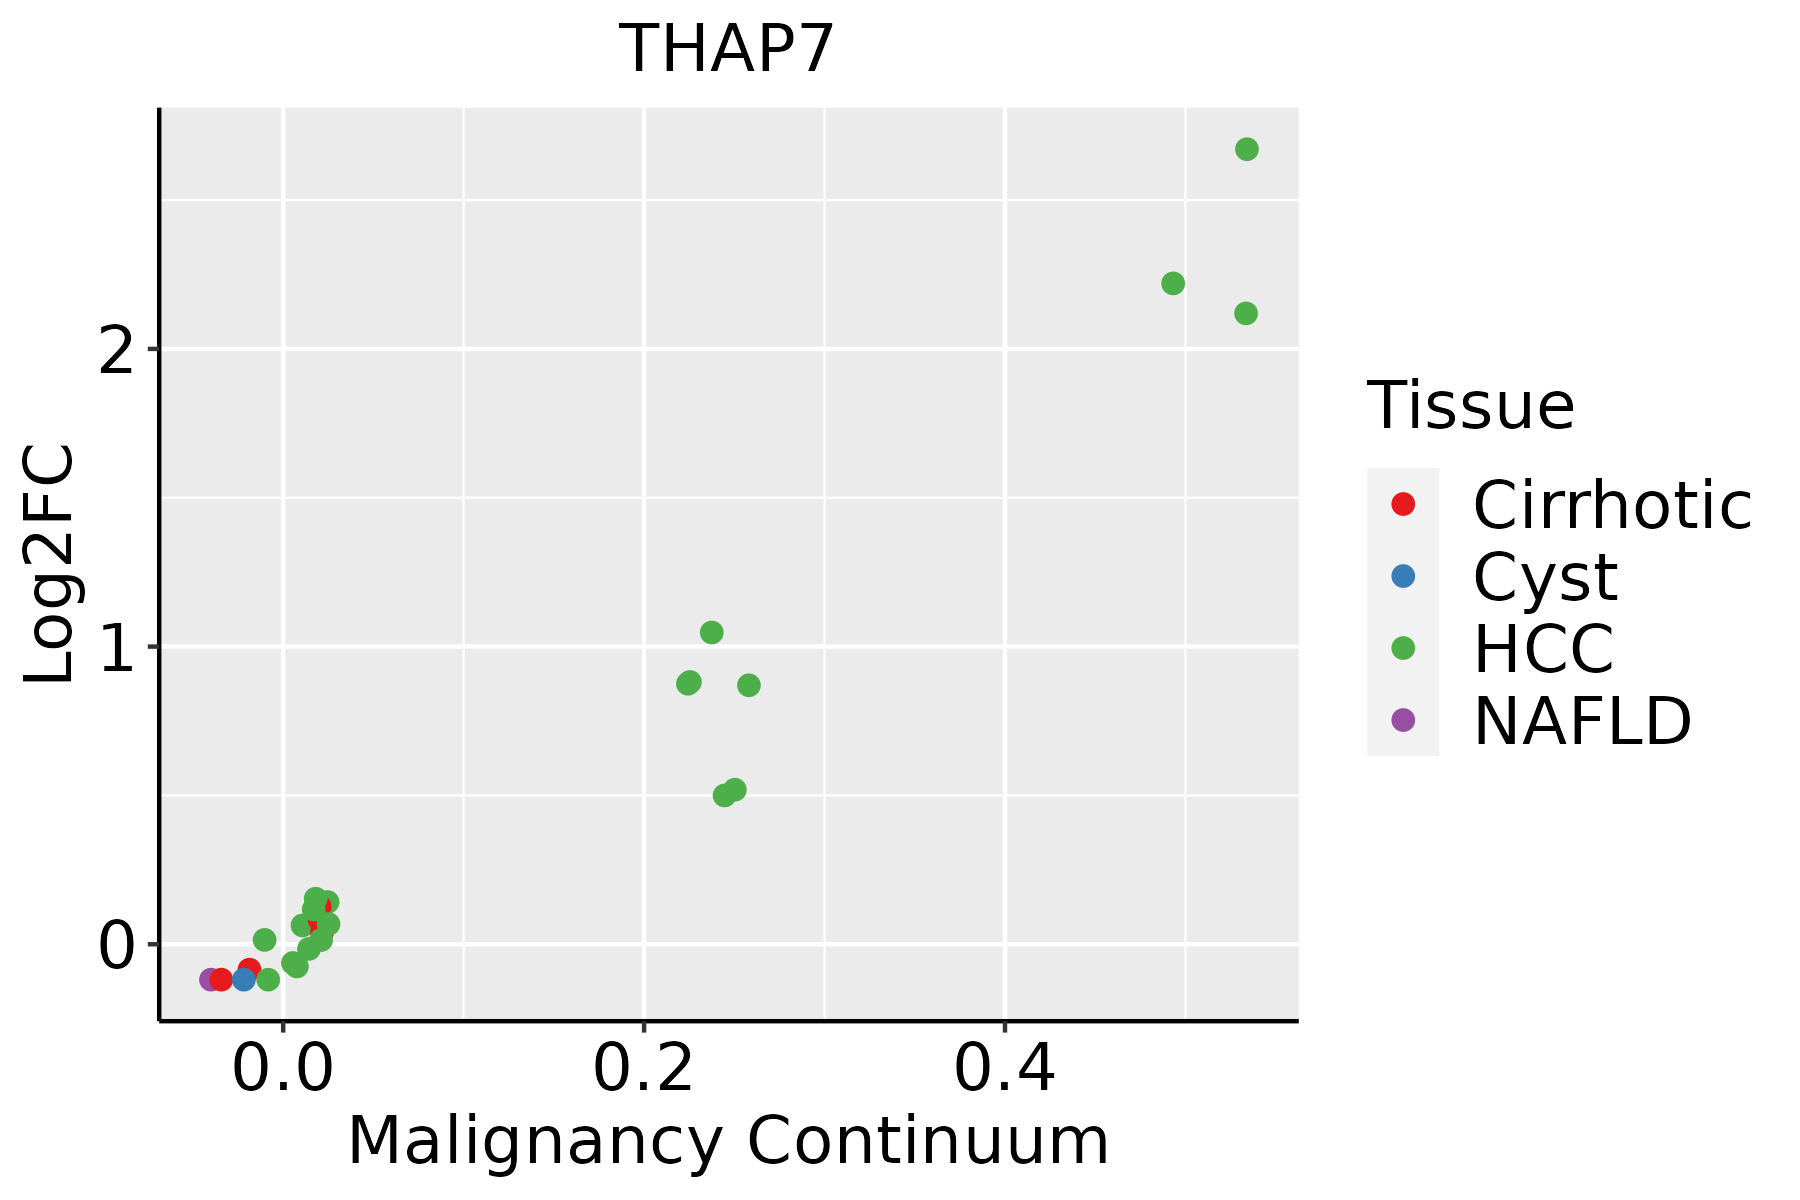 | HCC: Hepatocellular carcinoma |
| NAFLD: Non-alcoholic fatty liver disease | ||
| Oral Cavity | 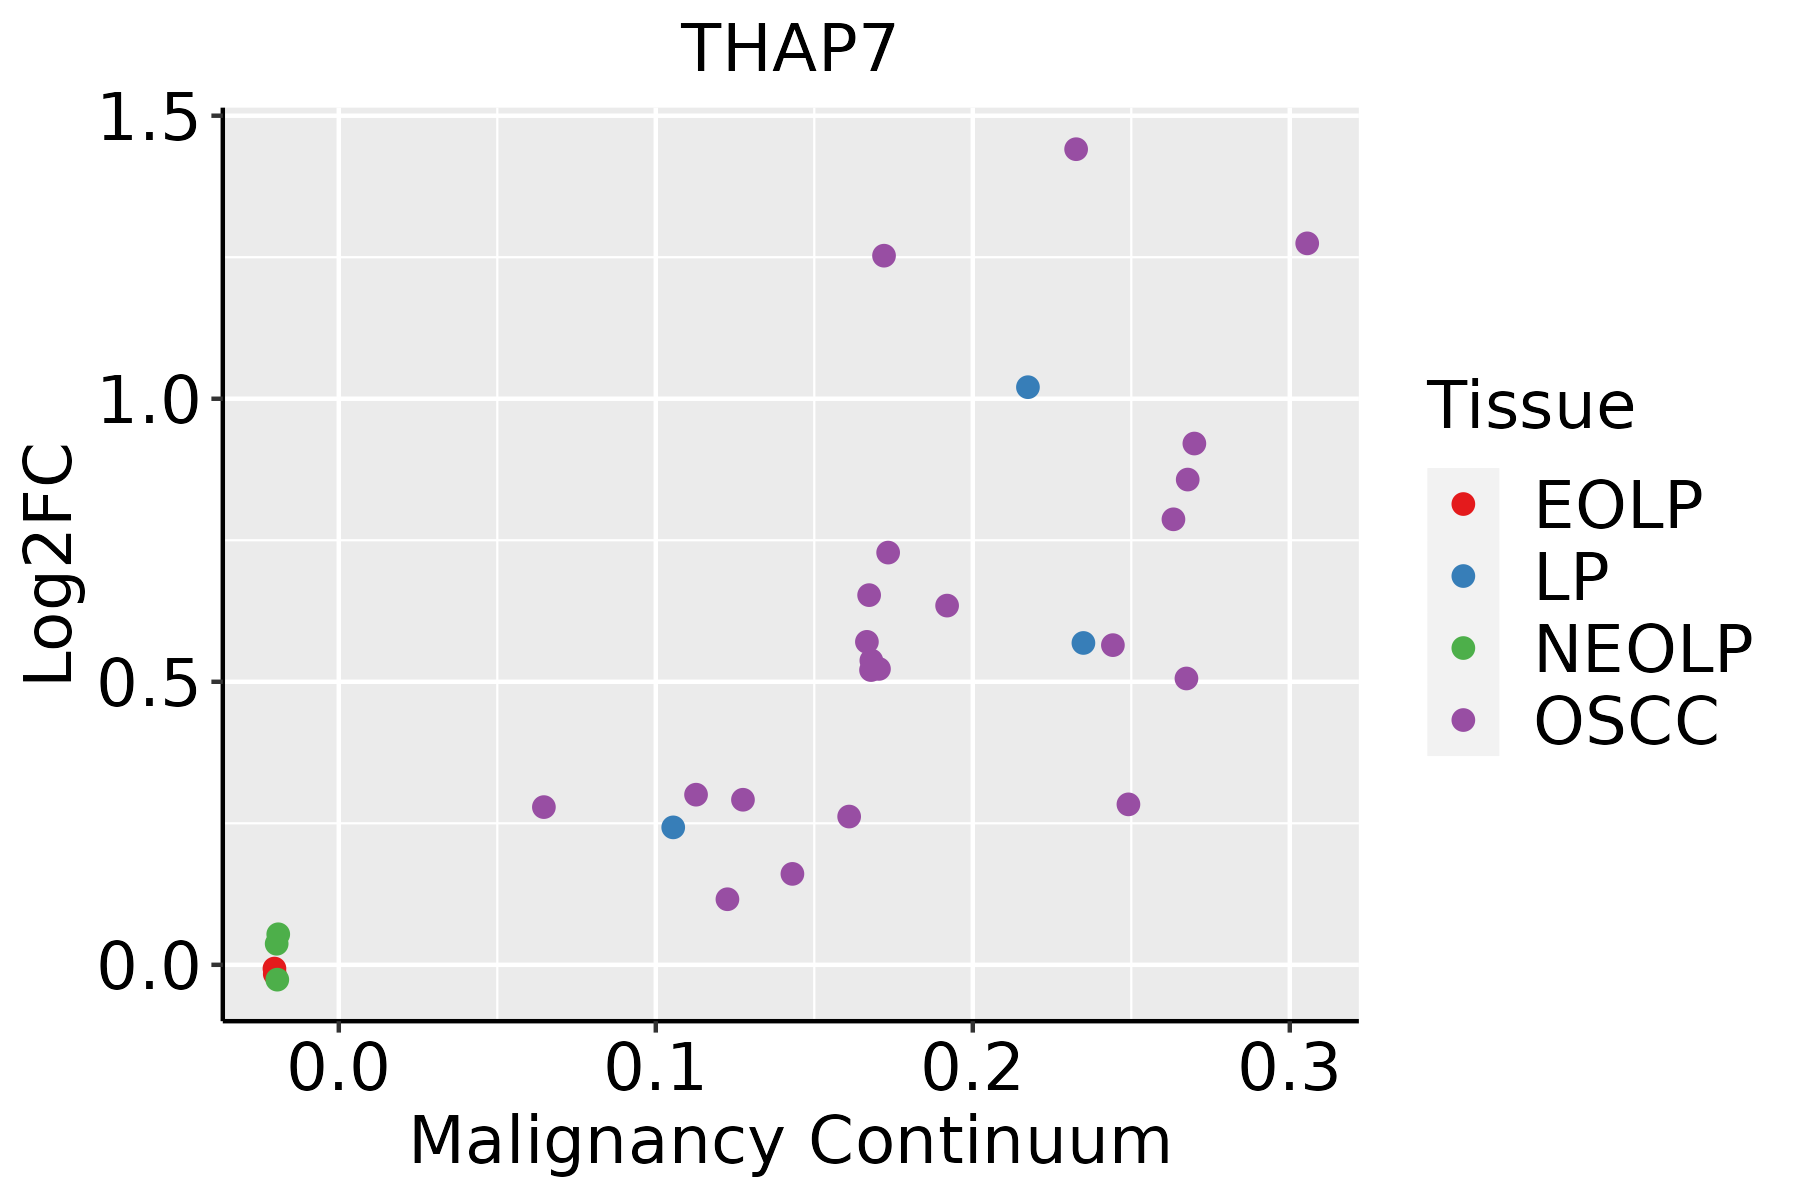 | EOLP: Erosive Oral lichen planus |
| LP: leukoplakia | ||
| NEOLP: Non-erosive oral lichen planus | ||
| OSCC: Oral squamous cell carcinoma |
| ∗log2FC in expression of this searched gene in stem-like cells from each diseased tissue sample relative to stem-like cells in normal samples in each tissue plotted against the malignancy continuum. Samples are colored based on if they are from different disease stage. |
Top |
Malignant transformation related pathway analysis |
| Find out the enriched GO biological processes and KEGG pathways involved in transition from healthy to precancer to cancer |
| Tissue | Disease Stage | Enriched GO biological Processes |
| Colorectum | AD |  |
| Colorectum | SER |  |
| Colorectum | MSS |  |
| Colorectum | MSI-H |  |
| Colorectum | FAP |  |
| ∗Top 15 enriched GO BP terms are showed in the bar plot of each disease state in each tissue. Each row represents a significant GO biological process which is colored according to the -log10(p.adjust). |
| Page: 1 2 3 4 5 6 7 8 9 |
| GO ID | Tissue | Disease Stage | Description | Gene Ratio | Bg Ratio | pvalue | p.adjust | Count |
| GO:00182057 | Esophagus | HGIN | peptidyl-lysine modification | 88/2587 | 376/18723 | 2.99e-07 | 1.39e-05 | 88 |
| GO:00165708 | Esophagus | HGIN | histone modification | 92/2587 | 463/18723 | 1.70e-04 | 3.30e-03 | 92 |
| GO:00064735 | Esophagus | HGIN | protein acetylation | 45/2587 | 201/18723 | 6.17e-04 | 8.58e-03 | 45 |
| GO:00310568 | Esophagus | HGIN | regulation of histone modification | 36/2587 | 152/18723 | 7.06e-04 | 9.52e-03 | 36 |
| GO:00183945 | Esophagus | HGIN | peptidyl-lysine acetylation | 39/2587 | 169/18723 | 7.46e-04 | 9.90e-03 | 39 |
| GO:00435435 | Esophagus | HGIN | protein acylation | 51/2587 | 243/18723 | 1.33e-03 | 1.57e-02 | 51 |
| GO:00064755 | Esophagus | HGIN | internal protein amino acid acetylation | 36/2587 | 160/18723 | 1.87e-03 | 2.01e-02 | 36 |
| GO:00310574 | Esophagus | HGIN | negative regulation of histone modification | 14/2587 | 46/18723 | 2.80e-03 | 2.74e-02 | 14 |
| GO:00183935 | Esophagus | HGIN | internal peptidyl-lysine acetylation | 35/2587 | 158/18723 | 2.82e-03 | 2.75e-02 | 35 |
| GO:001657015 | Esophagus | ESCC | histone modification | 323/8552 | 463/18723 | 2.61e-26 | 7.88e-24 | 323 |
| GO:001820514 | Esophagus | ESCC | peptidyl-lysine modification | 259/8552 | 376/18723 | 3.90e-20 | 5.26e-18 | 259 |
| GO:001839413 | Esophagus | ESCC | peptidyl-lysine acetylation | 123/8552 | 169/18723 | 6.58e-13 | 2.94e-11 | 123 |
| GO:004354313 | Esophagus | ESCC | protein acylation | 165/8552 | 243/18723 | 1.69e-12 | 7.14e-11 | 165 |
| GO:000647313 | Esophagus | ESCC | protein acetylation | 140/8552 | 201/18723 | 4.37e-12 | 1.69e-10 | 140 |
| GO:001839313 | Esophagus | ESCC | internal peptidyl-lysine acetylation | 114/8552 | 158/18723 | 1.16e-11 | 4.24e-10 | 114 |
| GO:000647513 | Esophagus | ESCC | internal protein amino acid acetylation | 115/8552 | 160/18723 | 1.43e-11 | 5.08e-10 | 115 |
| GO:00165735 | Esophagus | ESCC | histone acetylation | 110/8552 | 152/18723 | 1.95e-11 | 6.81e-10 | 110 |
| GO:003105614 | Esophagus | ESCC | regulation of histone modification | 106/8552 | 152/18723 | 1.52e-09 | 3.55e-08 | 106 |
| GO:20007564 | Esophagus | ESCC | regulation of peptidyl-lysine acetylation | 43/8552 | 63/18723 | 2.43e-04 | 1.50e-03 | 43 |
| GO:19019835 | Esophagus | ESCC | regulation of protein acetylation | 49/8552 | 77/18723 | 1.12e-03 | 5.60e-03 | 49 |
| Page: 1 2 3 4 5 |
| Pathway ID | Tissue | Disease Stage | Description | Gene Ratio | Bg Ratio | pvalue | p.adjust | qvalue | Count |
| Page: 1 |
Top |
Cell-cell communication analysis |
| Identification of potential cell-cell interactions between two cell types and their ligand-receptor pairs for different disease states |
| Ligand | Receptor | LRpair | Pathway | Tissue | Disease Stage |
| Page: 1 |
Top |
Single-cell gene regulatory network inference analysis |
| Find out the significant the regulons (TFs) and the target genes of each regulon across cell types for different disease states |
| TF | Cell Type | Tissue | Disease Stage | Target Gene | RSS | Regulon Activity |
| ∗The dot plots of a searched regulon are shown for all cell subpopulations in each disease state of each tissue based on the regulon specific score inferred using pySCENIC and by calculating the average expression. |
| Page: 1 |
Top |
Somatic mutation of malignant transformation related genes |
| Annotation of somatic variants for genes involved in malignant transformation |
| Hugo Symbol | Variant Class | Variant Classification | dbSNP RS | HGVSc | HGVSp | HGVSp Short | SWISSPROT | BIOTYPE | SIFT | PolyPhen | Tumor Sample Barcode | Tissue | Histology | Sex | Age | Stage | Therapy Types | Drugs | Outcome |
| THAP7 | SNV | Missense_Mutation | rs755408769 | c.392N>A | p.Arg131Gln | p.R131Q | Q9BT49 | protein_coding | tolerated(0.69) | benign(0) | TCGA-5L-AAT1-01 | Breast | breast invasive carcinoma | Female | <65 | III/IV | Hormone Therapy | letrozol | SD |
| THAP7 | SNV | Missense_Mutation | rs754815287 | c.667G>A | p.Gly223Arg | p.G223R | Q9BT49 | protein_coding | tolerated(0.08) | probably_damaging(0.998) | TCGA-A1-A0SP-01 | Breast | breast invasive carcinoma | Female | <65 | I/II | Chemotherapy | SD | |
| THAP7 | SNV | Missense_Mutation | c.832G>C | p.Glu278Gln | p.E278Q | Q9BT49 | protein_coding | tolerated(0.07) | probably_damaging(0.932) | TCGA-A2-A0SY-01 | Breast | breast invasive carcinoma | Female | <65 | III/IV | Hormone Therapy | arimidex | SD | |
| THAP7 | SNV | Missense_Mutation | novel | c.386N>G | p.Glu129Gly | p.E129G | Q9BT49 | protein_coding | tolerated(0.1) | benign(0) | TCGA-AO-A0J3-01 | Breast | breast invasive carcinoma | Female | >=65 | I/II | Chemotherapy | cyclophosphamide | SD |
| THAP7 | SNV | Missense_Mutation | rs755408769 | c.392G>C | p.Arg131Pro | p.R131P | Q9BT49 | protein_coding | tolerated(0.29) | benign(0) | TCGA-C5-A8XJ-01 | Cervix | cervical & endocervical cancer | Female | >=65 | I/II | Chemotherapy | cisplatin | SD |
| THAP7 | SNV | Missense_Mutation | c.572N>A | p.Cys191Tyr | p.C191Y | Q9BT49 | protein_coding | tolerated(0.27) | benign(0) | TCGA-EK-A2GZ-01 | Cervix | cervical & endocervical cancer | Female | <65 | III/IV | Unknown | Unknown | SD | |
| THAP7 | SNV | Missense_Mutation | rs755408769 | c.392N>A | p.Arg131Gln | p.R131Q | Q9BT49 | protein_coding | tolerated(0.69) | benign(0) | TCGA-JX-A3Q0-01 | Cervix | cervical & endocervical cancer | Female | <65 | III/IV | Unknown | Unknown | SD |
| THAP7 | SNV | Missense_Mutation | novel | c.161G>T | p.Trp54Leu | p.W54L | Q9BT49 | protein_coding | deleterious(0) | probably_damaging(0.982) | TCGA-VS-A94X-01 | Cervix | cervical & endocervical cancer | Female | <65 | I/II | Chemotherapy | cisplatin | PD |
| THAP7 | SNV | Missense_Mutation | rs755408769 | c.392N>A | p.Arg131Gln | p.R131Q | Q9BT49 | protein_coding | tolerated(0.69) | benign(0) | TCGA-ZJ-AAXU-01 | Cervix | cervical & endocervical cancer | Female | <65 | I/II | Unknown | Unknown | SD |
| THAP7 | deletion | Frame_Shift_Del | c.343delN | p.Ala115LeufsTer156 | p.A115Lfs*156 | Q9BT49 | protein_coding | TCGA-VS-A94Z-01 | Cervix | cervical & endocervical cancer | Female | <65 | I/II | Chemotherapy | cisplatin | CR |
| Page: 1 2 3 |
Top |
Related drugs of malignant transformation related genes |
| Identification of chemicals and drugs interact with genes involved in malignant transfromation |
| (DGIdb 4.0) |
| Entrez ID | Symbol | Category | Interaction Types | Drug Claim Name | Drug Name | PMIDs |
| Page: 1 |

Copyright 2023-Present -The University of Texas Health Science Center at Houston |