
|
|||||
|
 | |
| |
| |
| |
| |
| |
|
Gene: THAP4 |
Gene summary for THAP4 |
| Gene information | Species | Human | Gene symbol | THAP4 | Gene ID | 51078 |
| Gene name | THAP domain containing 4 | |
| Gene Alias | CGI-36 | |
| Cytomap | 2q37.3 | |
| Gene Type | protein-coding | GO ID | GO:0006082 | UniProtAcc | Q8WY91 |
Top |
Malignant transformation analysis |
| Identification of the aberrant gene expression in precancerous and cancerous lesions by comparing the gene expression of stem-like cells in diseased tissues with normal stem cells |
| Entrez ID | Symbol | Replicates | Species | Organ | Tissue | Adj P-value | Log2FC | Malignancy |
| 51078 | THAP4 | LZE4T | Human | Esophagus | ESCC | 2.14e-03 | 4.90e-02 | 0.0811 |
| 51078 | THAP4 | LZE8T | Human | Esophagus | ESCC | 7.70e-07 | 1.83e-01 | 0.067 |
| 51078 | THAP4 | LZE20T | Human | Esophagus | ESCC | 1.24e-03 | 6.37e-02 | 0.0662 |
| 51078 | THAP4 | LZE22T | Human | Esophagus | ESCC | 2.61e-02 | 4.28e-01 | 0.068 |
| 51078 | THAP4 | LZE24T | Human | Esophagus | ESCC | 7.71e-20 | 6.50e-01 | 0.0596 |
| 51078 | THAP4 | P1T-E | Human | Esophagus | ESCC | 3.86e-09 | 5.77e-01 | 0.0875 |
| 51078 | THAP4 | P2T-E | Human | Esophagus | ESCC | 7.42e-17 | 4.27e-01 | 0.1177 |
| 51078 | THAP4 | P4T-E | Human | Esophagus | ESCC | 1.16e-15 | 3.53e-01 | 0.1323 |
| 51078 | THAP4 | P5T-E | Human | Esophagus | ESCC | 4.52e-18 | 4.60e-01 | 0.1327 |
| 51078 | THAP4 | P8T-E | Human | Esophagus | ESCC | 1.26e-22 | 3.98e-01 | 0.0889 |
| 51078 | THAP4 | P9T-E | Human | Esophagus | ESCC | 1.25e-19 | 3.88e-01 | 0.1131 |
| 51078 | THAP4 | P10T-E | Human | Esophagus | ESCC | 7.65e-16 | 3.14e-01 | 0.116 |
| 51078 | THAP4 | P11T-E | Human | Esophagus | ESCC | 4.46e-14 | 5.83e-01 | 0.1426 |
| 51078 | THAP4 | P12T-E | Human | Esophagus | ESCC | 7.36e-23 | 4.98e-01 | 0.1122 |
| 51078 | THAP4 | P15T-E | Human | Esophagus | ESCC | 2.36e-39 | 8.66e-01 | 0.1149 |
| 51078 | THAP4 | P16T-E | Human | Esophagus | ESCC | 1.33e-23 | 3.74e-01 | 0.1153 |
| 51078 | THAP4 | P17T-E | Human | Esophagus | ESCC | 1.27e-04 | 3.62e-01 | 0.1278 |
| 51078 | THAP4 | P19T-E | Human | Esophagus | ESCC | 1.24e-04 | 6.34e-01 | 0.1662 |
| 51078 | THAP4 | P20T-E | Human | Esophagus | ESCC | 1.11e-19 | 4.75e-01 | 0.1124 |
| 51078 | THAP4 | P21T-E | Human | Esophagus | ESCC | 4.49e-33 | 7.45e-01 | 0.1617 |
| Page: 1 2 3 4 5 6 |
| Tissue | Expression Dynamics | Abbreviation |
| Esophagus |  | ESCC: Esophageal squamous cell carcinoma |
| HGIN: High-grade intraepithelial neoplasias | ||
| LGIN: Low-grade intraepithelial neoplasias | ||
| Liver | 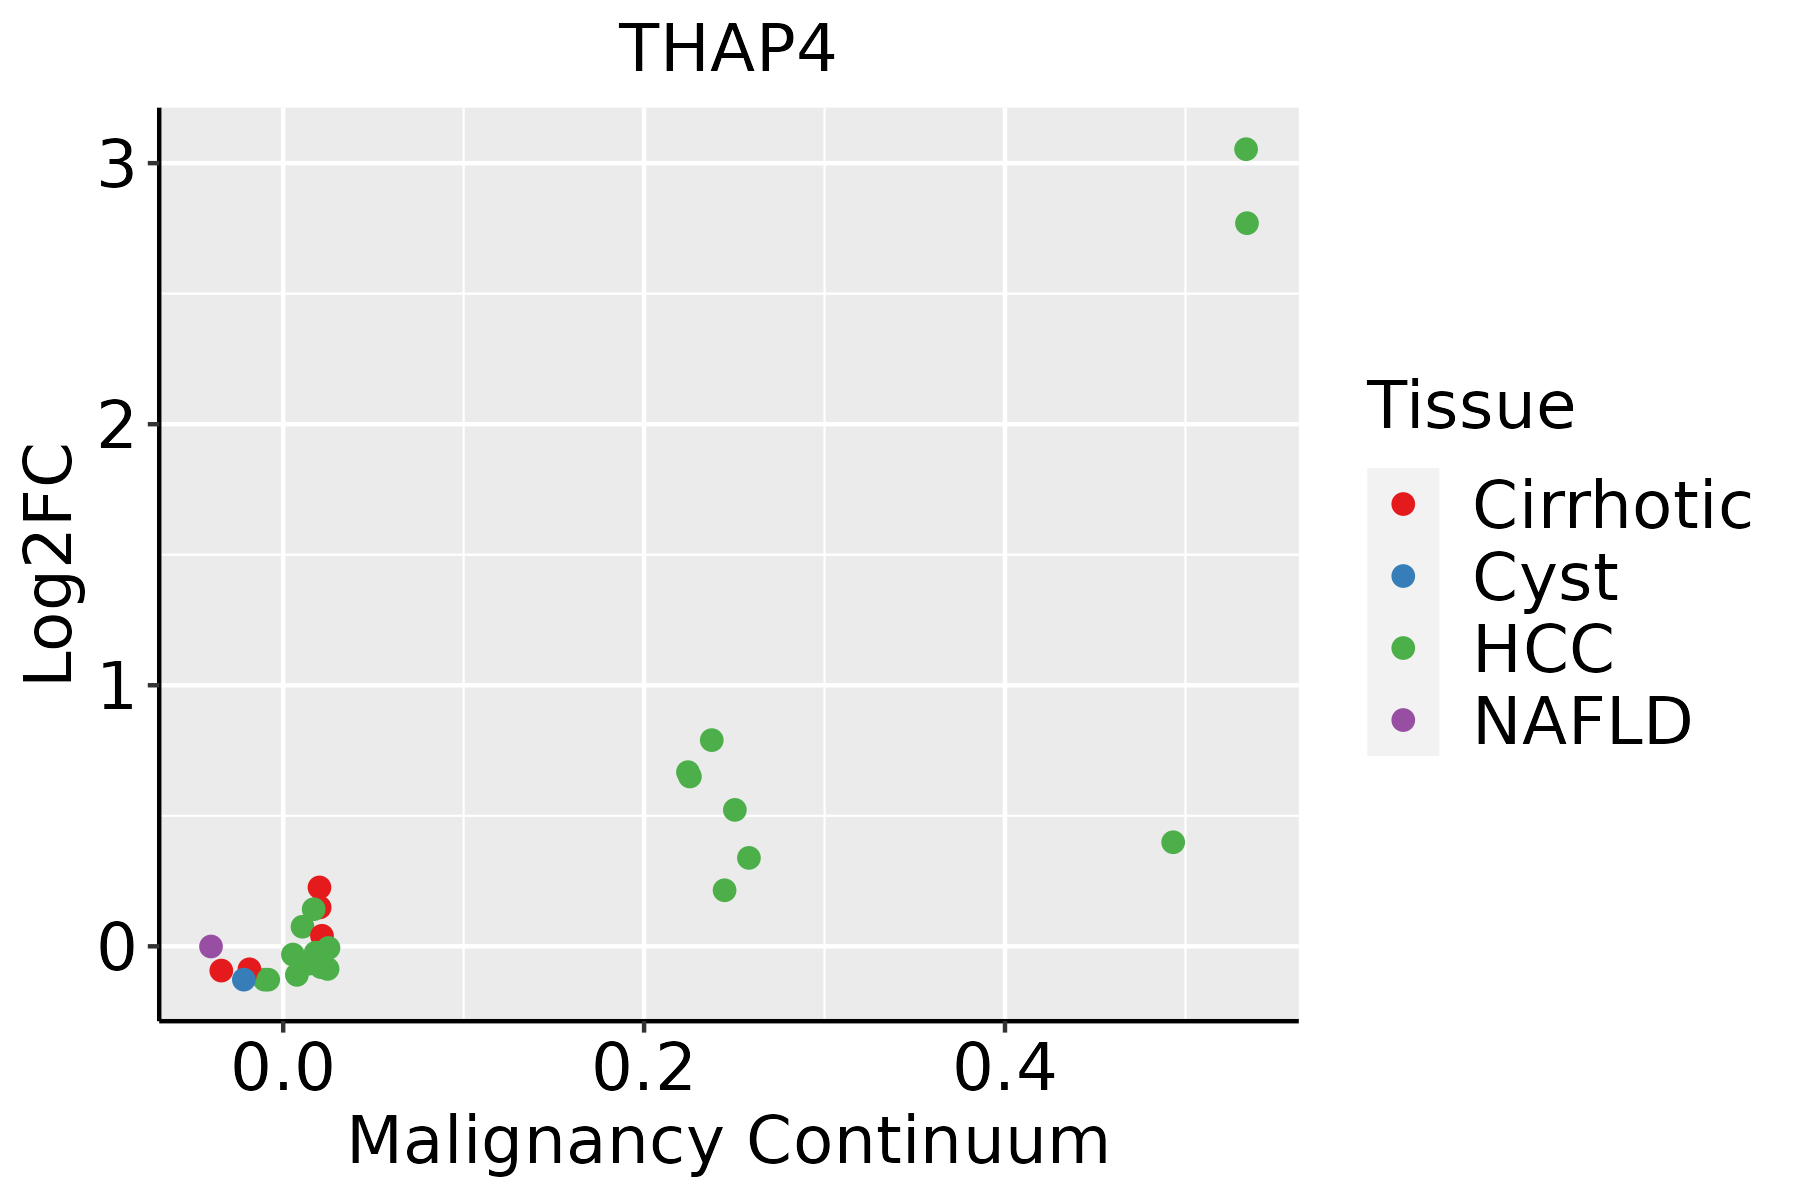 | HCC: Hepatocellular carcinoma |
| NAFLD: Non-alcoholic fatty liver disease | ||
| Oral Cavity | 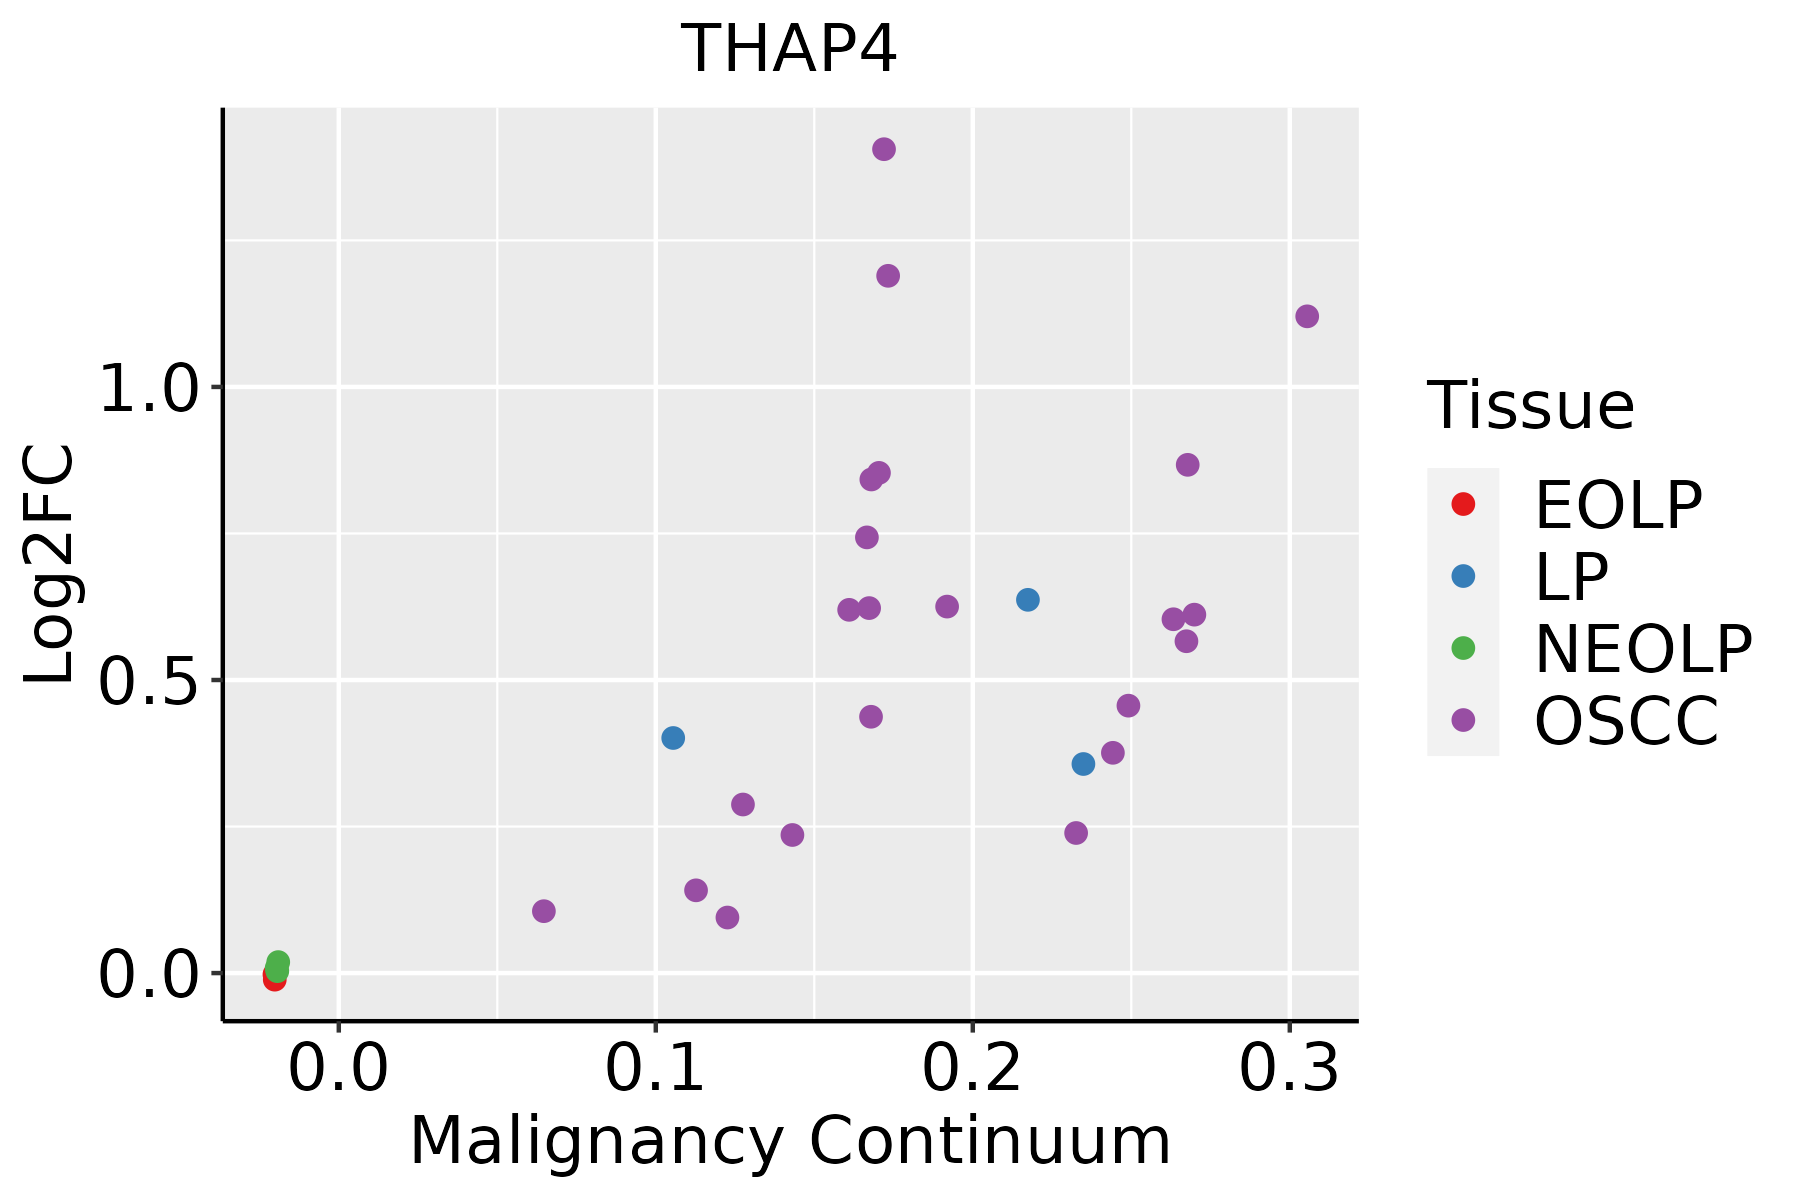 | EOLP: Erosive Oral lichen planus |
| LP: leukoplakia | ||
| NEOLP: Non-erosive oral lichen planus | ||
| OSCC: Oral squamous cell carcinoma | ||
| Skin | 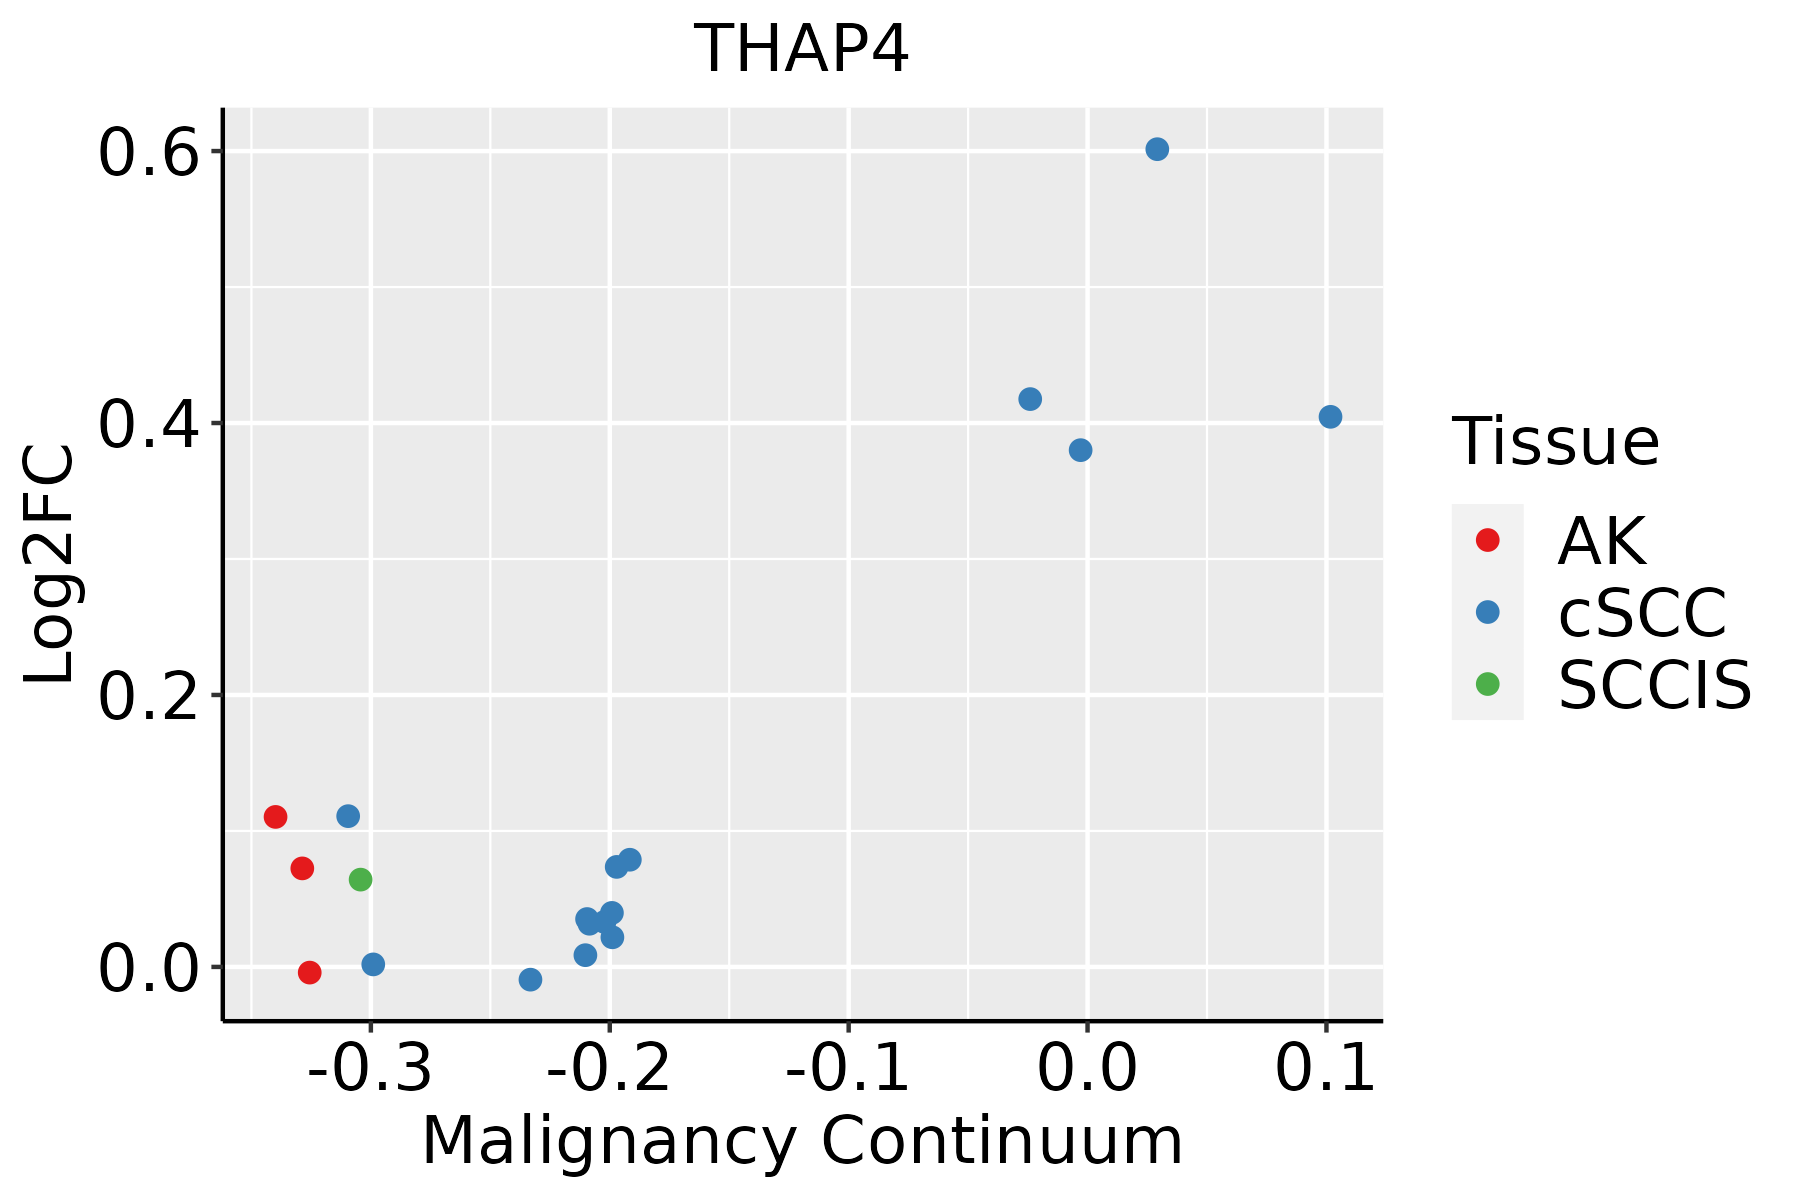 | AK: Actinic keratosis |
| cSCC: Cutaneous squamous cell carcinoma | ||
| SCCIS:squamous cell carcinoma in situ | ||
| Thyroid | 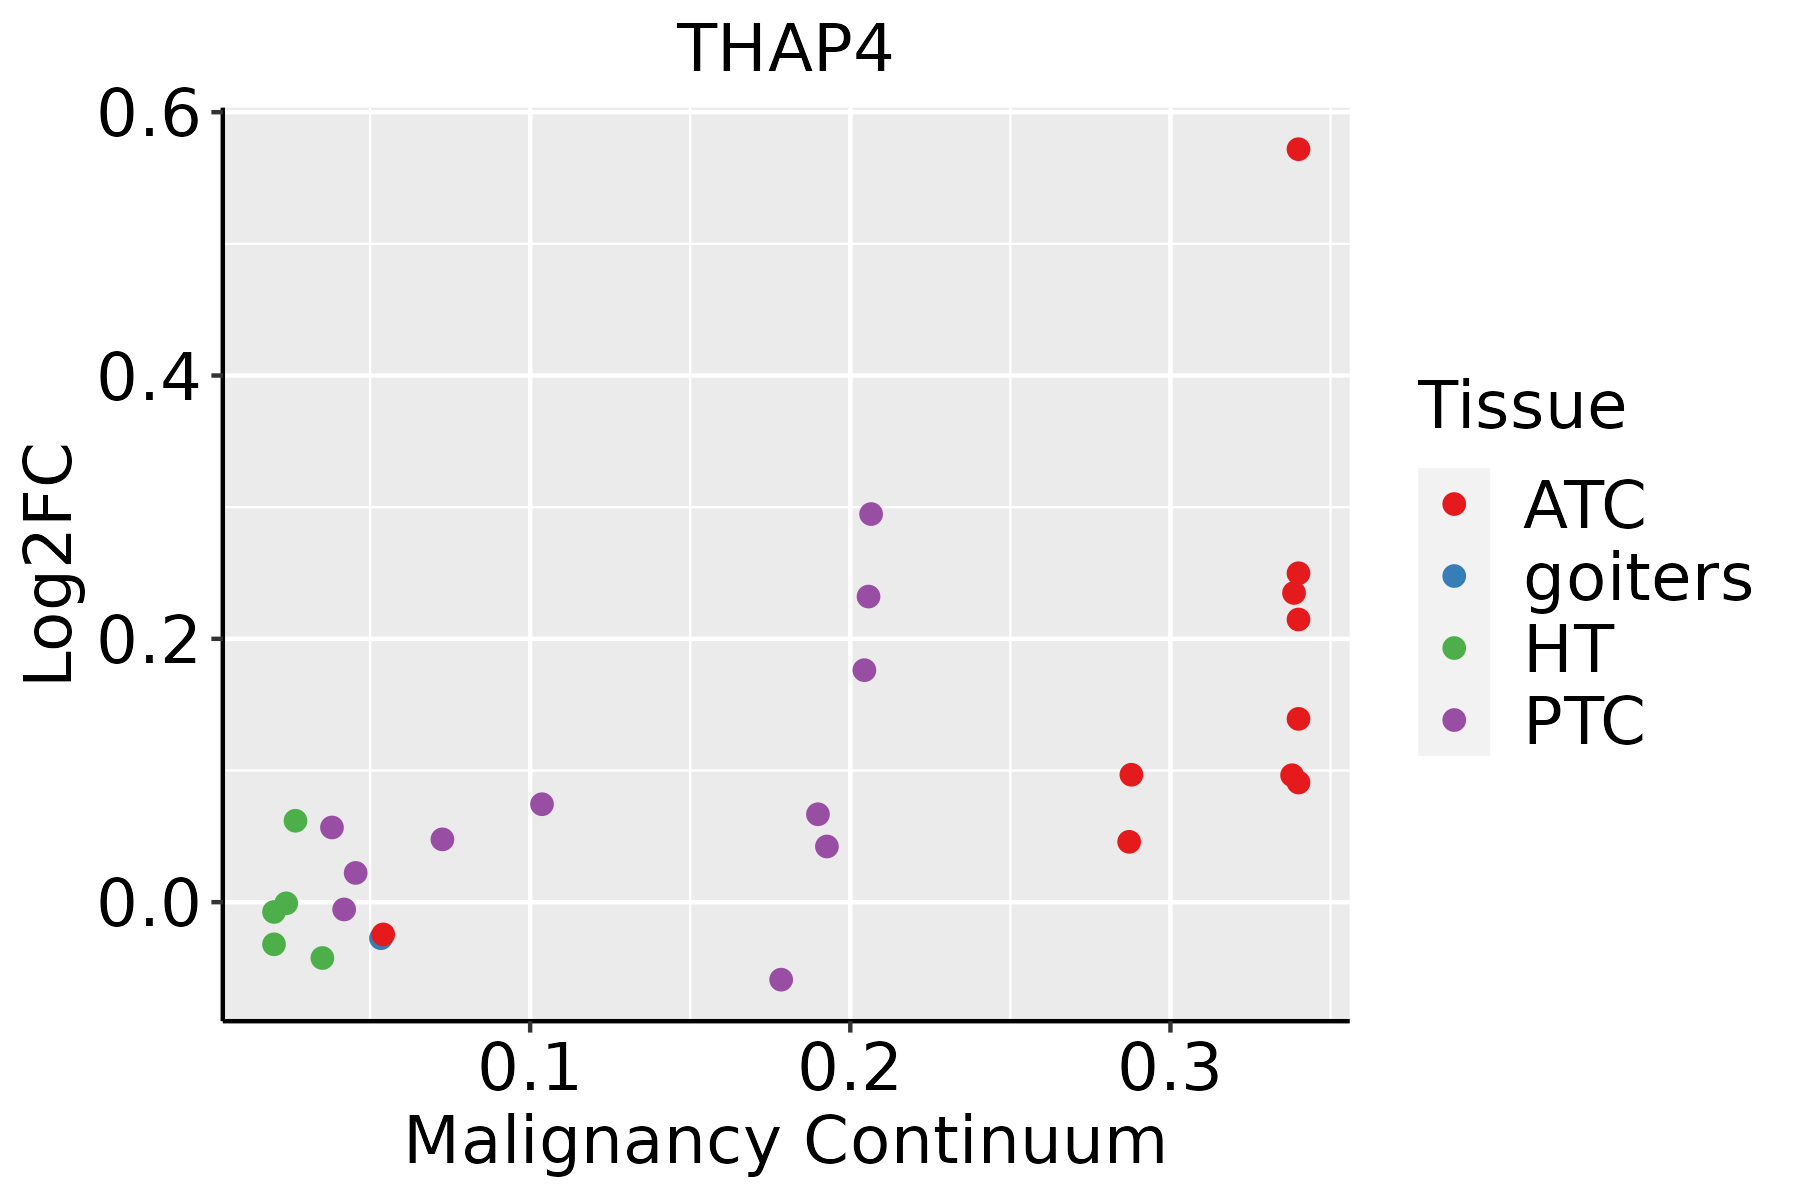 | ATC: Anaplastic thyroid cancer |
| HT: Hashimoto's thyroiditis | ||
| PTC: Papillary thyroid cancer |
| ∗log2FC in expression of this searched gene in stem-like cells from each diseased tissue sample relative to stem-like cells in normal samples in each tissue plotted against the malignancy continuum. Samples are colored based on if they are from different disease stage. |
Top |
Malignant transformation related pathway analysis |
| Find out the enriched GO biological processes and KEGG pathways involved in transition from healthy to precancer to cancer |
| Tissue | Disease Stage | Enriched GO biological Processes |
| Colorectum | AD |  |
| Colorectum | SER |  |
| Colorectum | MSS |  |
| Colorectum | MSI-H |  |
| Colorectum | FAP |  |
| ∗Top 15 enriched GO BP terms are showed in the bar plot of each disease state in each tissue. Each row represents a significant GO biological process which is colored according to the -log10(p.adjust). |
| Page: 1 2 3 4 5 6 7 8 9 |
| GO ID | Tissue | Disease Stage | Description | Gene Ratio | Bg Ratio | pvalue | p.adjust | Count |
| GO:200105717 | Esophagus | ESCC | reactive nitrogen species metabolic process | 50/8552 | 82/18723 | 3.76e-03 | 1.53e-02 | 50 |
| GO:19016051 | Liver | Cirrhotic | alpha-amino acid metabolic process | 82/4634 | 195/18723 | 7.72e-08 | 2.30e-06 | 82 |
| GO:000652011 | Liver | Cirrhotic | cellular amino acid metabolic process | 103/4634 | 284/18723 | 8.88e-06 | 1.30e-04 | 103 |
| GO:200105712 | Liver | Cirrhotic | reactive nitrogen species metabolic process | 34/4634 | 82/18723 | 6.36e-04 | 4.85e-03 | 34 |
| GO:19016052 | Liver | HCC | alpha-amino acid metabolic process | 124/7958 | 195/18723 | 2.07e-09 | 5.79e-08 | 124 |
| GO:00065202 | Liver | HCC | cellular amino acid metabolic process | 167/7958 | 284/18723 | 1.91e-08 | 4.56e-07 | 167 |
| GO:200105722 | Liver | HCC | reactive nitrogen species metabolic process | 51/7958 | 82/18723 | 2.50e-04 | 1.86e-03 | 51 |
| GO:200105715 | Oral cavity | OSCC | reactive nitrogen species metabolic process | 43/7305 | 82/18723 | 9.20e-03 | 3.30e-02 | 43 |
| GO:200105718 | Thyroid | PTC | reactive nitrogen species metabolic process | 38/5968 | 82/18723 | 4.25e-03 | 2.02e-02 | 38 |
| GO:200105724 | Thyroid | ATC | reactive nitrogen species metabolic process | 40/6293 | 82/18723 | 3.13e-03 | 1.41e-02 | 40 |
| Page: 1 |
| Pathway ID | Tissue | Disease Stage | Description | Gene Ratio | Bg Ratio | pvalue | p.adjust | qvalue | Count |
| Page: 1 |
Top |
Cell-cell communication analysis |
| Identification of potential cell-cell interactions between two cell types and their ligand-receptor pairs for different disease states |
| Ligand | Receptor | LRpair | Pathway | Tissue | Disease Stage |
| Page: 1 |
Top |
Single-cell gene regulatory network inference analysis |
| Find out the significant the regulons (TFs) and the target genes of each regulon across cell types for different disease states |
| TF | Cell Type | Tissue | Disease Stage | Target Gene | RSS | Regulon Activity |
| ∗The dot plots of a searched regulon are shown for all cell subpopulations in each disease state of each tissue based on the regulon specific score inferred using pySCENIC and by calculating the average expression. |
| Page: 1 |
Top |
Somatic mutation of malignant transformation related genes |
| Annotation of somatic variants for genes involved in malignant transformation |
| Hugo Symbol | Variant Class | Variant Classification | dbSNP RS | HGVSc | HGVSp | HGVSp Short | SWISSPROT | BIOTYPE | SIFT | PolyPhen | Tumor Sample Barcode | Tissue | Histology | Sex | Age | Stage | Therapy Types | Drugs | Outcome |
| THAP4 | SNV | Missense_Mutation | novel | c.1715N>G | p.Tyr572Cys | p.Y572C | Q8WY91 | protein_coding | deleterious(0) | probably_damaging(1) | TCGA-AR-A2LH-01 | Breast | breast invasive carcinoma | Female | <65 | III/IV | Chemotherapy | adriamycin | PD |
| THAP4 | SNV | Missense_Mutation | rs779736769 | c.967N>A | p.Ala323Thr | p.A323T | Q8WY91 | protein_coding | tolerated_low_confidence(0.11) | possibly_damaging(0.448) | TCGA-EA-A4BA-01 | Cervix | cervical & endocervical cancer | Female | <65 | I/II | Chemotherapy | carboplatin | CR |
| THAP4 | SNV | Missense_Mutation | rs775668991 | c.518N>A | p.Arg173Gln | p.R173Q | Q8WY91 | protein_coding | deleterious_low_confidence(0.05) | benign(0.043) | TCGA-A6-6654-01 | Colorectum | colon adenocarcinoma | Female | >=65 | III/IV | Chemotherapy | oxaliplatin | SD |
| THAP4 | SNV | Missense_Mutation | c.581C>T | p.Ala194Val | p.A194V | Q8WY91 | protein_coding | deleterious_low_confidence(0.01) | benign(0.003) | TCGA-AA-3663-01 | Colorectum | colon adenocarcinoma | Male | <65 | I/II | Unknown | Unknown | SD | |
| THAP4 | SNV | Missense_Mutation | c.206N>A | p.Leu69Gln | p.L69Q | Q8WY91 | protein_coding | tolerated_low_confidence(0.19) | probably_damaging(0.999) | TCGA-AA-A01R-01 | Colorectum | colon adenocarcinoma | Male | <65 | III/IV | Chemotherapy | 5-fluorouracil | PD | |
| THAP4 | SNV | Missense_Mutation | c.772N>T | p.Arg258Cys | p.R258C | Q8WY91 | protein_coding | deleterious_low_confidence(0) | probably_damaging(0.994) | TCGA-CM-6162-01 | Colorectum | colon adenocarcinoma | Female | <65 | III/IV | Chemotherapy | oxaliplatin | SD | |
| THAP4 | SNV | Missense_Mutation | rs770030779 | c.1591N>A | p.Ala531Thr | p.A531T | Q8WY91 | protein_coding | deleterious(0.02) | possibly_damaging(0.835) | TCGA-CM-6676-01 | Colorectum | colon adenocarcinoma | Male | >=65 | I/II | Unknown | Unknown | SD |
| THAP4 | SNV | Missense_Mutation | novel | c.851N>A | p.Pro284His | p.P284H | Q8WY91 | protein_coding | deleterious_low_confidence(0) | possibly_damaging(0.533) | TCGA-AJ-A3BH-01 | Endometrium | uterine corpus endometrioid carcinoma | Female | Unknown | I/II | Unknown | Unknown | SD |
| THAP4 | SNV | Missense_Mutation | novel | c.1667N>A | p.Ser556Tyr | p.S556Y | Q8WY91 | protein_coding | tolerated(0.22) | probably_damaging(0.974) | TCGA-AJ-A3EK-01 | Endometrium | uterine corpus endometrioid carcinoma | Female | <65 | I/II | Chemotherapy | carboplatin | CR |
| THAP4 | SNV | Missense_Mutation | c.428N>T | p.Arg143Met | p.R143M | Q8WY91 | protein_coding | deleterious_low_confidence(0.01) | benign(0.275) | TCGA-AP-A051-01 | Endometrium | uterine corpus endometrioid carcinoma | Female | >=65 | I/II | Unknown | Unknown | SD |
| Page: 1 2 3 4 |
Top |
Related drugs of malignant transformation related genes |
| Identification of chemicals and drugs interact with genes involved in malignant transfromation |
| (DGIdb 4.0) |
| Entrez ID | Symbol | Category | Interaction Types | Drug Claim Name | Drug Name | PMIDs |
| Page: 1 |

Copyright 2023-Present -The University of Texas Health Science Center at Houston |