
|
|||||
|
 | |
| |
| |
| |
| |
| |
|
Gene: THAP1 |
Gene summary for THAP1 |
| Gene information | Species | Human | Gene symbol | THAP1 | Gene ID | 55145 |
| Gene name | THAP domain containing 1 | |
| Gene Alias | DYT6 | |
| Cytomap | 8p11.21 | |
| Gene Type | protein-coding | GO ID | GO:0000122 | UniProtAcc | Q9NVV9 |
Top |
Malignant transformation analysis |
| Identification of the aberrant gene expression in precancerous and cancerous lesions by comparing the gene expression of stem-like cells in diseased tissues with normal stem cells |
| Entrez ID | Symbol | Replicates | Species | Organ | Tissue | Adj P-value | Log2FC | Malignancy |
| 55145 | THAP1 | LZE4T | Human | Esophagus | ESCC | 3.08e-12 | 3.13e-01 | 0.0811 |
| 55145 | THAP1 | LZE7T | Human | Esophagus | ESCC | 1.30e-02 | 1.82e-01 | 0.0667 |
| 55145 | THAP1 | LZE8T | Human | Esophagus | ESCC | 8.72e-03 | 1.47e-01 | 0.067 |
| 55145 | THAP1 | LZE20T | Human | Esophagus | ESCC | 5.71e-07 | 2.19e-01 | 0.0662 |
| 55145 | THAP1 | LZE24T | Human | Esophagus | ESCC | 1.28e-09 | 2.40e-01 | 0.0596 |
| 55145 | THAP1 | LZE6T | Human | Esophagus | ESCC | 9.36e-10 | 2.64e-01 | 0.0845 |
| 55145 | THAP1 | P1T-E | Human | Esophagus | ESCC | 2.68e-03 | 1.33e-01 | 0.0875 |
| 55145 | THAP1 | P2T-E | Human | Esophagus | ESCC | 4.23e-17 | 3.16e-01 | 0.1177 |
| 55145 | THAP1 | P4T-E | Human | Esophagus | ESCC | 2.39e-21 | 4.28e-01 | 0.1323 |
| 55145 | THAP1 | P5T-E | Human | Esophagus | ESCC | 8.00e-09 | 1.87e-01 | 0.1327 |
| 55145 | THAP1 | P8T-E | Human | Esophagus | ESCC | 1.90e-13 | 2.09e-01 | 0.0889 |
| 55145 | THAP1 | P9T-E | Human | Esophagus | ESCC | 3.82e-11 | 2.58e-01 | 0.1131 |
| 55145 | THAP1 | P10T-E | Human | Esophagus | ESCC | 9.07e-18 | 3.25e-01 | 0.116 |
| 55145 | THAP1 | P11T-E | Human | Esophagus | ESCC | 3.00e-17 | 5.42e-01 | 0.1426 |
| 55145 | THAP1 | P12T-E | Human | Esophagus | ESCC | 1.78e-15 | 3.72e-01 | 0.1122 |
| 55145 | THAP1 | P15T-E | Human | Esophagus | ESCC | 2.82e-28 | 6.22e-01 | 0.1149 |
| 55145 | THAP1 | P16T-E | Human | Esophagus | ESCC | 6.96e-41 | 6.59e-01 | 0.1153 |
| 55145 | THAP1 | P17T-E | Human | Esophagus | ESCC | 9.90e-09 | 2.06e-01 | 0.1278 |
| 55145 | THAP1 | P19T-E | Human | Esophagus | ESCC | 4.46e-03 | 2.51e-01 | 0.1662 |
| 55145 | THAP1 | P20T-E | Human | Esophagus | ESCC | 1.49e-16 | 3.95e-01 | 0.1124 |
| Page: 1 2 3 4 |
| Tissue | Expression Dynamics | Abbreviation |
| Esophagus | 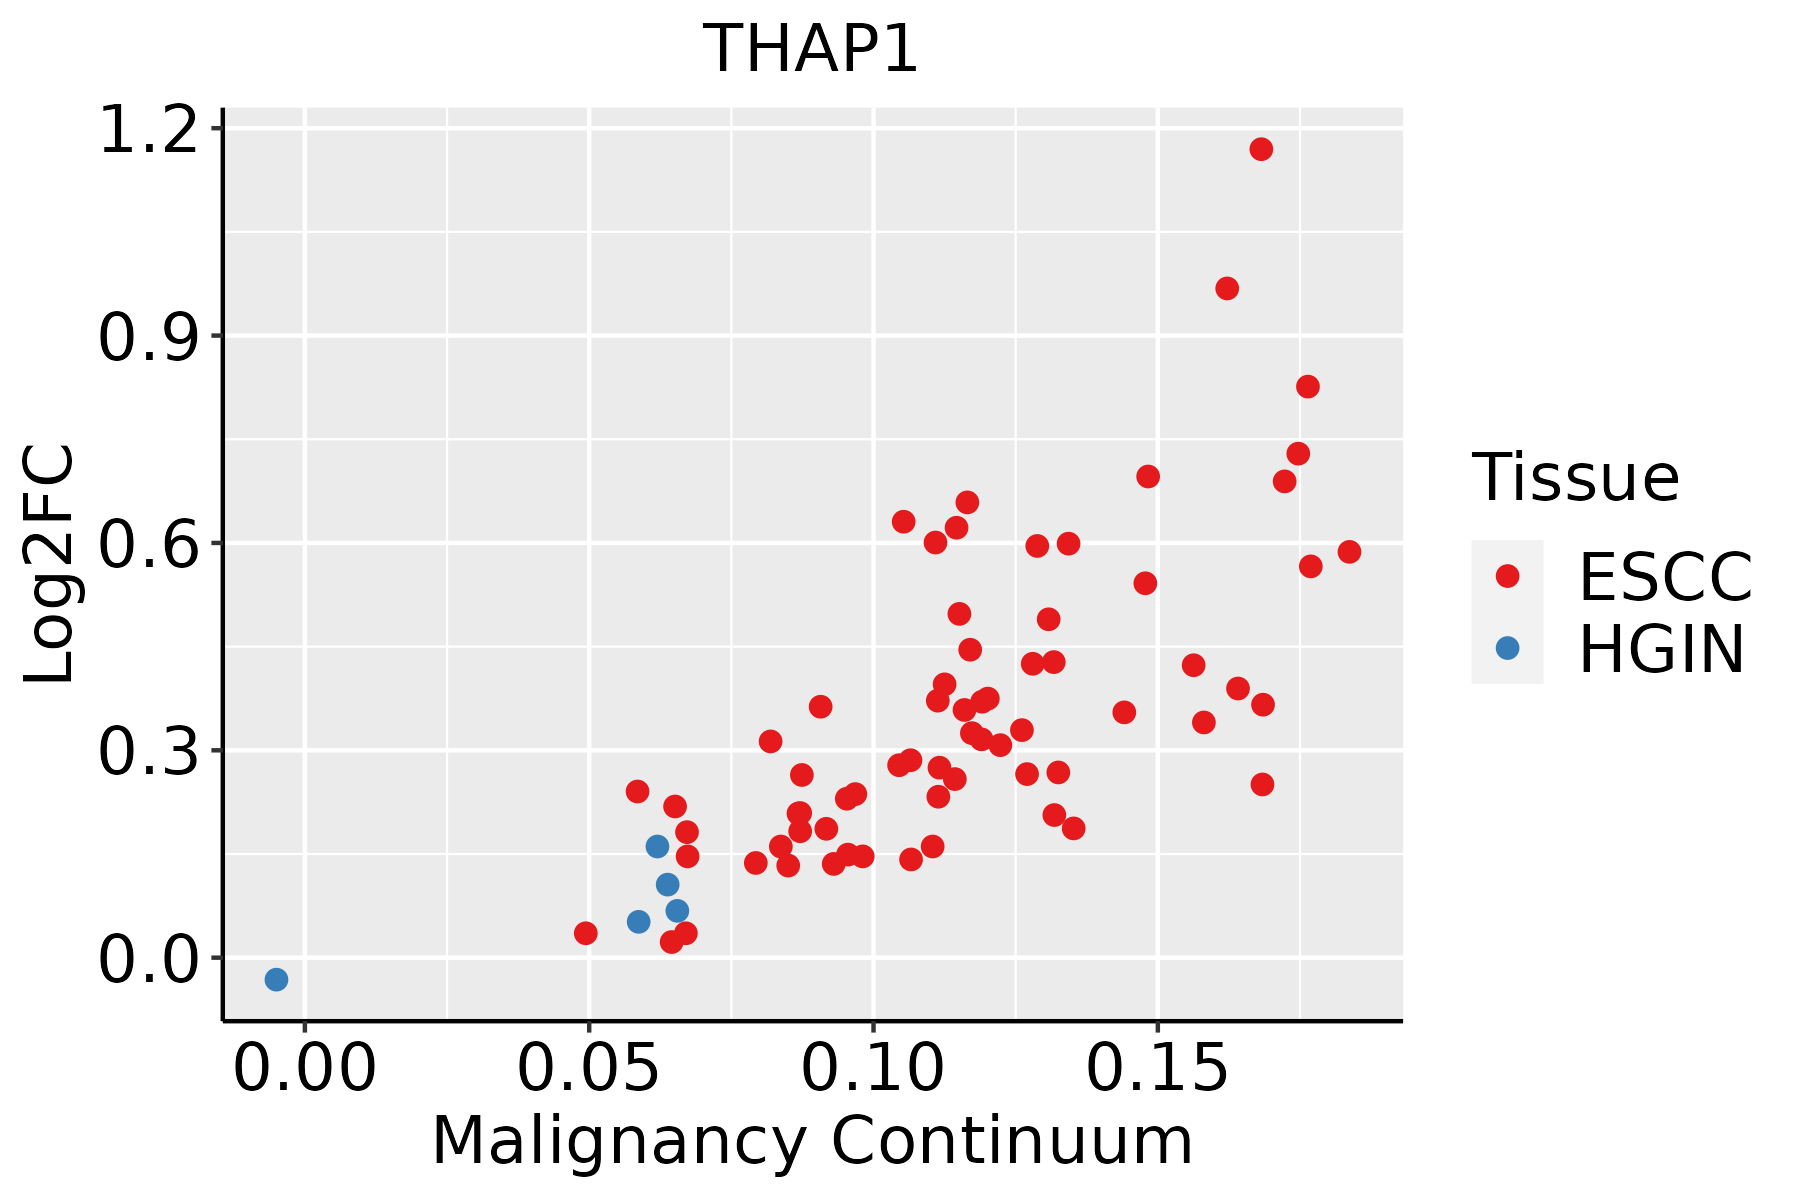 | ESCC: Esophageal squamous cell carcinoma |
| HGIN: High-grade intraepithelial neoplasias | ||
| LGIN: Low-grade intraepithelial neoplasias | ||
| Oral Cavity | 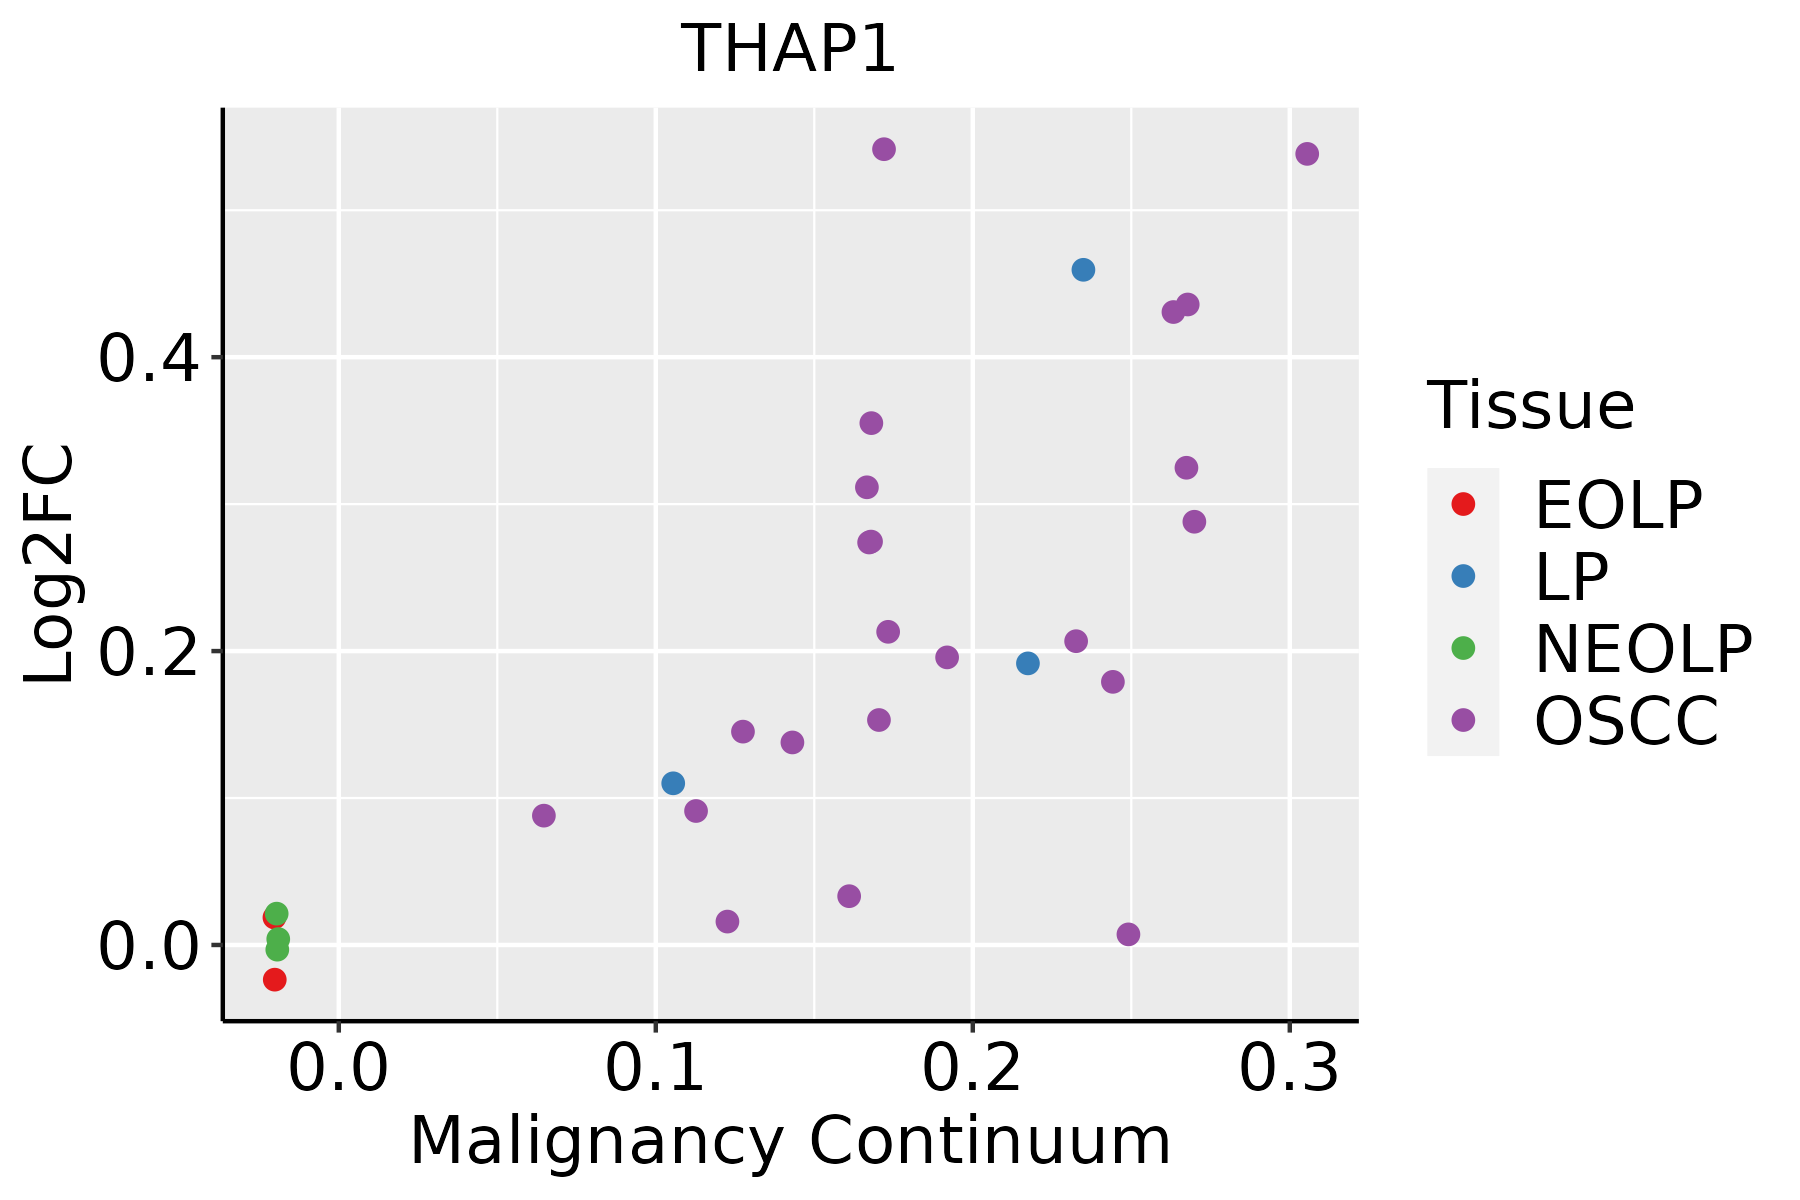 | EOLP: Erosive Oral lichen planus |
| LP: leukoplakia | ||
| NEOLP: Non-erosive oral lichen planus | ||
| OSCC: Oral squamous cell carcinoma | ||
| Skin | 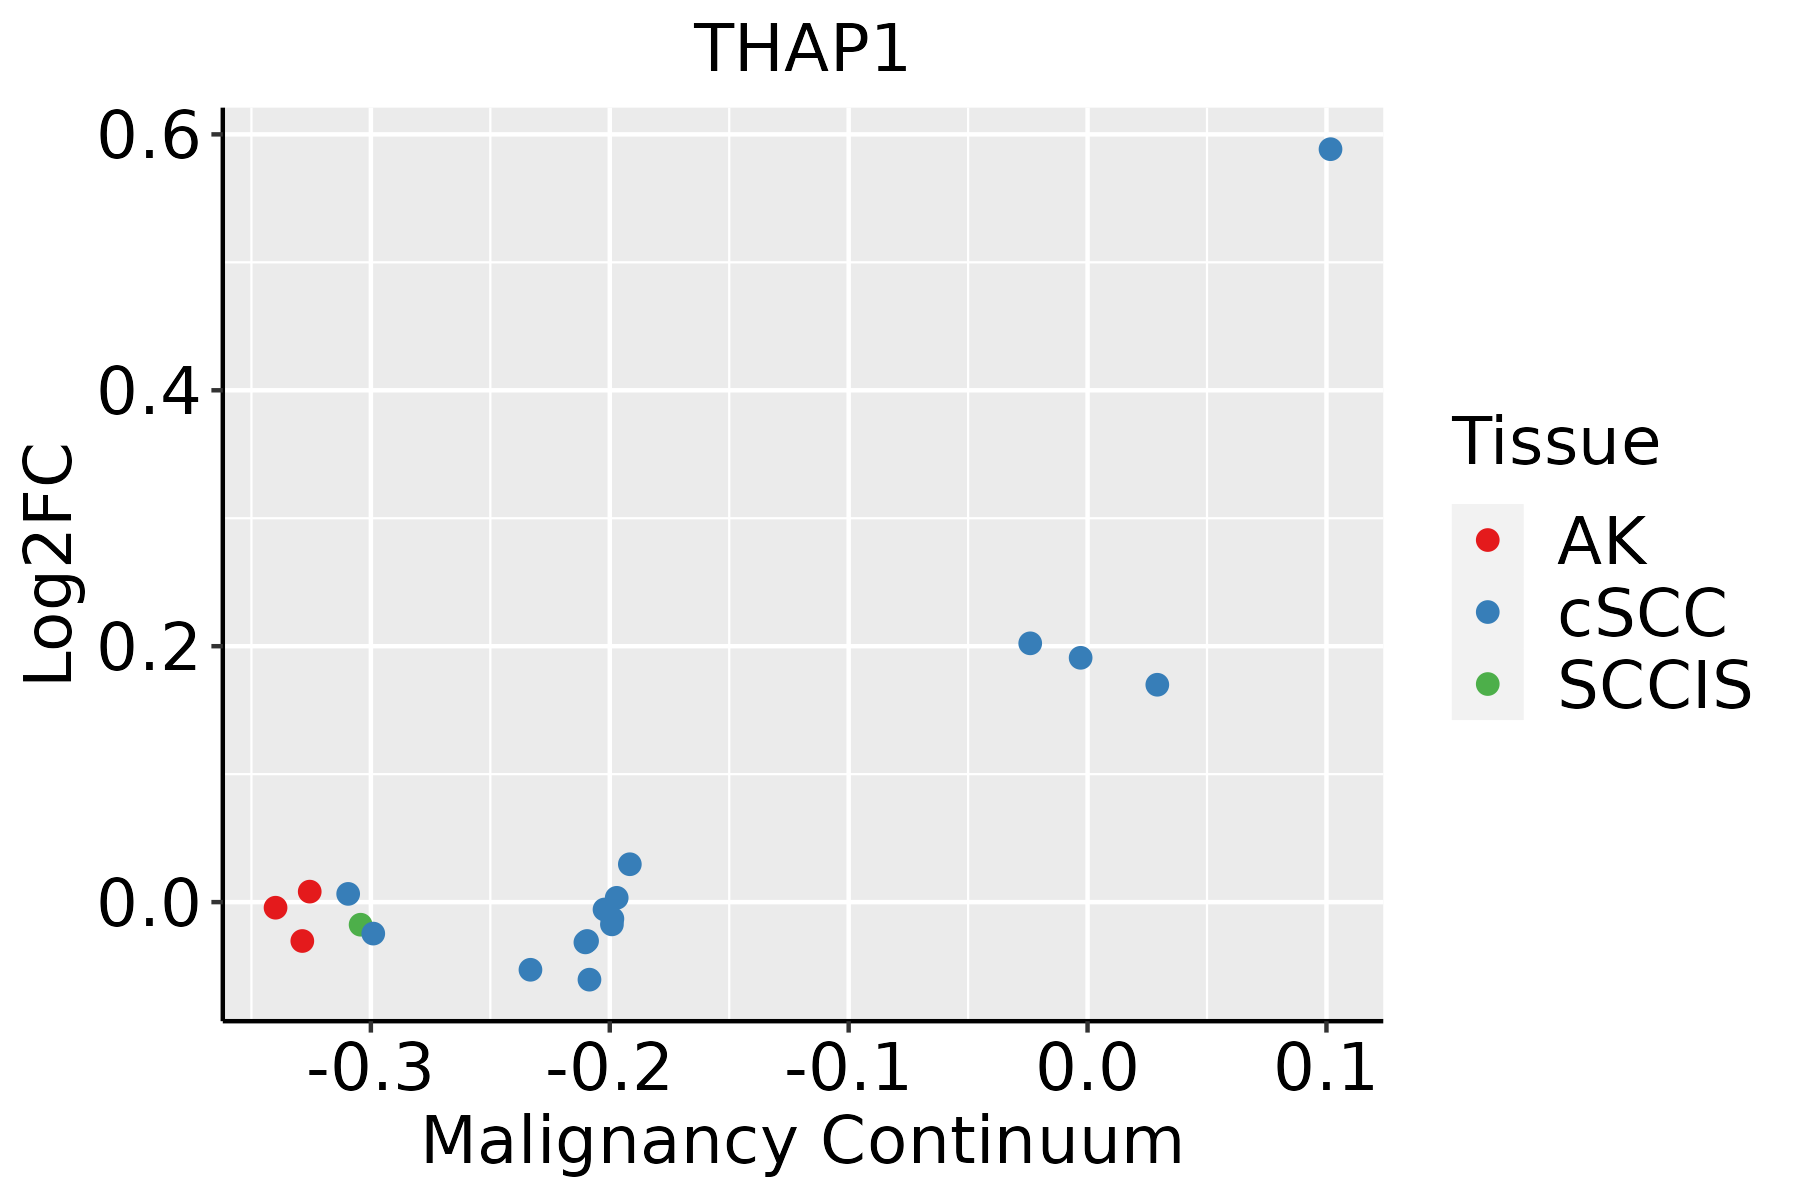 | AK: Actinic keratosis |
| cSCC: Cutaneous squamous cell carcinoma | ||
| SCCIS:squamous cell carcinoma in situ |
| ∗log2FC in expression of this searched gene in stem-like cells from each diseased tissue sample relative to stem-like cells in normal samples in each tissue plotted against the malignancy continuum. Samples are colored based on if they are from different disease stage. |
Top |
Malignant transformation related pathway analysis |
| Find out the enriched GO biological processes and KEGG pathways involved in transition from healthy to precancer to cancer |
| Tissue | Disease Stage | Enriched GO biological Processes |
| Colorectum | AD |  |
| Colorectum | SER |  |
| Colorectum | MSS |  |
| Colorectum | MSI-H |  |
| Colorectum | FAP |  |
| ∗Top 15 enriched GO BP terms are showed in the bar plot of each disease state in each tissue. Each row represents a significant GO biological process which is colored according to the -log10(p.adjust). |
| Page: 1 2 3 4 5 6 7 8 9 |
| GO ID | Tissue | Disease Stage | Description | Gene Ratio | Bg Ratio | pvalue | p.adjust | Count |
| GO:000734615 | Esophagus | ESCC | regulation of mitotic cell cycle | 293/8552 | 457/18723 | 8.00e-16 | 5.64e-14 | 293 |
| GO:005067318 | Esophagus | ESCC | epithelial cell proliferation | 238/8552 | 437/18723 | 1.19e-04 | 8.20e-04 | 238 |
| GO:00073469 | Oral cavity | OSCC | regulation of mitotic cell cycle | 266/7305 | 457/18723 | 3.87e-17 | 3.41e-15 | 266 |
| GO:005067310 | Oral cavity | OSCC | epithelial cell proliferation | 212/7305 | 437/18723 | 2.82e-05 | 2.61e-04 | 212 |
| GO:000734614 | Oral cavity | LP | regulation of mitotic cell cycle | 163/4623 | 457/18723 | 7.64e-08 | 2.56e-06 | 163 |
| GO:000734617 | Skin | cSCC | regulation of mitotic cell cycle | 192/4864 | 457/18723 | 3.47e-14 | 2.31e-12 | 192 |
| GO:005067324 | Skin | cSCC | epithelial cell proliferation | 144/4864 | 437/18723 | 6.07e-04 | 4.38e-03 | 144 |
| Page: 1 |
| Pathway ID | Tissue | Disease Stage | Description | Gene Ratio | Bg Ratio | pvalue | p.adjust | qvalue | Count |
| Page: 1 |
Top |
Cell-cell communication analysis |
| Identification of potential cell-cell interactions between two cell types and their ligand-receptor pairs for different disease states |
| Ligand | Receptor | LRpair | Pathway | Tissue | Disease Stage |
| Page: 1 |
Top |
Single-cell gene regulatory network inference analysis |
| Find out the significant the regulons (TFs) and the target genes of each regulon across cell types for different disease states |
| TF | Cell Type | Tissue | Disease Stage | Target Gene | RSS | Regulon Activity |
| THAP1 | MAST | Esophagus | Healthy | ACSL4,TUBA4A,PIK3C2A, etc. | 1.81e-01 |  |
| THAP1 | END | Liver | NAFLD | SESN2,CREB3L4,KCNJ8, etc. | 3.72e-02 |  |
| THAP1 | CD8TEREX | Oral cavity | EOLP | GEM,RP11-596C23.2,XCL1, etc. | 1.15e-01 |  |
| THAP1 | BAS | Prostate | BPH | IL1R2,NBR1,PLLP, etc. | 2.62e-01 |  |
| THAP1 | CD8TCM | Skin | cSCC | BZRAP1-AS1,SAMD3,C19orf82, etc. | 1.91e-01 |  |
| THAP1 | INFIB | Thyroid | ATC | TRAC,AC026979.2,HS3ST3B1, etc. | 5.94e-01 |  |
| ∗The dot plots of a searched regulon are shown for all cell subpopulations in each disease state of each tissue based on the regulon specific score inferred using pySCENIC and by calculating the average expression. |
| Page: 1 |
Top |
Somatic mutation of malignant transformation related genes |
| Annotation of somatic variants for genes involved in malignant transformation |
| Hugo Symbol | Variant Class | Variant Classification | dbSNP RS | HGVSc | HGVSp | HGVSp Short | SWISSPROT | BIOTYPE | SIFT | PolyPhen | Tumor Sample Barcode | Tissue | Histology | Sex | Age | Stage | Therapy Types | Drugs | Outcome |
| THAP1 | SNV | Missense_Mutation | c.545N>G | p.Glu182Gly | p.E182G | Q9NVV9 | protein_coding | deleterious(0.05) | benign(0.026) | TCGA-D8-A1XK-01 | Breast | breast invasive carcinoma | Female | <65 | I/II | Chemotherapy | doxorubicine+cyclophosphamide | SD | |
| THAP1 | insertion | In_Frame_Ins | novel | c.309_310insACAAGGTTCCAGGCA | p.Pro103_Pro104insThrArgPheGlnAla | p.P103_P104insTRFQA | Q9NVV9 | protein_coding | TCGA-A2-A04V-01 | Breast | breast invasive carcinoma | Female | <65 | I/II | Chemotherapy | cytoxan | PD | ||
| THAP1 | insertion | In_Frame_Ins | novel | c.307_308insTGTTAA | p.Pro103delinsLeuLeuThr | p.P103delinsLLT | Q9NVV9 | protein_coding | TCGA-A2-A04V-01 | Breast | breast invasive carcinoma | Female | <65 | I/II | Chemotherapy | cytoxan | PD | ||
| THAP1 | SNV | Missense_Mutation | c.637N>T | p.Ala213Ser | p.A213S | Q9NVV9 | protein_coding | deleterious_low_confidence(0) | probably_damaging(0.968) | TCGA-AA-3663-01 | Colorectum | colon adenocarcinoma | Male | <65 | I/II | Unknown | Unknown | SD | |
| THAP1 | SNV | Missense_Mutation | c.227N>A | p.Ala76Asp | p.A76D | Q9NVV9 | protein_coding | deleterious(0) | probably_damaging(0.998) | TCGA-AP-A051-01 | Endometrium | uterine corpus endometrioid carcinoma | Female | >=65 | I/II | Unknown | Unknown | SD | |
| THAP1 | SNV | Missense_Mutation | c.434N>G | p.Gln145Arg | p.Q145R | Q9NVV9 | protein_coding | deleterious(0.01) | probably_damaging(0.968) | TCGA-AP-A056-01 | Endometrium | uterine corpus endometrioid carcinoma | Female | <65 | I/II | Unknown | Unknown | SD | |
| THAP1 | SNV | Missense_Mutation | c.462N>T | p.Gln154His | p.Q154H | Q9NVV9 | protein_coding | deleterious(0) | benign(0.025) | TCGA-AP-A059-01 | Endometrium | uterine corpus endometrioid carcinoma | Female | >=65 | I/II | Unknown | Unknown | SD | |
| THAP1 | SNV | Missense_Mutation | novel | c.396N>A | p.Phe132Leu | p.F132L | Q9NVV9 | protein_coding | tolerated(0.18) | benign(0.003) | TCGA-B5-A3FA-01 | Endometrium | uterine corpus endometrioid carcinoma | Female | >=65 | I/II | Unknown | Unknown | SD |
| THAP1 | SNV | Missense_Mutation | rs773282992 | c.523C>T | p.Arg175Trp | p.R175W | Q9NVV9 | protein_coding | deleterious(0) | possibly_damaging(0.826) | TCGA-BS-A0UF-01 | Endometrium | uterine corpus endometrioid carcinoma | Female | >=65 | I/II | Unknown | Unknown | SD |
| THAP1 | SNV | Missense_Mutation | novel | c.382N>C | p.Asn128His | p.N128H | Q9NVV9 | protein_coding | tolerated(0.13) | benign(0) | TCGA-EO-A22X-01 | Endometrium | uterine corpus endometrioid carcinoma | Female | <65 | III/IV | Unspecific | Carboplatin | Complete Response |
| Page: 1 2 3 |
Top |
Related drugs of malignant transformation related genes |
| Identification of chemicals and drugs interact with genes involved in malignant transfromation |
| (DGIdb 4.0) |
| Entrez ID | Symbol | Category | Interaction Types | Drug Claim Name | Drug Name | PMIDs |
| Page: 1 |

Copyright 2023-Present -The University of Texas Health Science Center at Houston |