
|
|||||
|
 | |
| |
| |
| |
| |
| |
|
Gene: THADA |
Gene summary for THADA |
| Gene information | Species | Human | Gene symbol | THADA | Gene ID | 63892 |
| Gene name | THADA armadillo repeat containing | |
| Gene Alias | ARMC13 | |
| Cytomap | 2p21 | |
| Gene Type | protein-coding | GO ID | GO:0001510 | UniProtAcc | Q6YHU6 |
Top |
Malignant transformation analysis |
| Identification of the aberrant gene expression in precancerous and cancerous lesions by comparing the gene expression of stem-like cells in diseased tissues with normal stem cells |
| Entrez ID | Symbol | Replicates | Species | Organ | Tissue | Adj P-value | Log2FC | Malignancy |
| 63892 | THADA | CCI_1 | Human | Cervix | CC | 1.22e-08 | 7.48e-01 | 0.528 |
| 63892 | THADA | CCI_2 | Human | Cervix | CC | 2.37e-10 | 9.42e-01 | 0.5249 |
| 63892 | THADA | CCI_3 | Human | Cervix | CC | 2.80e-13 | 8.66e-01 | 0.516 |
| 63892 | THADA | AEH-subject1 | Human | Endometrium | AEH | 2.67e-09 | 3.69e-01 | -0.3059 |
| 63892 | THADA | AEH-subject3 | Human | Endometrium | AEH | 9.95e-08 | 3.18e-01 | -0.2576 |
| 63892 | THADA | AEH-subject4 | Human | Endometrium | AEH | 6.85e-05 | 3.37e-01 | -0.2657 |
| 63892 | THADA | AEH-subject5 | Human | Endometrium | AEH | 1.48e-07 | 3.49e-01 | -0.2953 |
| 63892 | THADA | EEC-subject1 | Human | Endometrium | EEC | 3.65e-04 | 2.91e-01 | -0.2682 |
| 63892 | THADA | EEC-subject2 | Human | Endometrium | EEC | 6.62e-08 | 3.46e-01 | -0.2607 |
| 63892 | THADA | EEC-subject4 | Human | Endometrium | EEC | 7.62e-04 | 2.33e-01 | -0.2571 |
| 63892 | THADA | GSM6177620_NYU_UCEC1_lib3_lib3 | Human | Endometrium | EEC | 8.53e-03 | 2.51e-02 | -0.1883 |
| 63892 | THADA | GSM6177622_NYU_UCEC3_lib1_lib1 | Human | Endometrium | EEC | 5.45e-06 | -5.12e-02 | -0.1917 |
| 63892 | THADA | GSM6177622_NYU_UCEC3_lib2_lib2 | Human | Endometrium | EEC | 1.75e-02 | -4.09e-02 | -0.1916 |
| 63892 | THADA | NAFLD1 | Human | Liver | NAFLD | 5.27e-10 | 7.79e-01 | -0.04 |
| 63892 | THADA | HCC1_Meng | Human | Liver | HCC | 3.34e-38 | -1.99e-02 | 0.0246 |
| 63892 | THADA | HCC2_Meng | Human | Liver | HCC | 4.45e-08 | -1.58e-02 | 0.0107 |
| 63892 | THADA | HCC2 | Human | Liver | HCC | 3.11e-02 | 2.35e+00 | 0.5341 |
| 63892 | THADA | S014 | Human | Liver | HCC | 4.65e-03 | 2.37e-01 | 0.2254 |
| 63892 | THADA | S015 | Human | Liver | HCC | 1.35e-04 | 3.89e-01 | 0.2375 |
| 63892 | THADA | S016 | Human | Liver | HCC | 3.98e-04 | 3.22e-01 | 0.2243 |
| Page: 1 2 3 |
| Tissue | Expression Dynamics | Abbreviation |
| Cervix |  | CC: Cervix cancer |
| HSIL_HPV: HPV-infected high-grade squamous intraepithelial lesions | ||
| N_HPV: HPV-infected normal cervix | ||
| Endometrium | 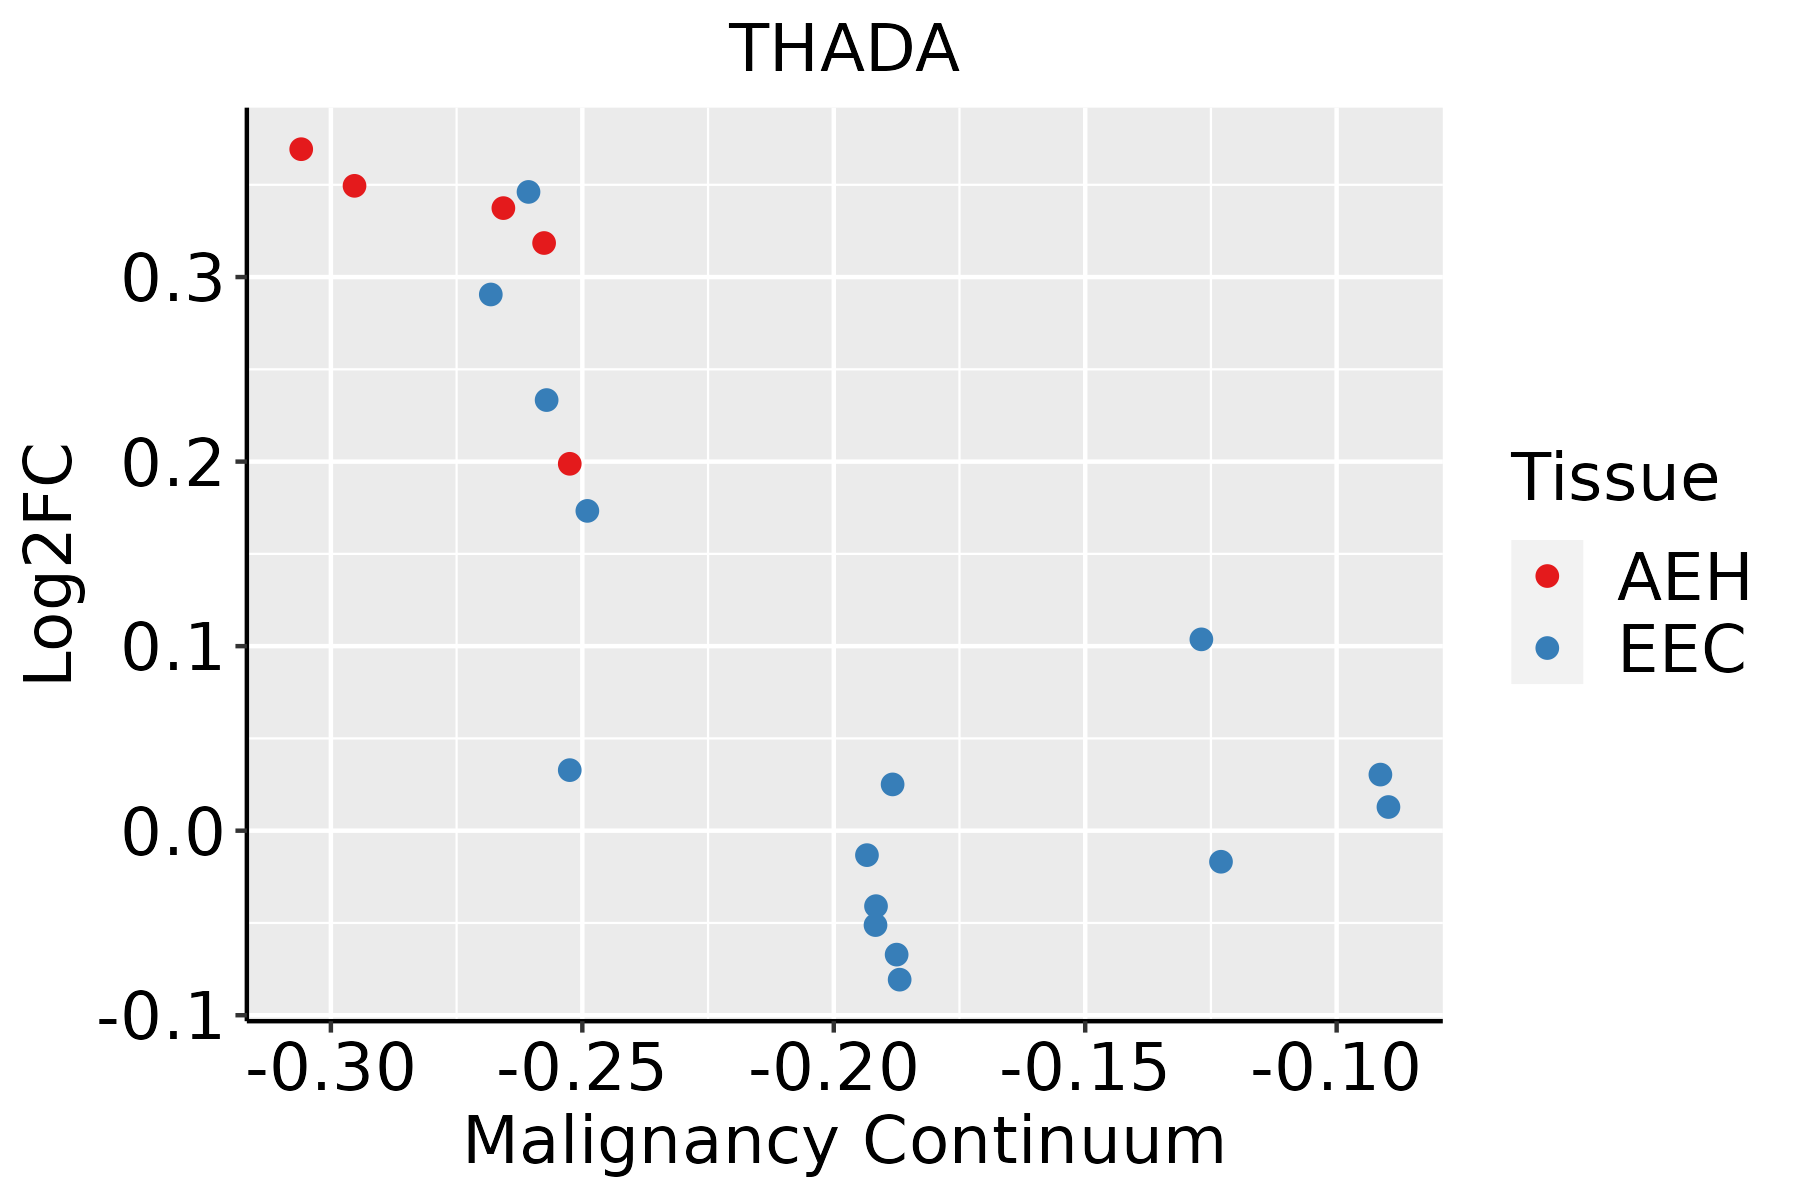 | AEH: Atypical endometrial hyperplasia |
| EEC: Endometrioid Cancer | ||
| Liver | 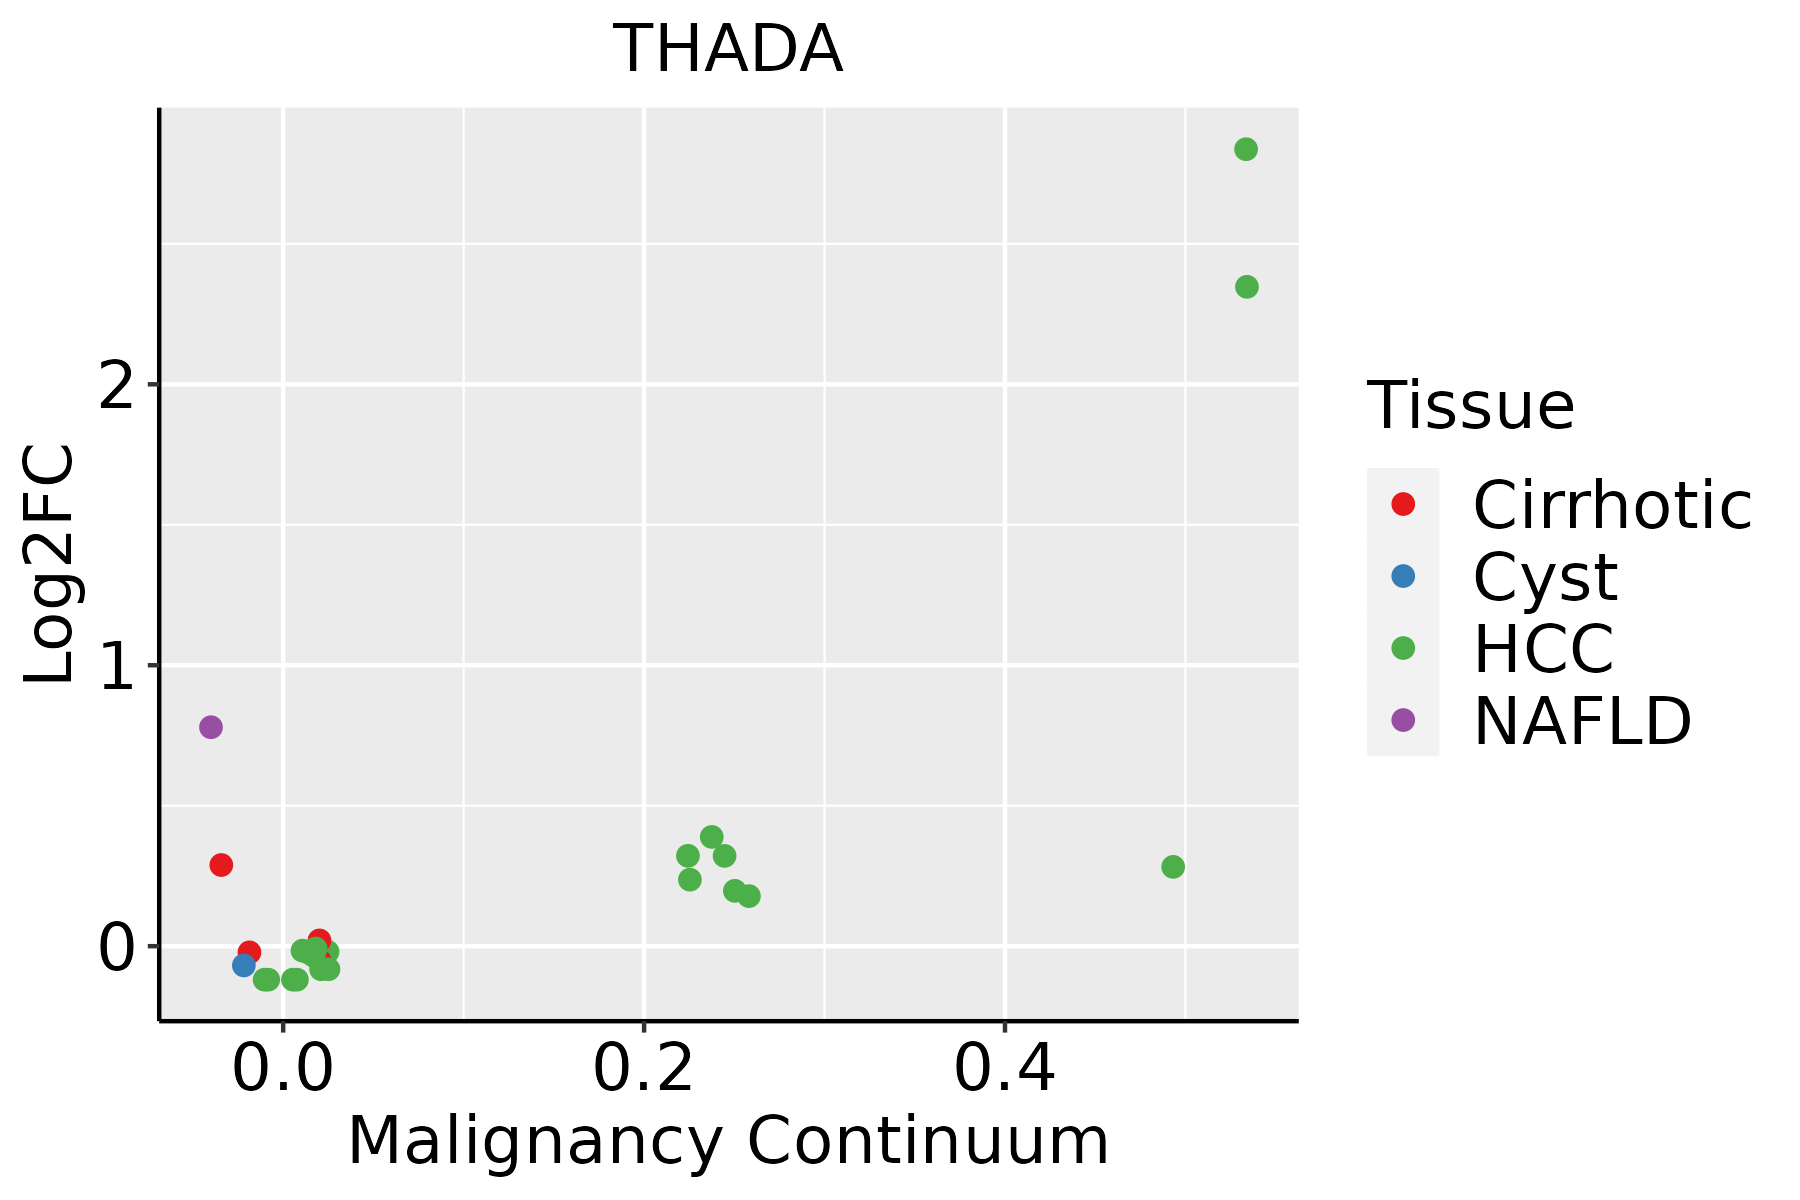 | HCC: Hepatocellular carcinoma |
| NAFLD: Non-alcoholic fatty liver disease | ||
| Lung | 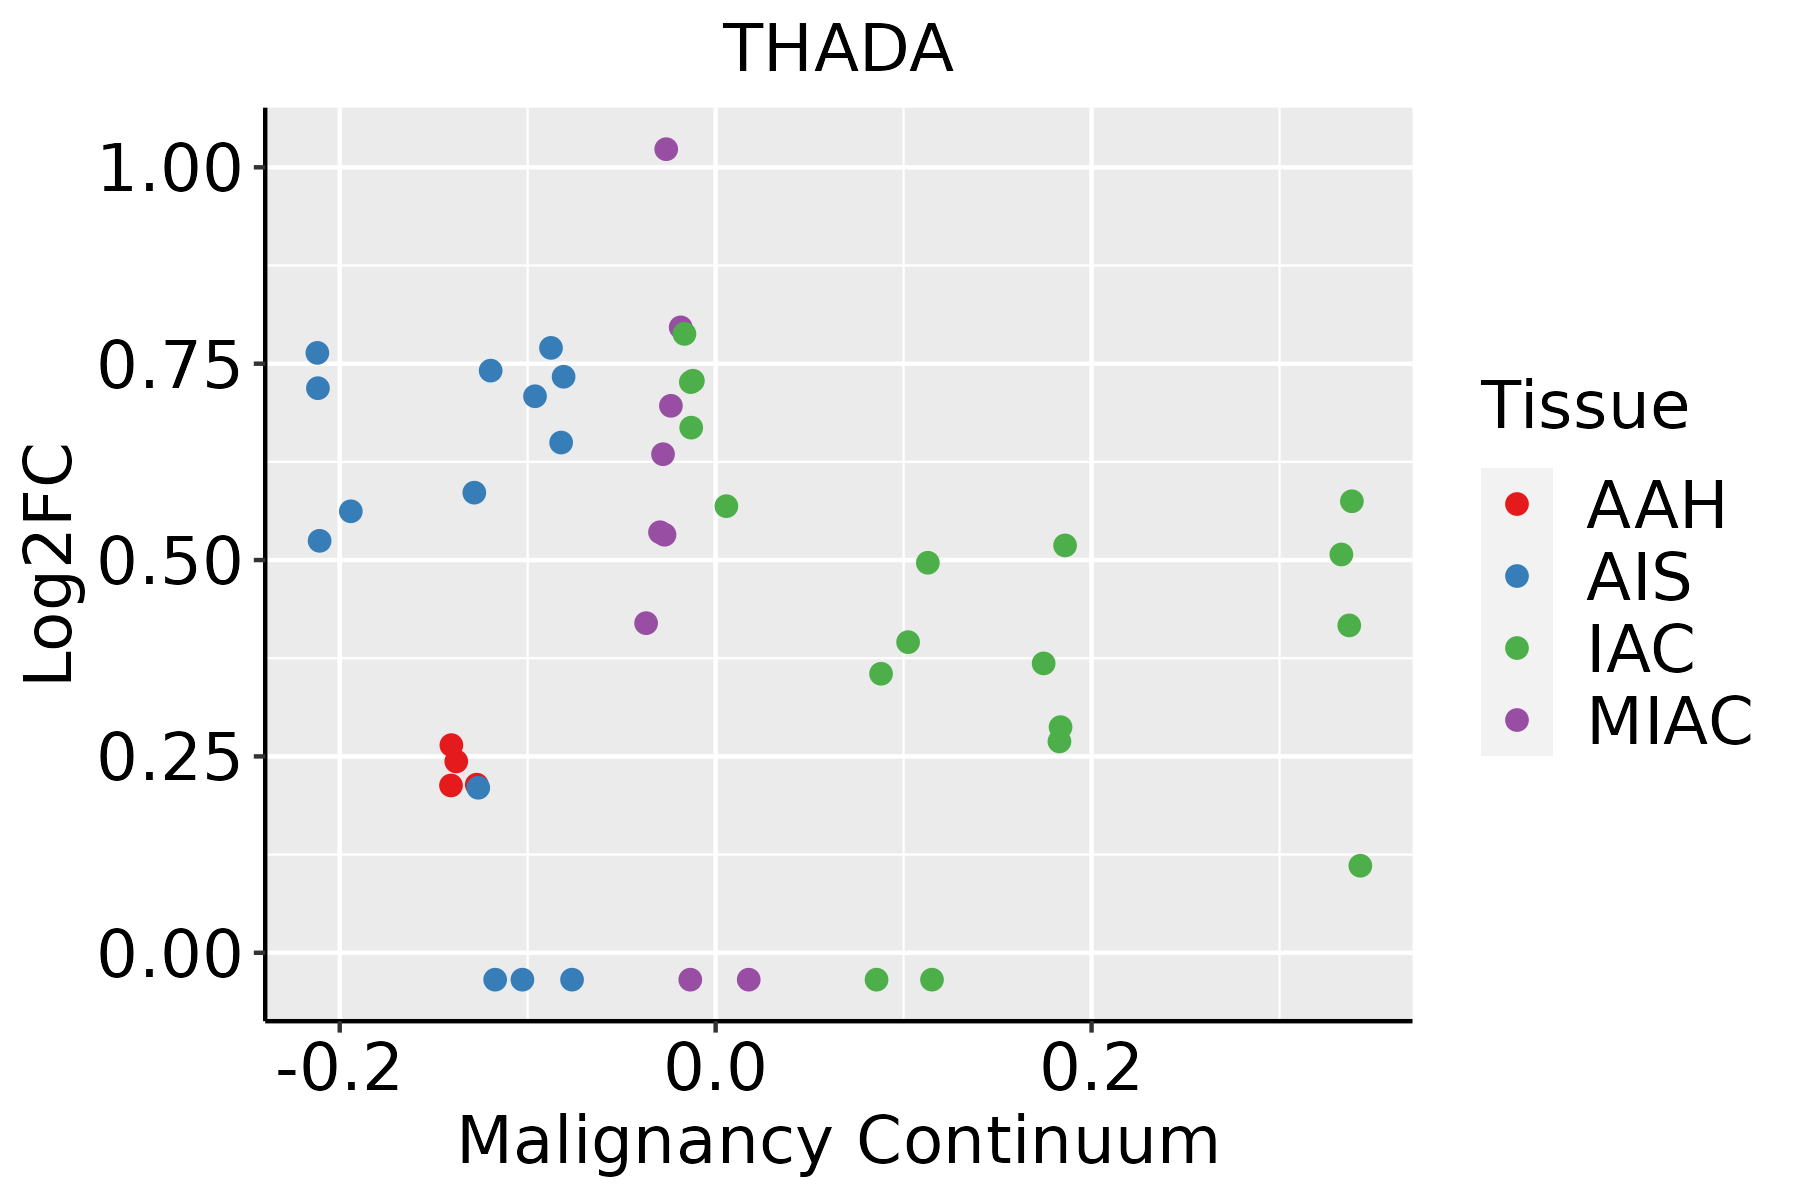 | AAH: Atypical adenomatous hyperplasia |
| AIS: Adenocarcinoma in situ | ||
| IAC: Invasive lung adenocarcinoma | ||
| MIA: Minimally invasive adenocarcinoma |
| ∗log2FC in expression of this searched gene in stem-like cells from each diseased tissue sample relative to stem-like cells in normal samples in each tissue plotted against the malignancy continuum. Samples are colored based on if they are from different disease stage. |
Top |
Malignant transformation related pathway analysis |
| Find out the enriched GO biological processes and KEGG pathways involved in transition from healthy to precancer to cancer |
| Tissue | Disease Stage | Enriched GO biological Processes |
| Colorectum | AD |  |
| Colorectum | SER |  |
| Colorectum | MSS |  |
| Colorectum | MSI-H |  |
| Colorectum | FAP |  |
| ∗Top 15 enriched GO BP terms are showed in the bar plot of each disease state in each tissue. Each row represents a significant GO biological process which is colored according to the -log10(p.adjust). |
| Page: 1 2 3 4 5 6 7 8 9 |
| GO ID | Tissue | Disease Stage | Description | Gene Ratio | Bg Ratio | pvalue | p.adjust | Count |
| GO:00324698 | Cervix | CC | endoplasmic reticulum calcium ion homeostasis | 10/2311 | 25/18723 | 4.52e-04 | 4.49e-03 | 10 |
| GO:00324699 | Endometrium | AEH | endoplasmic reticulum calcium ion homeostasis | 11/2100 | 25/18723 | 3.42e-05 | 6.06e-04 | 11 |
| GO:00510515 | Endometrium | AEH | negative regulation of transport | 79/2100 | 470/18723 | 1.51e-04 | 1.99e-03 | 79 |
| GO:00109597 | Endometrium | AEH | regulation of metal ion transport | 66/2100 | 406/18723 | 1.24e-03 | 1.07e-02 | 66 |
| GO:00344707 | Endometrium | AEH | ncRNA processing | 62/2100 | 395/18723 | 3.93e-03 | 2.65e-02 | 62 |
| GO:0034766 | Endometrium | AEH | negative regulation of ion transmembrane transport | 22/2100 | 109/18723 | 4.39e-03 | 2.89e-02 | 22 |
| GO:0043271 | Endometrium | AEH | negative regulation of ion transport | 29/2100 | 160/18723 | 6.16e-03 | 3.70e-02 | 29 |
| GO:00228986 | Endometrium | AEH | regulation of transmembrane transporter activity | 45/2100 | 278/18723 | 7.34e-03 | 4.18e-02 | 45 |
| GO:0034763 | Endometrium | AEH | negative regulation of transmembrane transport | 26/2100 | 143/18723 | 8.78e-03 | 4.78e-02 | 26 |
| GO:1904063 | Endometrium | AEH | negative regulation of cation transmembrane transport | 20/2100 | 102/18723 | 8.88e-03 | 4.82e-02 | 20 |
| GO:19040623 | Endometrium | AEH | regulation of cation transmembrane transport | 55/2100 | 357/18723 | 9.18e-03 | 4.96e-02 | 55 |
| GO:003246915 | Endometrium | EEC | endoplasmic reticulum calcium ion homeostasis | 12/2168 | 25/18723 | 6.86e-06 | 1.61e-04 | 12 |
| GO:005105111 | Endometrium | EEC | negative regulation of transport | 80/2168 | 470/18723 | 2.53e-04 | 2.93e-03 | 80 |
| GO:001095914 | Endometrium | EEC | regulation of metal ion transport | 70/2168 | 406/18723 | 4.12e-04 | 4.35e-03 | 70 |
| GO:003447012 | Endometrium | EEC | ncRNA processing | 63/2168 | 395/18723 | 5.20e-03 | 3.26e-02 | 63 |
| GO:00347661 | Endometrium | EEC | negative regulation of ion transmembrane transport | 22/2168 | 109/18723 | 6.39e-03 | 3.76e-02 | 22 |
| GO:00550883 | Liver | NAFLD | lipid homeostasis | 44/1882 | 167/18723 | 1.48e-09 | 2.54e-07 | 44 |
| GO:19908452 | Liver | NAFLD | adaptive thermogenesis | 28/1882 | 157/18723 | 1.91e-03 | 1.93e-02 | 28 |
| GO:00344704 | Liver | NAFLD | ncRNA processing | 57/1882 | 395/18723 | 3.34e-03 | 2.93e-02 | 57 |
| GO:0043414 | Liver | NAFLD | macromolecule methylation | 47/1882 | 316/18723 | 4.08e-03 | 3.41e-02 | 47 |
| Page: 1 2 3 |
| Pathway ID | Tissue | Disease Stage | Description | Gene Ratio | Bg Ratio | pvalue | p.adjust | qvalue | Count |
| Page: 1 |
Top |
Cell-cell communication analysis |
| Identification of potential cell-cell interactions between two cell types and their ligand-receptor pairs for different disease states |
| Ligand | Receptor | LRpair | Pathway | Tissue | Disease Stage |
| Page: 1 |
Top |
Single-cell gene regulatory network inference analysis |
| Find out the significant the regulons (TFs) and the target genes of each regulon across cell types for different disease states |
| TF | Cell Type | Tissue | Disease Stage | Target Gene | RSS | Regulon Activity |
| ∗The dot plots of a searched regulon are shown for all cell subpopulations in each disease state of each tissue based on the regulon specific score inferred using pySCENIC and by calculating the average expression. |
| Page: 1 |
Top |
Somatic mutation of malignant transformation related genes |
| Annotation of somatic variants for genes involved in malignant transformation |
| Hugo Symbol | Variant Class | Variant Classification | dbSNP RS | HGVSc | HGVSp | HGVSp Short | SWISSPROT | BIOTYPE | SIFT | PolyPhen | Tumor Sample Barcode | Tissue | Histology | Sex | Age | Stage | Therapy Types | Drugs | Outcome |
| THADA | SNV | Missense_Mutation | c.773N>G | p.Phe258Cys | p.F258C | Q6YHU6 | protein_coding | deleterious(0) | possibly_damaging(0.781) | TCGA-A2-A0YG-01 | Breast | breast invasive carcinoma | Female | <65 | III/IV | Chemotherapy | cytoxan | SD | |
| THADA | SNV | Missense_Mutation | c.5148N>A | p.Asn1716Lys | p.N1716K | Q6YHU6 | protein_coding | deleterious(0.01) | benign(0.141) | TCGA-A8-A06X-01 | Breast | breast invasive carcinoma | Female | >=65 | I/II | Unknown | Unknown | SD | |
| THADA | SNV | Missense_Mutation | c.3841N>T | p.Thr1281Ser | p.T1281S | Q6YHU6 | protein_coding | deleterious(0.03) | benign(0.091) | TCGA-A8-A09G-01 | Breast | breast invasive carcinoma | Female | >=65 | III/IV | Unknown | Unknown | SD | |
| THADA | SNV | Missense_Mutation | c.2344N>A | p.Asp782Asn | p.D782N | Q6YHU6 | protein_coding | tolerated(0.36) | benign(0.343) | TCGA-AC-A23H-01 | Breast | breast invasive carcinoma | Female | >=65 | I/II | Unknown | Unknown | PD | |
| THADA | SNV | Missense_Mutation | c.85N>A | p.Asp29Asn | p.D29N | Q6YHU6 | protein_coding | tolerated(0.18) | possibly_damaging(0.82) | TCGA-AC-A23H-01 | Breast | breast invasive carcinoma | Female | >=65 | I/II | Unknown | Unknown | PD | |
| THADA | SNV | Missense_Mutation | rs754152083 | c.3958N>T | p.Met1320Leu | p.M1320L | Q6YHU6 | protein_coding | tolerated(1) | benign(0) | TCGA-AC-A3TN-01 | Breast | breast invasive carcinoma | Female | >=65 | I/II | Hormone Therapy | arimidex | SD |
| THADA | SNV | Missense_Mutation | novel | c.718N>A | p.Asp240Asn | p.D240N | Q6YHU6 | protein_coding | tolerated(0.07) | benign(0.005) | TCGA-AN-A046-01 | Breast | breast invasive carcinoma | Female | >=65 | I/II | Unknown | Unknown | SD |
| THADA | SNV | Missense_Mutation | c.2102N>T | p.Tyr701Phe | p.Y701F | Q6YHU6 | protein_coding | tolerated(0.21) | possibly_damaging(0.793) | TCGA-AO-A12A-01 | Breast | breast invasive carcinoma | Female | <65 | I/II | Chemotherapy | cyclophosphamide | SD | |
| THADA | SNV | Missense_Mutation | novel | c.2731C>G | p.Leu911Val | p.L911V | Q6YHU6 | protein_coding | deleterious(0) | probably_damaging(0.991) | TCGA-AR-A2LE-01 | Breast | breast invasive carcinoma | Female | >=65 | I/II | Hormone Therapy | tamoxiphen | PD |
| THADA | SNV | Missense_Mutation | c.2213N>A | p.Ser738Asn | p.S738N | Q6YHU6 | protein_coding | tolerated(0.35) | benign(0.058) | TCGA-B6-A0I6-01 | Breast | breast invasive carcinoma | Female | <65 | I/II | Unknown | Unknown | PD |
| Page: 1 2 3 4 5 6 7 8 9 10 11 12 13 14 15 16 17 |
Top |
Related drugs of malignant transformation related genes |
| Identification of chemicals and drugs interact with genes involved in malignant transfromation |
| (DGIdb 4.0) |
| Entrez ID | Symbol | Category | Interaction Types | Drug Claim Name | Drug Name | PMIDs |
| Page: 1 |

Copyright 2023-Present -The University of Texas Health Science Center at Houston |