
|
|||||
|
 | |
| |
| |
| |
| |
| |
|
Gene: TGM2 |
Gene summary for TGM2 |
| Gene information | Species | Human | Gene symbol | TGM2 | Gene ID | 7052 |
| Gene name | transglutaminase 2 | |
| Gene Alias | G(h) | |
| Cytomap | 20q11.23 | |
| Gene Type | protein-coding | GO ID | GO:0001501 | UniProtAcc | P21980 |
Top |
Malignant transformation analysis |
| Identification of the aberrant gene expression in precancerous and cancerous lesions by comparing the gene expression of stem-like cells in diseased tissues with normal stem cells |
| Entrez ID | Symbol | Replicates | Species | Organ | Tissue | Adj P-value | Log2FC | Malignancy |
| 7052 | TGM2 | GSM4909281 | Human | Breast | IDC | 3.32e-03 | -1.03e-01 | 0.21 |
| 7052 | TGM2 | GSM4909285 | Human | Breast | IDC | 3.32e-03 | -1.01e-01 | 0.21 |
| 7052 | TGM2 | GSM4909286 | Human | Breast | IDC | 3.32e-03 | -1.03e-01 | 0.1081 |
| 7052 | TGM2 | GSM4909298 | Human | Breast | IDC | 7.01e-03 | -1.03e-01 | 0.1551 |
| 7052 | TGM2 | GSM4909299 | Human | Breast | IDC | 1.57e-03 | -1.01e-01 | 0.035 |
| 7052 | TGM2 | GSM4909304 | Human | Breast | IDC | 1.56e-10 | 3.73e-01 | 0.1636 |
| 7052 | TGM2 | GSM4909306 | Human | Breast | IDC | 7.01e-03 | -9.41e-02 | 0.1564 |
| 7052 | TGM2 | GSM4909309 | Human | Breast | IDC | 1.42e-02 | -1.03e-01 | 0.0483 |
| 7052 | TGM2 | GSM4909311 | Human | Breast | IDC | 3.32e-03 | -1.03e-01 | 0.1534 |
| 7052 | TGM2 | GSM4909315 | Human | Breast | IDC | 3.32e-03 | -1.03e-01 | 0.21 |
| 7052 | TGM2 | GSM4909319 | Human | Breast | IDC | 7.43e-04 | -1.03e-01 | 0.1563 |
| 7052 | TGM2 | GSM4909321 | Human | Breast | IDC | 1.57e-03 | -1.03e-01 | 0.1559 |
| 7052 | TGM2 | ctrl6 | Human | Breast | Precancer | 4.40e-04 | 4.51e-01 | -0.0061 |
| 7052 | TGM2 | brca10 | Human | Breast | Precancer | 9.36e-14 | 5.65e-01 | -0.0029 |
| 7052 | TGM2 | P1 | Human | Breast | IDC | 4.98e-02 | -1.03e-01 | 0.1527 |
| 7052 | TGM2 | AEH-subject1 | Human | Endometrium | AEH | 2.16e-03 | -2.35e-01 | -0.3059 |
| 7052 | TGM2 | AEH-subject2 | Human | Endometrium | AEH | 5.43e-06 | -2.72e-01 | -0.2525 |
| 7052 | TGM2 | AEH-subject3 | Human | Endometrium | AEH | 1.14e-22 | -5.09e-01 | -0.2576 |
| 7052 | TGM2 | AEH-subject4 | Human | Endometrium | AEH | 2.24e-02 | -2.74e-01 | -0.2657 |
| 7052 | TGM2 | AEH-subject5 | Human | Endometrium | AEH | 1.05e-23 | -5.18e-01 | -0.2953 |
| Page: 1 2 3 4 5 |
| Tissue | Expression Dynamics | Abbreviation |
| Breast | 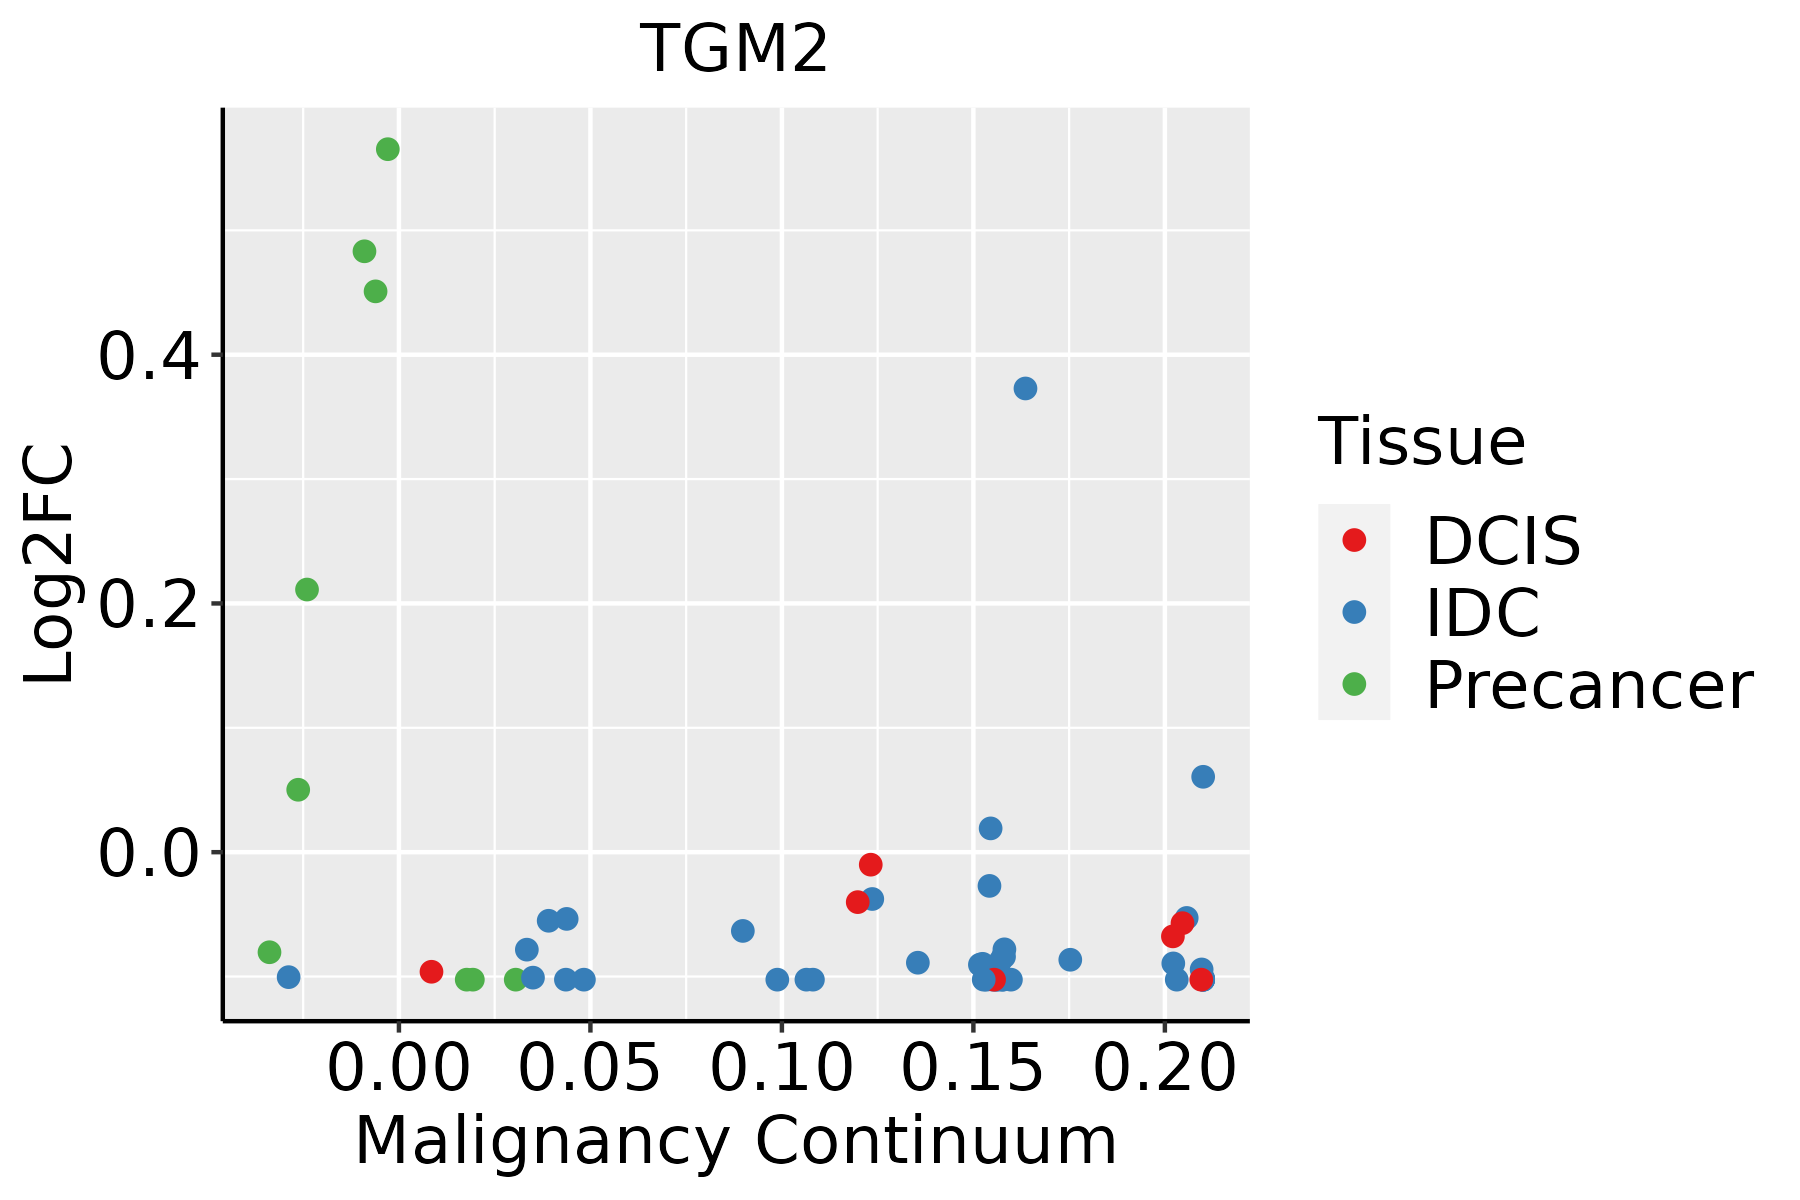 | IDC: Invasive ductal carcinoma |
| DCIS: Ductal carcinoma in situ | ||
| Precancer(BRCA1-mut): Precancerous lesion from BRCA1 mutation carriers | ||
| Endometrium | 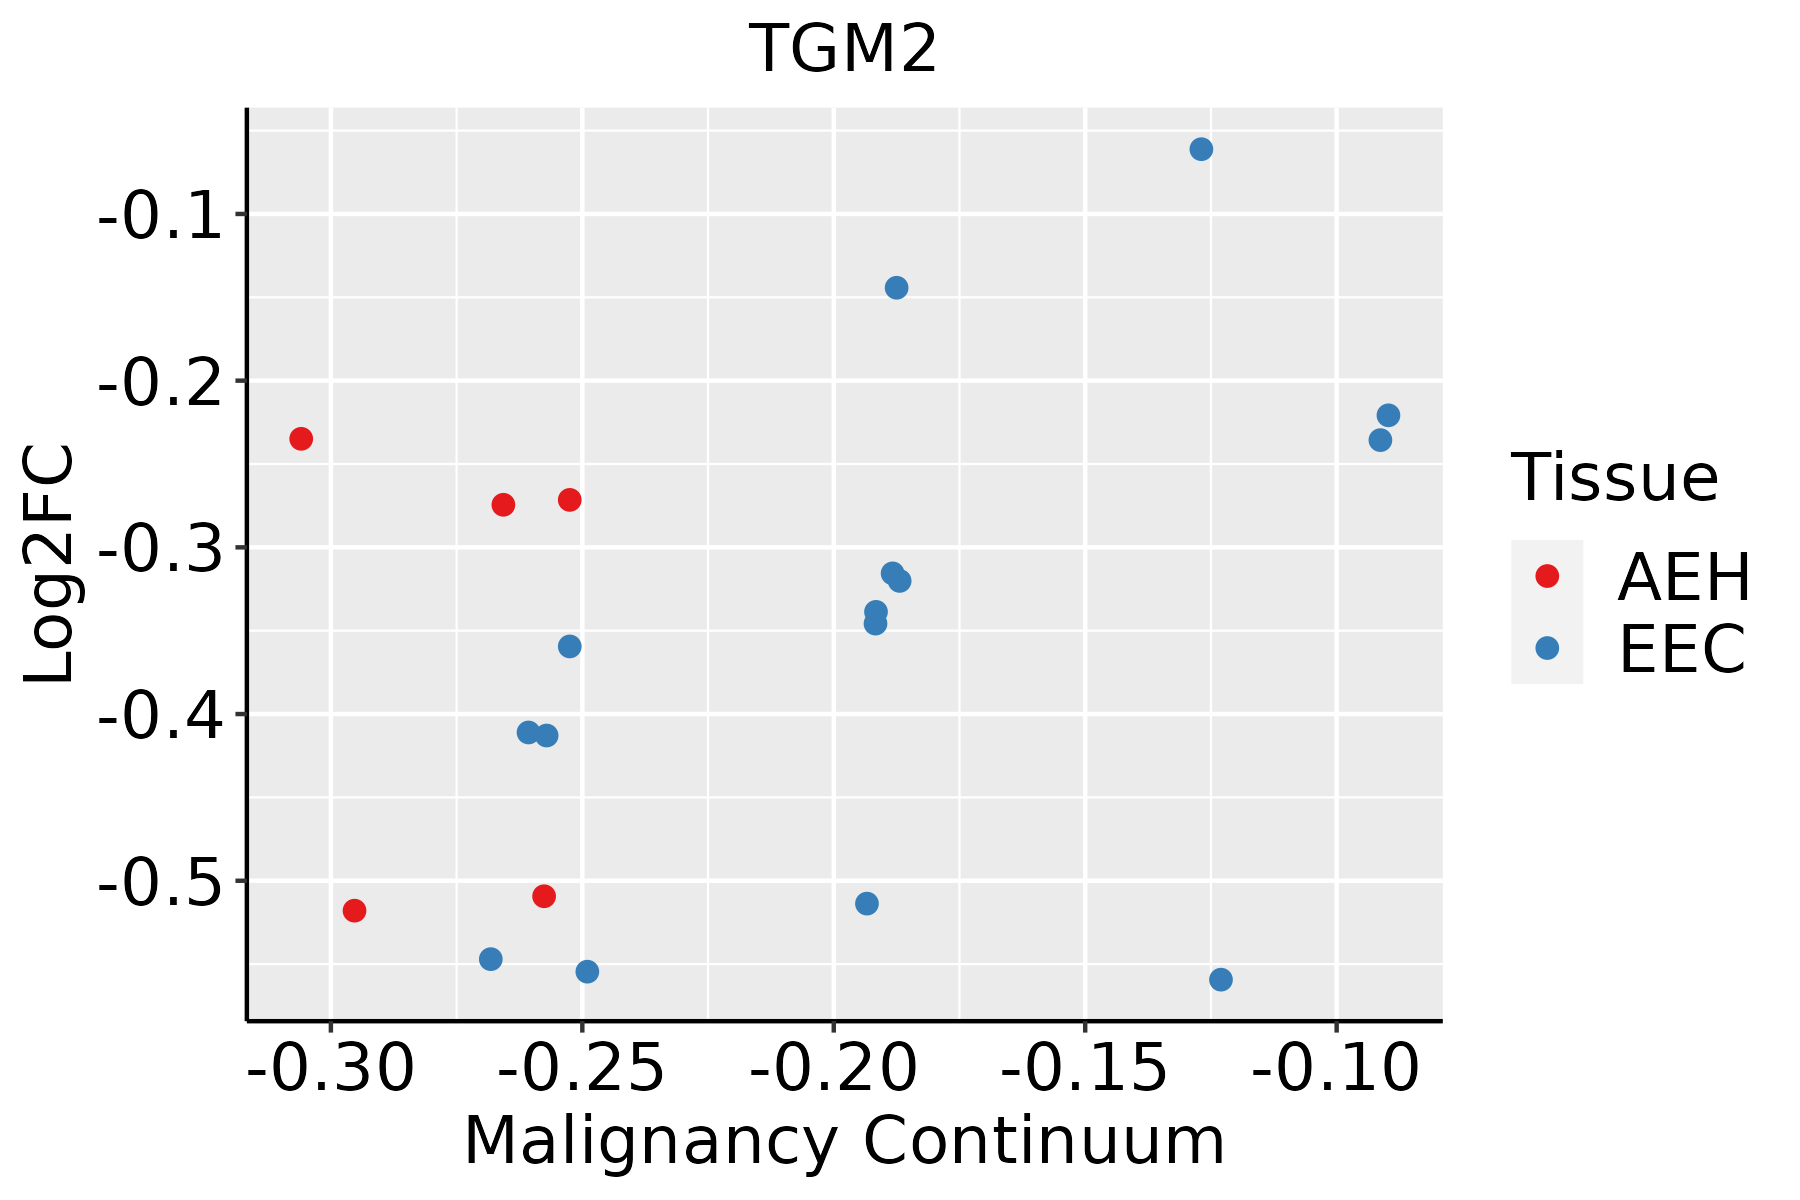 | AEH: Atypical endometrial hyperplasia |
| EEC: Endometrioid Cancer | ||
| Esophagus | 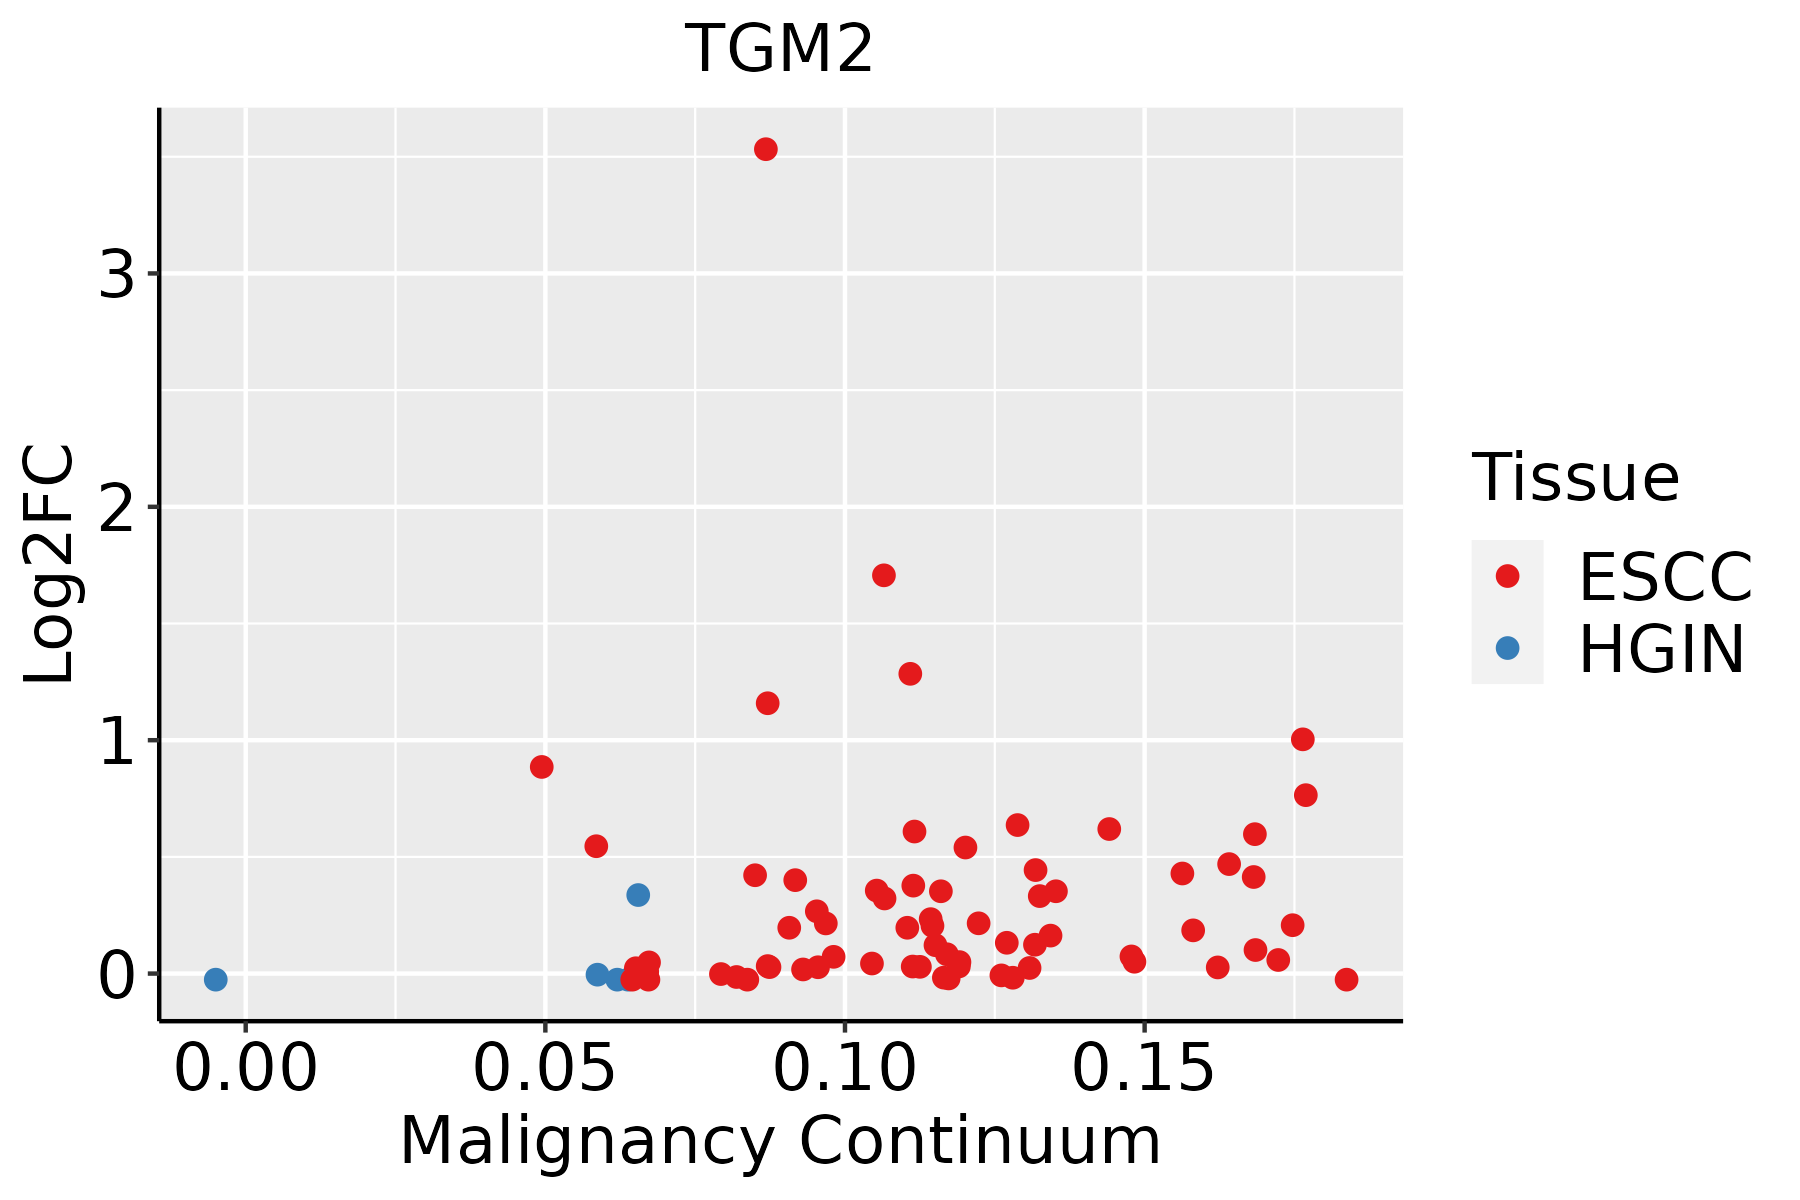 | ESCC: Esophageal squamous cell carcinoma |
| HGIN: High-grade intraepithelial neoplasias | ||
| LGIN: Low-grade intraepithelial neoplasias | ||
| Liver | 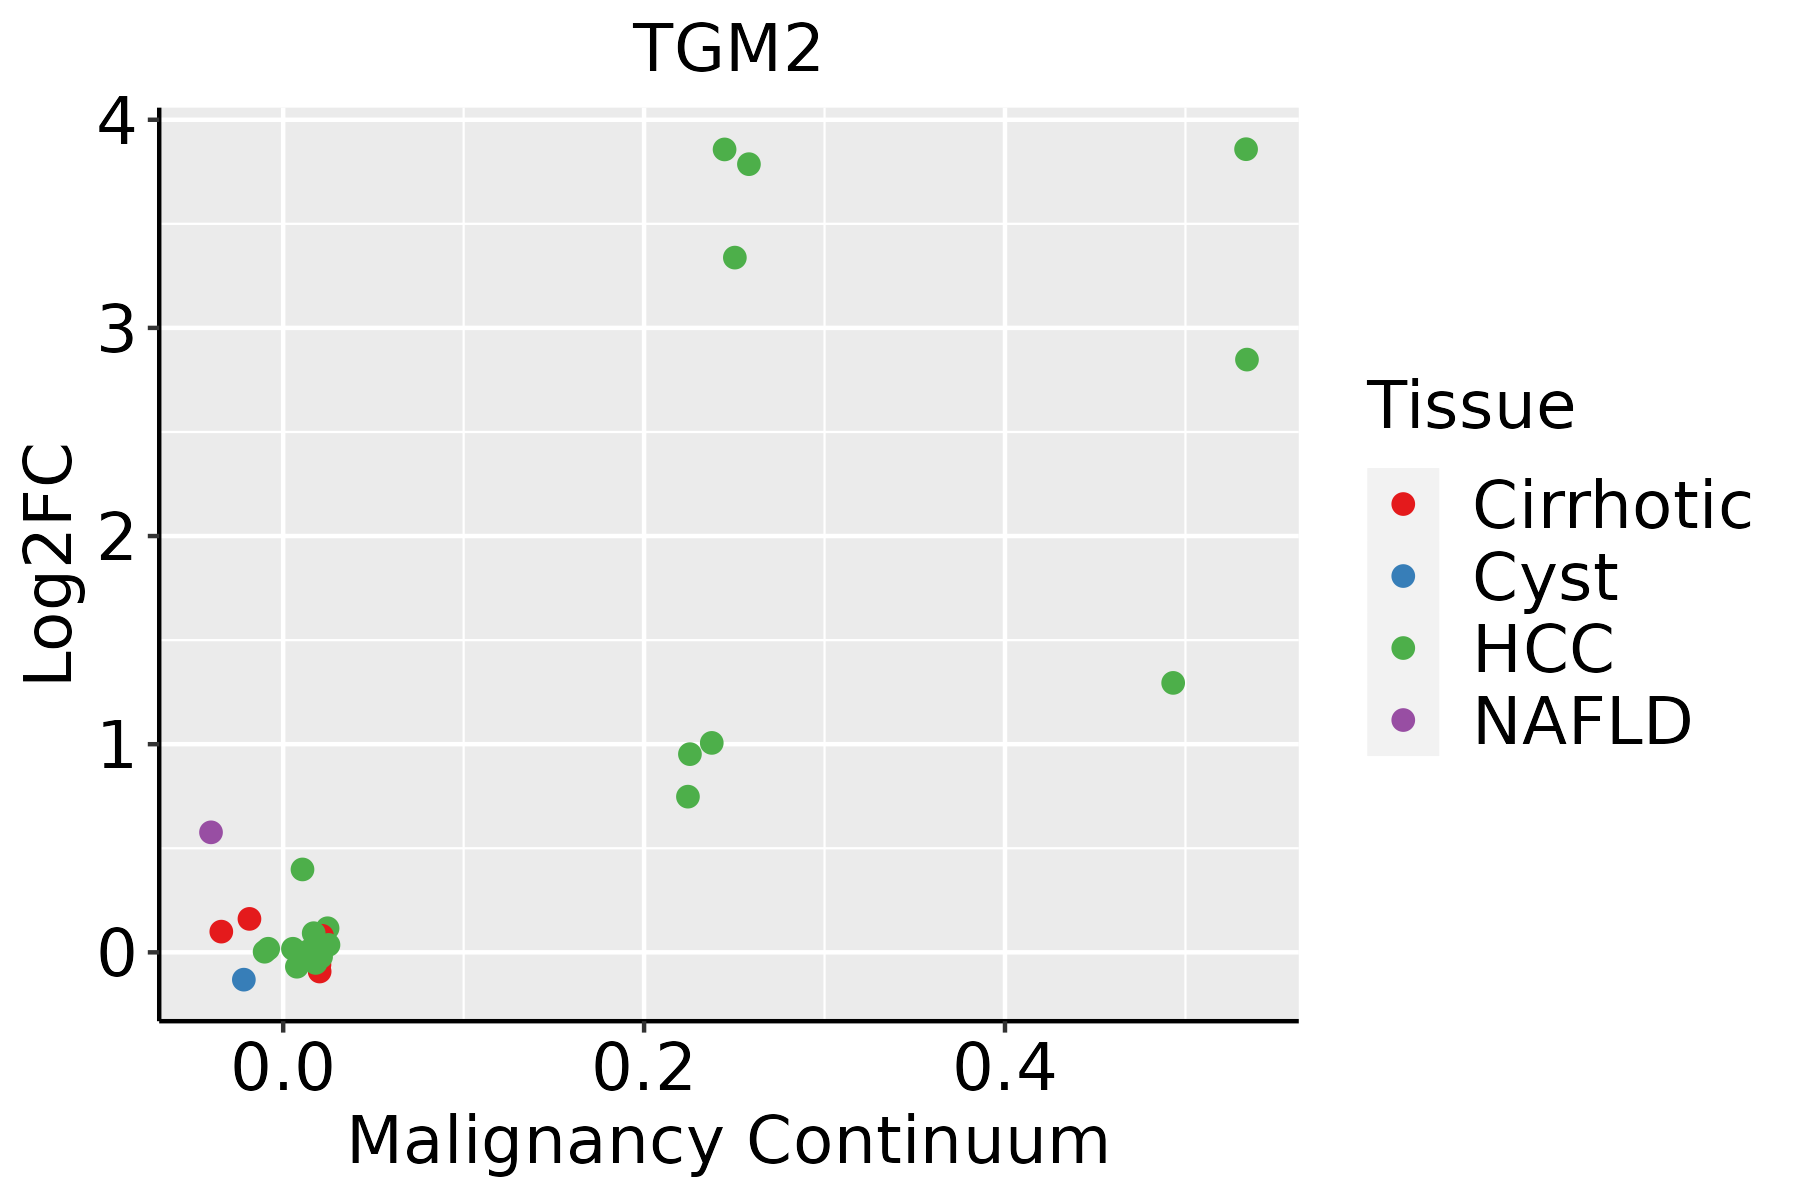 | HCC: Hepatocellular carcinoma |
| NAFLD: Non-alcoholic fatty liver disease | ||
| Oral Cavity | 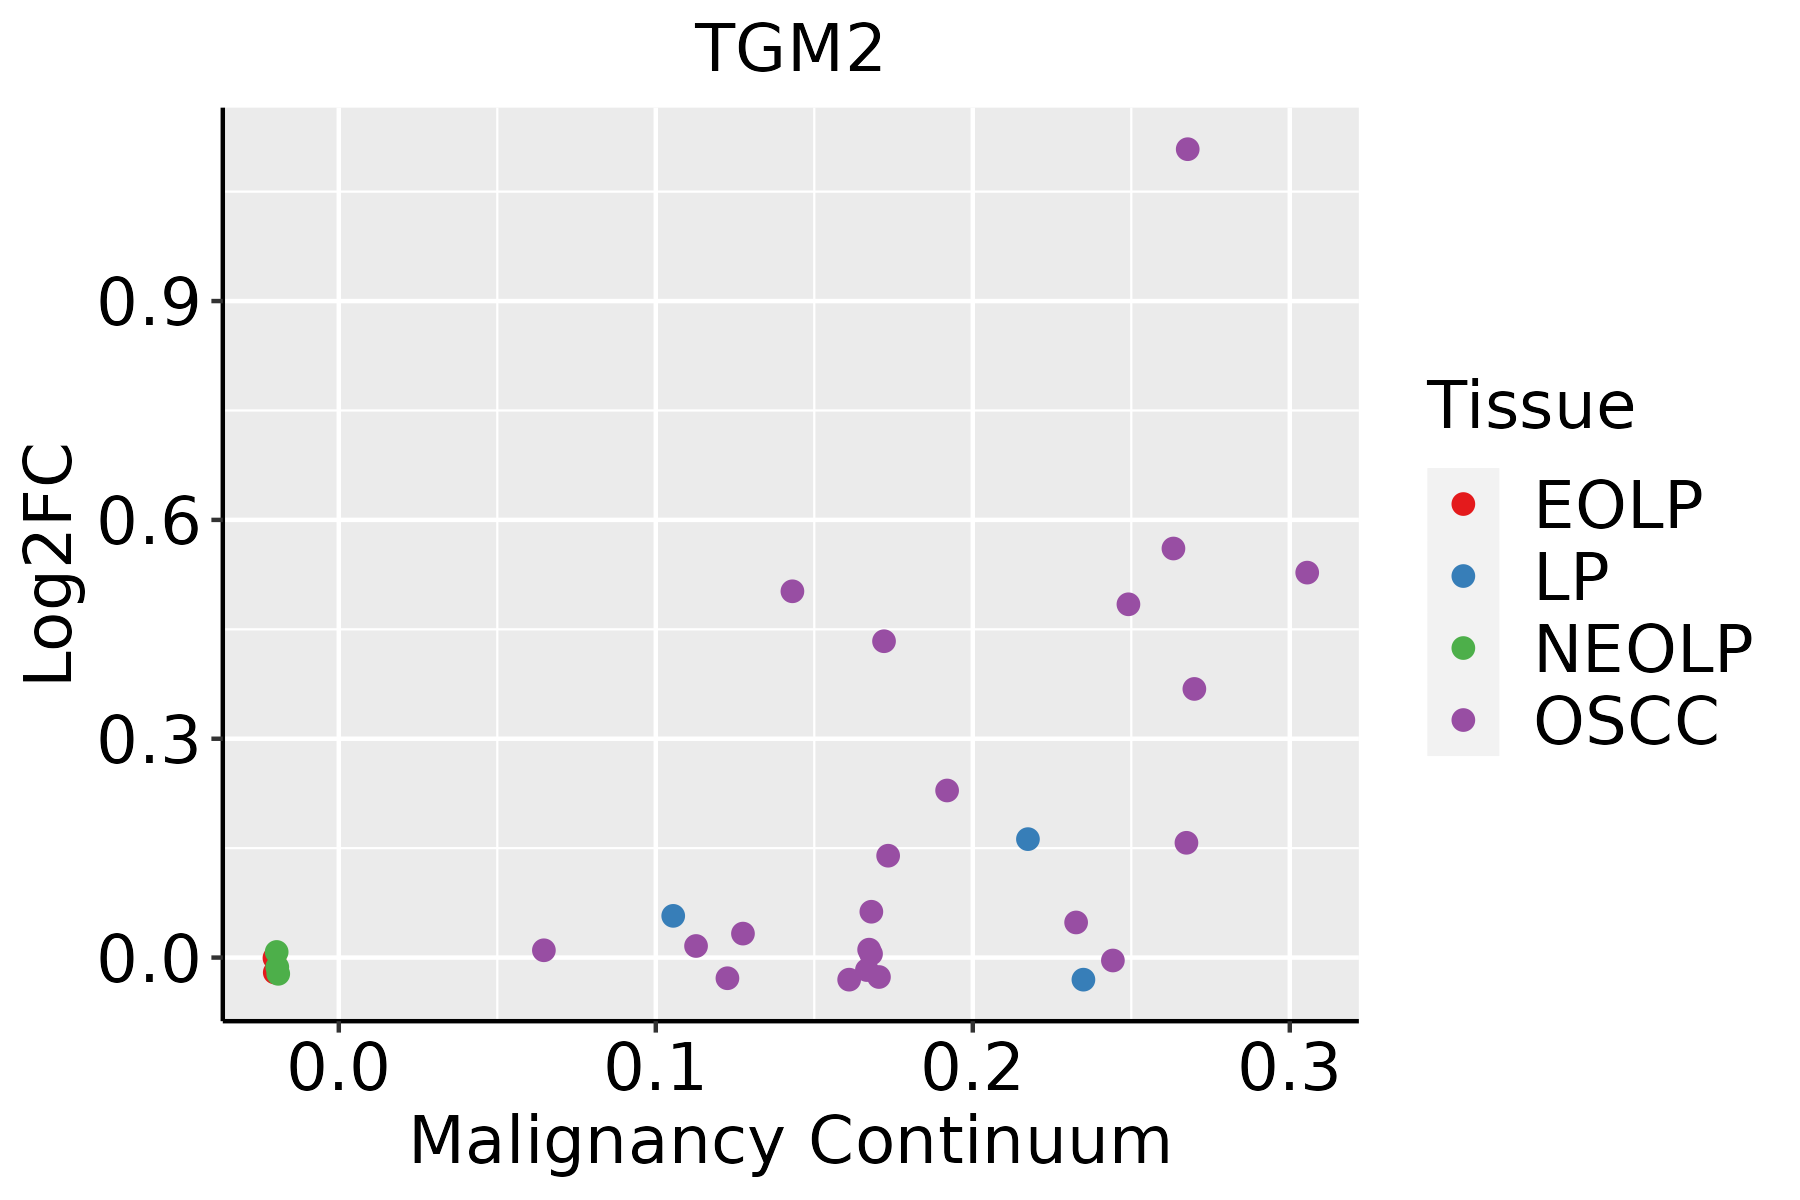 | EOLP: Erosive Oral lichen planus |
| LP: leukoplakia | ||
| NEOLP: Non-erosive oral lichen planus | ||
| OSCC: Oral squamous cell carcinoma | ||
| Prostate |  | BPH: Benign Prostatic Hyperplasia |
| Thyroid |  | ATC: Anaplastic thyroid cancer |
| HT: Hashimoto's thyroiditis | ||
| PTC: Papillary thyroid cancer |
| ∗log2FC in expression of this searched gene in stem-like cells from each diseased tissue sample relative to stem-like cells in normal samples in each tissue plotted against the malignancy continuum. Samples are colored based on if they are from different disease stage. |
Top |
Malignant transformation related pathway analysis |
| Find out the enriched GO biological processes and KEGG pathways involved in transition from healthy to precancer to cancer |
| Tissue | Disease Stage | Enriched GO biological Processes |
| Colorectum | AD |  |
| Colorectum | SER |  |
| Colorectum | MSS |  |
| Colorectum | MSI-H |  |
| Colorectum | FAP |  |
| ∗Top 15 enriched GO BP terms are showed in the bar plot of each disease state in each tissue. Each row represents a significant GO biological process which is colored according to the -log10(p.adjust). |
| Page: 1 2 3 4 5 6 7 8 9 |
| GO ID | Tissue | Disease Stage | Description | Gene Ratio | Bg Ratio | pvalue | p.adjust | Count |
| GO:00457859 | Breast | Precancer | positive regulation of cell adhesion | 52/1080 | 437/18723 | 5.74e-07 | 2.49e-05 | 52 |
| GO:00487329 | Breast | Precancer | gland development | 49/1080 | 436/18723 | 6.11e-06 | 1.73e-04 | 49 |
| GO:00507293 | Breast | Precancer | positive regulation of inflammatory response | 23/1080 | 142/18723 | 6.51e-06 | 1.81e-04 | 23 |
| GO:0050727 | Breast | Precancer | regulation of inflammatory response | 44/1080 | 386/18723 | 1.26e-05 | 3.22e-04 | 44 |
| GO:00321034 | Breast | Precancer | positive regulation of response to external stimulus | 46/1080 | 427/18723 | 3.41e-05 | 7.40e-04 | 46 |
| GO:00313493 | Breast | Precancer | positive regulation of defense response | 33/1080 | 278/18723 | 6.79e-05 | 1.36e-03 | 33 |
| GO:00351486 | Breast | Precancer | tube formation | 19/1080 | 148/18723 | 8.79e-04 | 1.01e-02 | 19 |
| GO:00324697 | Breast | Precancer | endoplasmic reticulum calcium ion homeostasis | 6/1080 | 25/18723 | 2.49e-03 | 2.28e-02 | 6 |
| GO:0072503 | Breast | Precancer | cellular divalent inorganic cation homeostasis | 42/1080 | 486/18723 | 5.91e-03 | 4.21e-02 | 42 |
| GO:00072496 | Breast | Precancer | I-kappaB kinase/NF-kappaB signaling | 27/1080 | 281/18723 | 6.58e-03 | 4.53e-02 | 27 |
| GO:004873214 | Breast | IDC | gland development | 64/1434 | 436/18723 | 3.47e-07 | 1.74e-05 | 64 |
| GO:004578514 | Breast | IDC | positive regulation of cell adhesion | 62/1434 | 437/18723 | 1.70e-06 | 7.16e-05 | 62 |
| GO:00313491 | Breast | IDC | positive regulation of defense response | 39/1434 | 278/18723 | 1.74e-04 | 2.95e-03 | 39 |
| GO:003210311 | Breast | IDC | positive regulation of response to external stimulus | 54/1434 | 427/18723 | 1.85e-04 | 3.07e-03 | 54 |
| GO:00611383 | Breast | IDC | morphogenesis of a branching epithelium | 28/1434 | 182/18723 | 3.05e-04 | 4.60e-03 | 28 |
| GO:003246913 | Breast | IDC | endoplasmic reticulum calcium ion homeostasis | 8/1434 | 25/18723 | 3.85e-04 | 5.40e-03 | 8 |
| GO:00017635 | Breast | IDC | morphogenesis of a branching structure | 29/1434 | 196/18723 | 4.68e-04 | 6.26e-03 | 29 |
| GO:00507291 | Breast | IDC | positive regulation of inflammatory response | 23/1434 | 142/18723 | 4.87e-04 | 6.42e-03 | 23 |
| GO:00507271 | Breast | IDC | regulation of inflammatory response | 48/1434 | 386/18723 | 5.99e-04 | 7.54e-03 | 48 |
| GO:00226127 | Breast | IDC | gland morphogenesis | 20/1434 | 118/18723 | 6.13e-04 | 7.69e-03 | 20 |
| Page: 1 2 3 4 5 6 7 8 9 10 11 12 13 14 |
| Pathway ID | Tissue | Disease Stage | Description | Gene Ratio | Bg Ratio | pvalue | p.adjust | qvalue | Count |
| hsa0501616 | Breast | Precancer | Huntington disease | 98/684 | 306/8465 | 2.85e-35 | 2.25e-33 | 1.72e-33 | 98 |
| hsa0501617 | Breast | Precancer | Huntington disease | 98/684 | 306/8465 | 2.85e-35 | 2.25e-33 | 1.72e-33 | 98 |
| hsa0501623 | Breast | IDC | Huntington disease | 103/867 | 306/8465 | 5.14e-30 | 4.17e-28 | 3.12e-28 | 103 |
| hsa0501633 | Breast | IDC | Huntington disease | 103/867 | 306/8465 | 5.14e-30 | 4.17e-28 | 3.12e-28 | 103 |
| hsa0501620 | Endometrium | AEH | Huntington disease | 118/1197 | 306/8465 | 3.00e-27 | 2.44e-25 | 1.78e-25 | 118 |
| hsa05016110 | Endometrium | AEH | Huntington disease | 118/1197 | 306/8465 | 3.00e-27 | 2.44e-25 | 1.78e-25 | 118 |
| hsa0501625 | Endometrium | EEC | Huntington disease | 120/1237 | 306/8465 | 3.86e-27 | 4.23e-25 | 3.15e-25 | 120 |
| hsa0501635 | Endometrium | EEC | Huntington disease | 120/1237 | 306/8465 | 3.86e-27 | 4.23e-25 | 3.15e-25 | 120 |
| hsa05016210 | Esophagus | ESCC | Huntington disease | 226/4205 | 306/8465 | 1.38e-18 | 8.72e-17 | 4.46e-17 | 226 |
| hsa0501638 | Esophagus | ESCC | Huntington disease | 226/4205 | 306/8465 | 1.38e-18 | 8.72e-17 | 4.46e-17 | 226 |
| hsa0501622 | Liver | HCC | Huntington disease | 219/4020 | 306/8465 | 3.06e-18 | 3.42e-16 | 1.90e-16 | 219 |
| hsa0501632 | Liver | HCC | Huntington disease | 219/4020 | 306/8465 | 3.06e-18 | 3.42e-16 | 1.90e-16 | 219 |
| hsa0501628 | Oral cavity | OSCC | Huntington disease | 204/3704 | 306/8465 | 1.70e-16 | 7.13e-15 | 3.63e-15 | 204 |
| hsa05016112 | Oral cavity | OSCC | Huntington disease | 204/3704 | 306/8465 | 1.70e-16 | 7.13e-15 | 3.63e-15 | 204 |
| hsa0501626 | Prostate | BPH | Huntington disease | 149/1718 | 306/8465 | 8.82e-30 | 7.27e-28 | 4.50e-28 | 149 |
| hsa05016111 | Prostate | BPH | Huntington disease | 149/1718 | 306/8465 | 8.82e-30 | 7.27e-28 | 4.50e-28 | 149 |
| hsa0501627 | Prostate | Tumor | Huntington disease | 150/1791 | 306/8465 | 2.72e-28 | 2.25e-26 | 1.40e-26 | 150 |
| hsa0501636 | Prostate | Tumor | Huntington disease | 150/1791 | 306/8465 | 2.72e-28 | 2.25e-26 | 1.40e-26 | 150 |
| Page: 1 |
Top |
Cell-cell communication analysis |
| Identification of potential cell-cell interactions between two cell types and their ligand-receptor pairs for different disease states |
| Ligand | Receptor | LRpair | Pathway | Tissue | Disease Stage |
| Page: 1 |
Top |
Single-cell gene regulatory network inference analysis |
| Find out the significant the regulons (TFs) and the target genes of each regulon across cell types for different disease states |
| TF | Cell Type | Tissue | Disease Stage | Target Gene | RSS | Regulon Activity |
| ∗The dot plots of a searched regulon are shown for all cell subpopulations in each disease state of each tissue based on the regulon specific score inferred using pySCENIC and by calculating the average expression. |
| Page: 1 |
Top |
Somatic mutation of malignant transformation related genes |
| Annotation of somatic variants for genes involved in malignant transformation |
| Hugo Symbol | Variant Class | Variant Classification | dbSNP RS | HGVSc | HGVSp | HGVSp Short | SWISSPROT | BIOTYPE | SIFT | PolyPhen | Tumor Sample Barcode | Tissue | Histology | Sex | Age | Stage | Therapy Types | Drugs | Outcome |
| TGM2 | SNV | Missense_Mutation | rs768058051 | c.1735G>C | p.Glu579Gln | p.E579Q | P21980 | protein_coding | tolerated(0.29) | benign(0.02) | TCGA-AC-A23H-01 | Breast | breast invasive carcinoma | Female | >=65 | I/II | Unknown | Unknown | PD |
| TGM2 | SNV | Missense_Mutation | novel | c.1952N>T | p.Arg651Ile | p.R651I | P21980 | protein_coding | deleterious(0.01) | benign(0.139) | TCGA-AN-A046-01 | Breast | breast invasive carcinoma | Female | >=65 | I/II | Unknown | Unknown | SD |
| TGM2 | SNV | Missense_Mutation | rs199563008 | c.1834N>A | p.Pro612Thr | p.P612T | P21980 | protein_coding | deleterious(0.03) | probably_damaging(0.994) | TCGA-AN-A0AK-01 | Breast | breast invasive carcinoma | Female | >=65 | I/II | Unknown | Unknown | SD |
| TGM2 | SNV | Missense_Mutation | rs768583570 | c.626N>A | p.Arg209His | p.R209H | P21980 | protein_coding | tolerated(0.07) | benign(0.251) | TCGA-AR-A24N-01 | Breast | breast invasive carcinoma | Female | <65 | I/II | Unknown | Unknown | SD |
| TGM2 | SNV | Missense_Mutation | c.1882N>T | p.Gly628Cys | p.G628C | P21980 | protein_coding | deleterious(0) | probably_damaging(1) | TCGA-AR-A256-01 | Breast | breast invasive carcinoma | Female | <65 | I/II | Chemotherapy | doxorubicin | PD | |
| TGM2 | SNV | Missense_Mutation | novel | c.1897N>A | p.Gln633Lys | p.Q633K | P21980 | protein_coding | tolerated(0.3) | benign(0.078) | TCGA-S3-AA10-01 | Breast | breast invasive carcinoma | Female | >=65 | I/II | Chemotherapy | cytoxan | CR |
| TGM2 | insertion | In_Frame_Ins | novel | c.1436_1437insTCACCCCACAGACACTTACATGGCGCTGACTCTGGGGCA | p.Val479_Gly480insHisProThrAspThrTyrMetAlaLeuThrLeuGlyGln | p.V479_G480insHPTDTYMALTLGQ | P21980 | protein_coding | TCGA-A2-A0EM-01 | Breast | breast invasive carcinoma | Female | >=65 | I/II | Hormone Therapy | tamoxiphen | SD | ||
| TGM2 | SNV | Missense_Mutation | c.742N>A | p.Gly248Ser | p.G248S | P21980 | protein_coding | deleterious(0) | probably_damaging(0.998) | TCGA-2W-A8YY-01 | Cervix | cervical & endocervical cancer | Female | <65 | I/II | Chemotherapy | cisplatin | CR | |
| TGM2 | SNV | Missense_Mutation | rs770129067 | c.386N>A | p.Ser129Asn | p.S129N | P21980 | protein_coding | tolerated(0.18) | benign(0.077) | TCGA-C5-A3HE-01 | Cervix | cervical & endocervical cancer | Female | <65 | I/II | Unknown | Unknown | PD |
| TGM2 | SNV | Missense_Mutation | novel | c.1092G>C | p.Lys364Asn | p.K364N | P21980 | protein_coding | deleterious(0.01) | probably_damaging(0.956) | TCGA-EK-A2RJ-01 | Cervix | cervical & endocervical cancer | Female | <65 | I/II | Unknown | Unknown | SD |
| Page: 1 2 3 4 5 6 7 8 9 |
Top |
Related drugs of malignant transformation related genes |
| Identification of chemicals and drugs interact with genes involved in malignant transfromation |
| (DGIdb 4.0) |
| Entrez ID | Symbol | Category | Interaction Types | Drug Claim Name | Drug Name | PMIDs |
| 7052 | TGM2 | PROTEASE, DRUGGABLE GENOME, ENZYME | DEFEROXAMINE | DEFEROXAMINE | 9194688 | |
| 7052 | TGM2 | PROTEASE, DRUGGABLE GENOME, ENZYME | RAPAMYCIN | SIROLIMUS | 16127150 | |
| 7052 | TGM2 | PROTEASE, DRUGGABLE GENOME, ENZYME | Dihydroisoxazole derivative 1 | |||
| 7052 | TGM2 | PROTEASE, DRUGGABLE GENOME, ENZYME | ACIVICIN | ACIVICIN | 12670536 | |
| 7052 | TGM2 | PROTEASE, DRUGGABLE GENOME, ENZYME | PMID26560530-Compound-8 | |||
| 7052 | TGM2 | PROTEASE, DRUGGABLE GENOME, ENZYME | PMID26560530-Compound-23 | |||
| 7052 | TGM2 | PROTEASE, DRUGGABLE GENOME, ENZYME | 3-acylidene-2-oxoindole derivative 1 | |||
| 7052 | TGM2 | PROTEASE, DRUGGABLE GENOME, ENZYME | PMID26560530-Compound-46 | |||
| 7052 | TGM2 | PROTEASE, DRUGGABLE GENOME, ENZYME | LEVAMISOLE | LEVAMISOLE | 17669706 | |
| 7052 | TGM2 | PROTEASE, DRUGGABLE GENOME, ENZYME | MIDAZOLAM | MIDAZOLAM | 17093965 |
| Page: 1 2 3 4 5 6 7 8 9 10 |

Copyright 2023-Present -The University of Texas Health Science Center at Houston |