
|
|||||
|
 | |
| |
| |
| |
| |
| |
|
Gene: TGIF2 |
Gene summary for TGIF2 |
| Gene information | Species | Human | Gene symbol | TGIF2 | Gene ID | 60436 |
| Gene name | TGFB induced factor homeobox 2 | |
| Gene Alias | TGIF2 | |
| Cytomap | 20q11.23 | |
| Gene Type | protein-coding | GO ID | GO:0000122 | UniProtAcc | Q9GZN2 |
Top |
Malignant transformation analysis |
| Identification of the aberrant gene expression in precancerous and cancerous lesions by comparing the gene expression of stem-like cells in diseased tissues with normal stem cells |
| Entrez ID | Symbol | Replicates | Species | Organ | Tissue | Adj P-value | Log2FC | Malignancy |
| 60436 | TGIF2 | HTA11_3410_2000001011 | Human | Colorectum | AD | 2.29e-05 | 1.44e-01 | 0.0155 |
| 60436 | TGIF2 | HTA11_1391_2000001011 | Human | Colorectum | AD | 3.65e-10 | 2.86e-01 | -0.059 |
| 60436 | TGIF2 | HTA11_866_3004761011 | Human | Colorectum | AD | 1.27e-12 | 2.77e-01 | 0.096 |
| 60436 | TGIF2 | HTA11_8622_2000001021 | Human | Colorectum | SER | 4.45e-03 | 1.83e-01 | 0.0528 |
| 60436 | TGIF2 | HTA11_7663_2000001011 | Human | Colorectum | SER | 6.81e-04 | 2.31e-01 | 0.0131 |
| 60436 | TGIF2 | HTA11_10711_2000001011 | Human | Colorectum | AD | 9.64e-06 | 1.83e-01 | 0.0338 |
| 60436 | TGIF2 | HTA11_7696_3000711011 | Human | Colorectum | AD | 2.67e-20 | 3.70e-01 | 0.0674 |
| 60436 | TGIF2 | HTA11_6818_2000001011 | Human | Colorectum | AD | 4.13e-05 | 2.91e-01 | 0.0112 |
| 60436 | TGIF2 | HTA11_6818_2000001021 | Human | Colorectum | AD | 6.03e-04 | 1.94e-01 | 0.0588 |
| 60436 | TGIF2 | HTA11_99999970781_79442 | Human | Colorectum | MSS | 8.44e-12 | 2.60e-01 | 0.294 |
| 60436 | TGIF2 | HTA11_99999965062_69753 | Human | Colorectum | MSI-H | 7.89e-03 | 4.85e-01 | 0.3487 |
| 60436 | TGIF2 | HTA11_99999965104_69814 | Human | Colorectum | MSS | 3.86e-11 | 3.79e-01 | 0.281 |
| 60436 | TGIF2 | HTA11_99999971662_82457 | Human | Colorectum | MSS | 3.40e-53 | 1.01e+00 | 0.3859 |
| 60436 | TGIF2 | HTA11_99999973899_84307 | Human | Colorectum | MSS | 1.49e-25 | 8.62e-01 | 0.2585 |
| 60436 | TGIF2 | HTA11_99999974143_84620 | Human | Colorectum | MSS | 7.76e-28 | 5.14e-01 | 0.3005 |
| 60436 | TGIF2 | LZE4T | Human | Esophagus | ESCC | 1.69e-02 | 1.34e-01 | 0.0811 |
| 60436 | TGIF2 | LZE8T | Human | Esophagus | ESCC | 1.19e-02 | -2.74e-02 | 0.067 |
| 60436 | TGIF2 | LZE24T | Human | Esophagus | ESCC | 3.65e-15 | 6.19e-01 | 0.0596 |
| 60436 | TGIF2 | LZE21T | Human | Esophagus | ESCC | 4.74e-02 | 9.33e-02 | 0.0655 |
| 60436 | TGIF2 | P1T-E | Human | Esophagus | ESCC | 3.57e-03 | 5.33e-01 | 0.0875 |
| Page: 1 2 3 4 5 |
| Tissue | Expression Dynamics | Abbreviation |
| Colorectum (GSE201348) |  | FAP: Familial adenomatous polyposis |
| CRC: Colorectal cancer | ||
| Colorectum (HTA11) |  | AD: Adenomas |
| SER: Sessile serrated lesions | ||
| MSI-H: Microsatellite-high colorectal cancer | ||
| MSS: Microsatellite stable colorectal cancer | ||
| Esophagus | 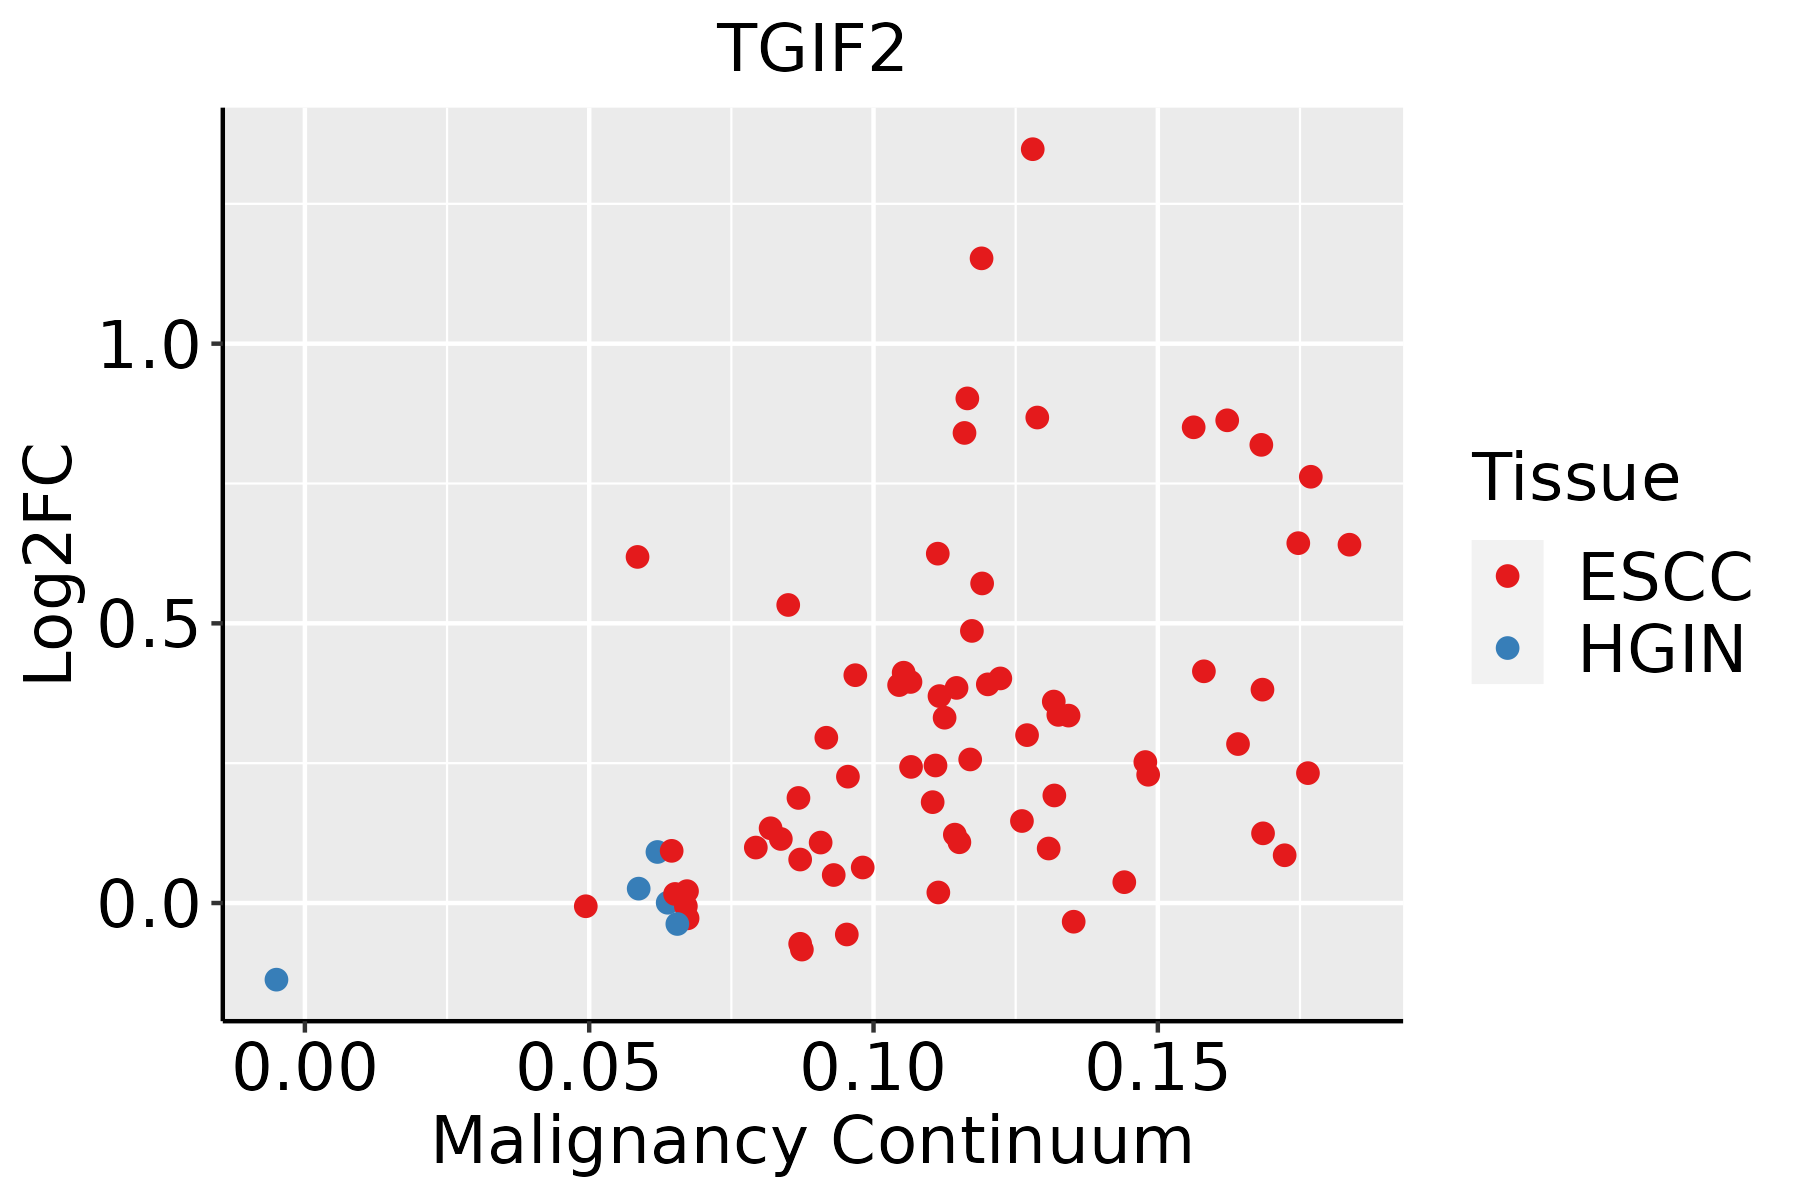 | ESCC: Esophageal squamous cell carcinoma |
| HGIN: High-grade intraepithelial neoplasias | ||
| LGIN: Low-grade intraepithelial neoplasias | ||
| Liver | 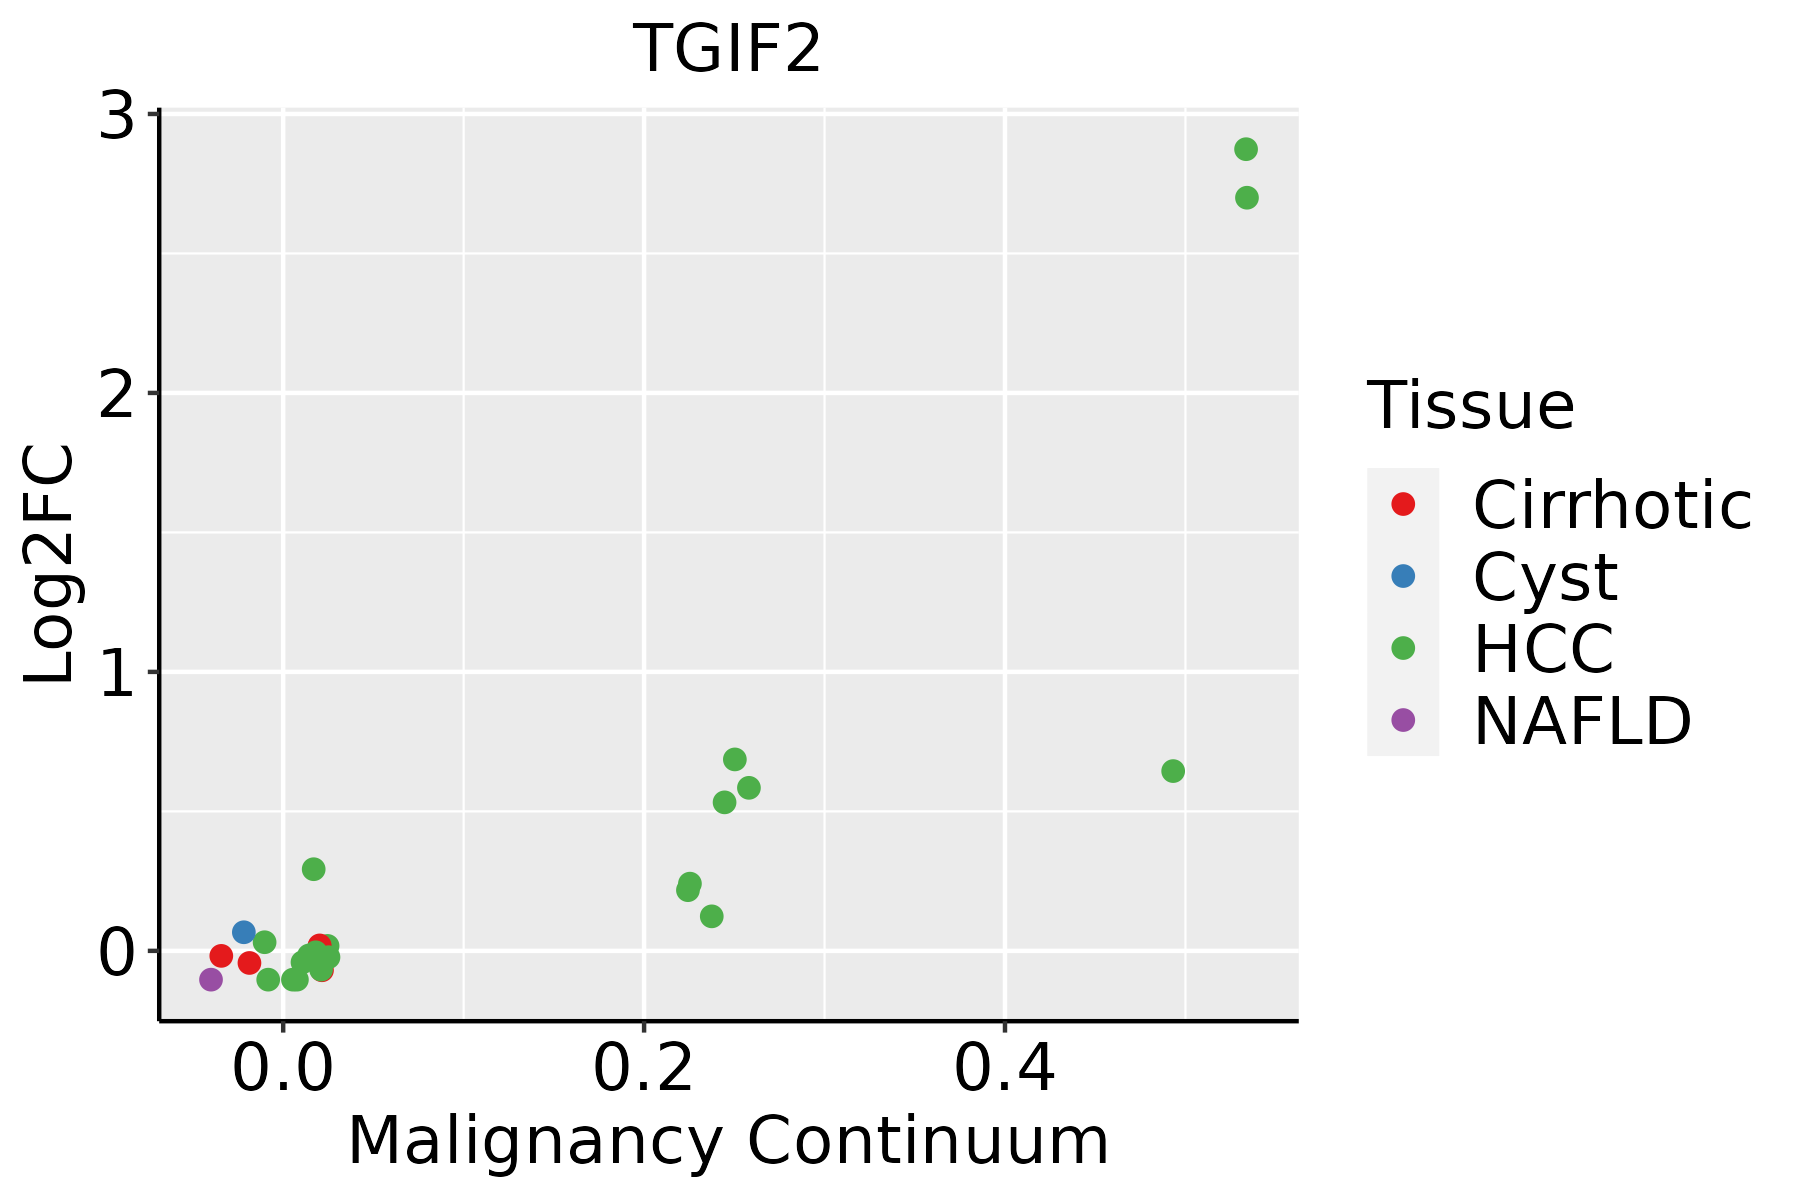 | HCC: Hepatocellular carcinoma |
| NAFLD: Non-alcoholic fatty liver disease | ||
| Oral Cavity | 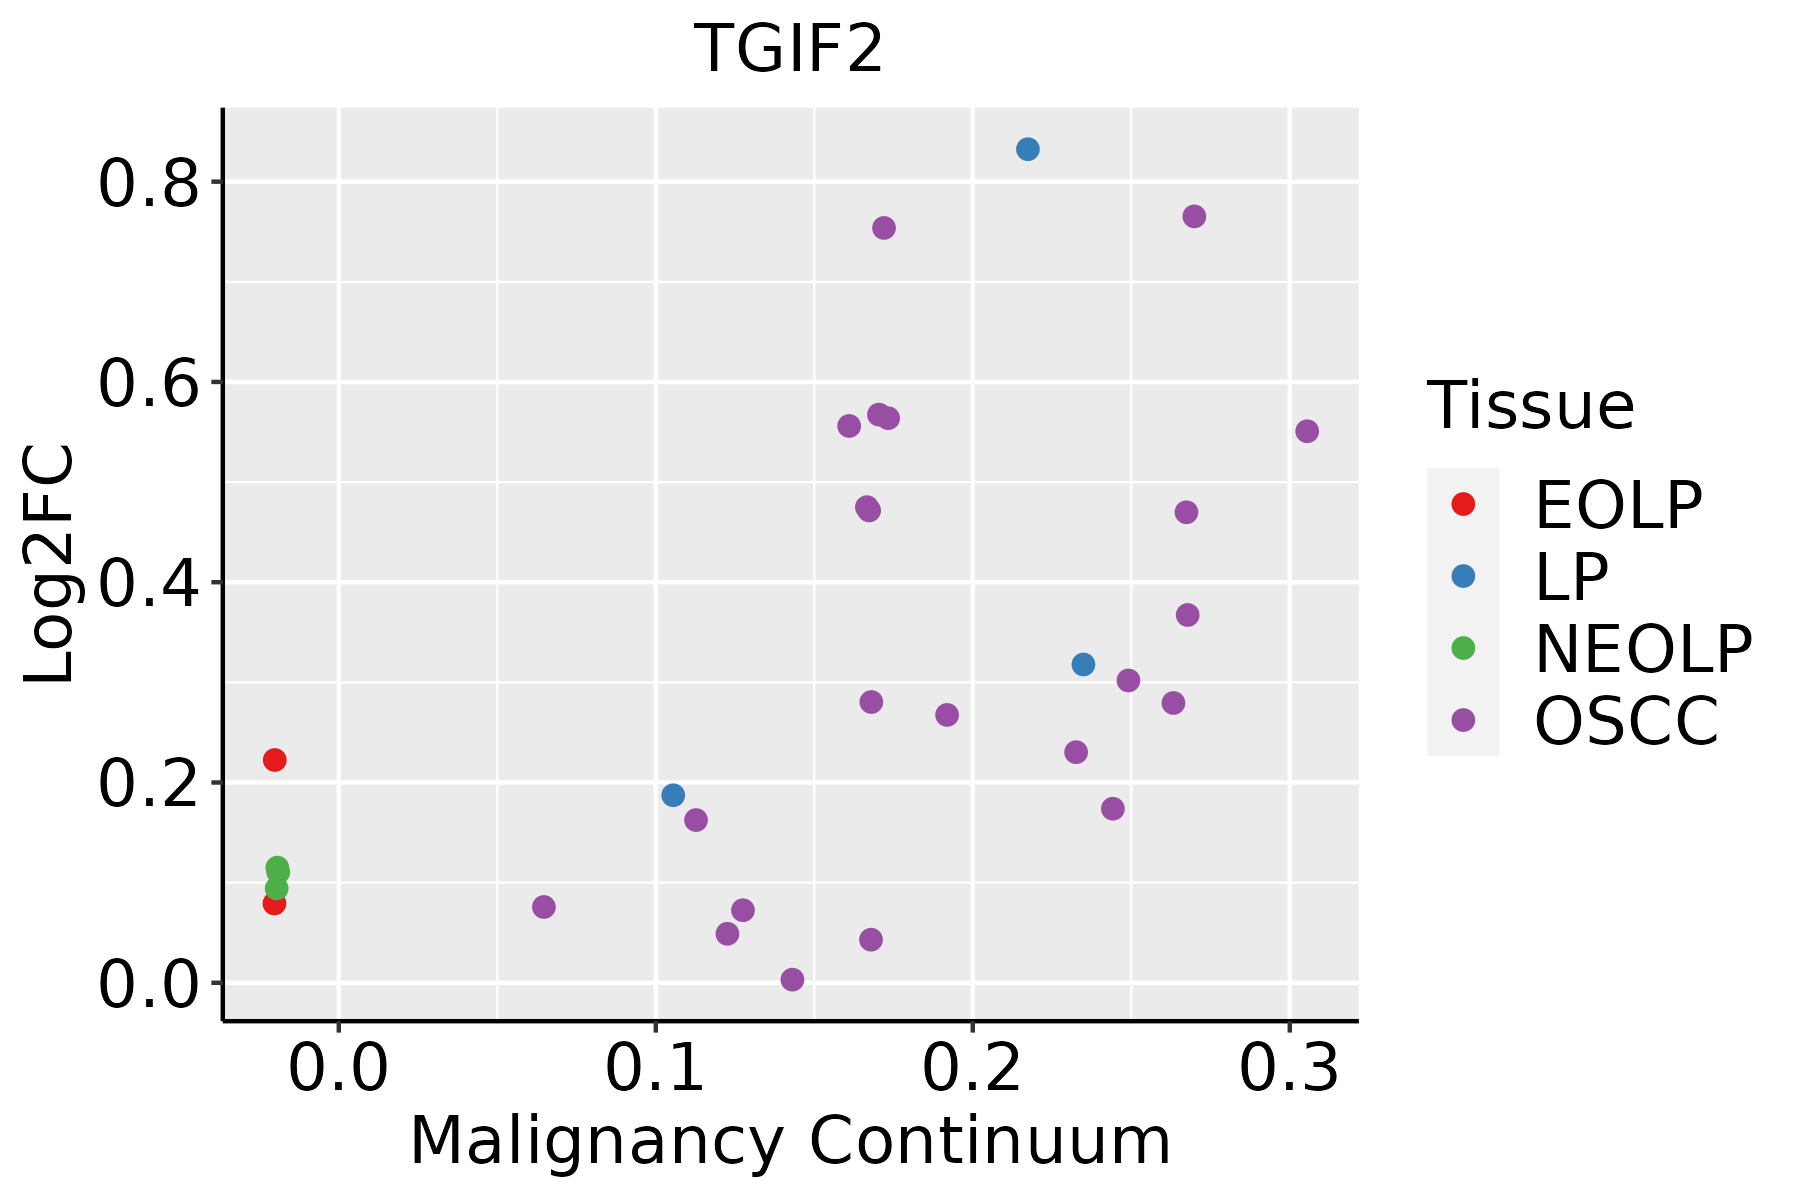 | EOLP: Erosive Oral lichen planus |
| LP: leukoplakia | ||
| NEOLP: Non-erosive oral lichen planus | ||
| OSCC: Oral squamous cell carcinoma |
| ∗log2FC in expression of this searched gene in stem-like cells from each diseased tissue sample relative to stem-like cells in normal samples in each tissue plotted against the malignancy continuum. Samples are colored based on if they are from different disease stage. |
Top |
Malignant transformation related pathway analysis |
| Find out the enriched GO biological processes and KEGG pathways involved in transition from healthy to precancer to cancer |
| Tissue | Disease Stage | Enriched GO biological Processes |
| Colorectum | AD |  |
| Colorectum | SER |  |
| Colorectum | MSS |  |
| Colorectum | MSI-H |  |
| Colorectum | FAP |  |
| ∗Top 15 enriched GO BP terms are showed in the bar plot of each disease state in each tissue. Each row represents a significant GO biological process which is colored according to the -log10(p.adjust). |
| Page: 1 2 3 4 5 6 7 8 9 |
| GO ID | Tissue | Disease Stage | Description | Gene Ratio | Bg Ratio | pvalue | p.adjust | Count |
| GO:0007178 | Colorectum | AD | transmembrane receptor protein serine/threonine kinase signaling pathway | 99/3918 | 355/18723 | 9.92e-04 | 9.28e-03 | 99 |
| GO:0045995 | Colorectum | AD | regulation of embryonic development | 24/3918 | 64/18723 | 1.72e-03 | 1.43e-02 | 24 |
| GO:0007369 | Colorectum | AD | gastrulation | 53/3918 | 185/18723 | 7.60e-03 | 4.60e-02 | 53 |
| GO:00073691 | Colorectum | SER | gastrulation | 43/2897 | 185/18723 | 3.44e-03 | 2.92e-02 | 43 |
| GO:00071781 | Colorectum | MSS | transmembrane receptor protein serine/threonine kinase signaling pathway | 86/3467 | 355/18723 | 4.04e-03 | 2.95e-02 | 86 |
| GO:00073698 | Esophagus | ESCC | gastrulation | 115/8552 | 185/18723 | 4.35e-06 | 4.64e-05 | 115 |
| GO:000717810 | Esophagus | ESCC | transmembrane receptor protein serine/threonine kinase signaling pathway | 195/8552 | 355/18723 | 2.58e-04 | 1.58e-03 | 195 |
| GO:00073697 | Oral cavity | OSCC | gastrulation | 95/7305 | 185/18723 | 4.17e-04 | 2.54e-03 | 95 |
| GO:00071789 | Oral cavity | OSCC | transmembrane receptor protein serine/threonine kinase signaling pathway | 165/7305 | 355/18723 | 2.31e-03 | 1.02e-02 | 165 |
| GO:000736913 | Oral cavity | EOLP | gastrulation | 39/2218 | 185/18723 | 2.29e-04 | 2.25e-03 | 39 |
| GO:000717816 | Oral cavity | EOLP | transmembrane receptor protein serine/threonine kinase signaling pathway | 64/2218 | 355/18723 | 3.85e-04 | 3.46e-03 | 64 |
| GO:00016542 | Oral cavity | EOLP | eye development | 62/2218 | 371/18723 | 3.18e-03 | 1.85e-02 | 62 |
| GO:01500632 | Oral cavity | EOLP | visual system development | 62/2218 | 375/18723 | 4.07e-03 | 2.24e-02 | 62 |
| GO:00488802 | Oral cavity | EOLP | sensory system development | 62/2218 | 381/18723 | 5.82e-03 | 2.94e-02 | 62 |
| GO:00459957 | Oral cavity | EOLP | regulation of embryonic development | 15/2218 | 64/18723 | 6.83e-03 | 3.32e-02 | 15 |
| Page: 1 |
| Pathway ID | Tissue | Disease Stage | Description | Gene Ratio | Bg Ratio | pvalue | p.adjust | qvalue | Count |
| hsa04350 | Colorectum | SER | TGF-beta signaling pathway | 31/1580 | 108/8465 | 7.00e-03 | 3.77e-02 | 2.74e-02 | 31 |
| hsa043501 | Colorectum | SER | TGF-beta signaling pathway | 31/1580 | 108/8465 | 7.00e-03 | 3.77e-02 | 2.74e-02 | 31 |
| hsa043507 | Esophagus | ESCC | TGF-beta signaling pathway | 69/4205 | 108/8465 | 1.92e-03 | 5.54e-03 | 2.84e-03 | 69 |
| hsa0435014 | Esophagus | ESCC | TGF-beta signaling pathway | 69/4205 | 108/8465 | 1.92e-03 | 5.54e-03 | 2.84e-03 | 69 |
| hsa043506 | Oral cavity | OSCC | TGF-beta signaling pathway | 60/3704 | 108/8465 | 8.66e-03 | 1.97e-02 | 1.00e-02 | 60 |
| hsa0435013 | Oral cavity | OSCC | TGF-beta signaling pathway | 60/3704 | 108/8465 | 8.66e-03 | 1.97e-02 | 1.00e-02 | 60 |
| hsa0435022 | Oral cavity | EOLP | TGF-beta signaling pathway | 29/1218 | 108/8465 | 4.81e-04 | 1.92e-03 | 1.13e-03 | 29 |
| hsa0435032 | Oral cavity | EOLP | TGF-beta signaling pathway | 29/1218 | 108/8465 | 4.81e-04 | 1.92e-03 | 1.13e-03 | 29 |
| Page: 1 |
Top |
Cell-cell communication analysis |
| Identification of potential cell-cell interactions between two cell types and their ligand-receptor pairs for different disease states |
| Ligand | Receptor | LRpair | Pathway | Tissue | Disease Stage |
| Page: 1 |
Top |
Single-cell gene regulatory network inference analysis |
| Find out the significant the regulons (TFs) and the target genes of each regulon across cell types for different disease states |
| TF | Cell Type | Tissue | Disease Stage | Target Gene | RSS | Regulon Activity |
| TGIF2 | CAF | Breast | ADJ | HECA,CITED2,MEG8, etc. | 7.99e-02 |  |
| TGIF2 | CAF | Breast | Precancer | HECA,CITED2,MEG8, etc. | 2.51e-01 |  |
| TGIF2 | TUF | Colorectum | ADJ | TGIF2(+) | 9.74e-02 |  |
| TGIF2 | TREG | Prostate | BPH | ALKBH5,TRIM37,CIPC, etc. | 2.68e-03 |  |
| TGIF2 | TH1 | Prostate | BPH | ALKBH5,TRIM37,CIPC, etc. | 5.28e-03 | |
| TGIF2 | STM | Skin | ADJ | ATP11C,KRT15,CDYL2, etc. | 3.55e-01 |  |
| TGIF2 | STM | Skin | AK | ATP11C,KRT15,CDYL2, etc. | 1.34e-01 |  |
| TGIF2 | STM | Skin | cSCC | ATP11C,KRT15,CDYL2, etc. | 4.90e-01 |  |
| TGIF2 | PIL | Skin | Healthy | ZNF281,MAFF,NUCKS1, etc. | 1.33e-01 |  |
| TGIF2 | STM | Skin | SCCIS | ATP11C,KRT15,CDYL2, etc. | 2.98e-01 |  |
| ∗The dot plots of a searched regulon are shown for all cell subpopulations in each disease state of each tissue based on the regulon specific score inferred using pySCENIC and by calculating the average expression. |
| Page: 1 2 |
Top |
Somatic mutation of malignant transformation related genes |
| Annotation of somatic variants for genes involved in malignant transformation |
| Hugo Symbol | Variant Class | Variant Classification | dbSNP RS | HGVSc | HGVSp | HGVSp Short | SWISSPROT | BIOTYPE | SIFT | PolyPhen | Tumor Sample Barcode | Tissue | Histology | Sex | Age | Stage | Therapy Types | Drugs | Outcome |
| TGIF2 | SNV | Missense_Mutation | c.467N>T | p.Pro156Leu | p.P156L | Q9GZN2 | protein_coding | tolerated(0.32) | benign(0) | TCGA-A2-A0EV-01 | Breast | breast invasive carcinoma | Female | >=65 | I/II | Unknown | Unknown | SD | |
| TGIF2 | SNV | Missense_Mutation | c.22G>A | p.Glu8Lys | p.E8K | Q9GZN2 | protein_coding | tolerated(0.18) | possibly_damaging(0.549) | TCGA-A8-A0A7-01 | Breast | breast invasive carcinoma | Female | <65 | I/II | Unknown | Unknown | SD | |
| TGIF2 | insertion | Nonsense_Mutation | novel | c.117_118insTTTCCAGCCTGAGTCCTGCTTGTGAATGAGCTGC | p.His40PhefsTer4 | p.H40Ffs*4 | Q9GZN2 | protein_coding | TCGA-A8-A097-01 | Breast | breast invasive carcinoma | Female | >=65 | I/II | Hormone Therapy | tamoxiphen | SD | ||
| TGIF2 | SNV | Missense_Mutation | rs777710225 | c.61N>T | p.Arg21Cys | p.R21C | Q9GZN2 | protein_coding | deleterious(0.02) | benign(0.308) | TCGA-2W-A8YY-01 | Cervix | cervical & endocervical cancer | Female | <65 | I/II | Chemotherapy | cisplatin | CR |
| TGIF2 | SNV | Missense_Mutation | rs751068484 | c.121N>T | p.Arg41Cys | p.R41C | Q9GZN2 | protein_coding | deleterious(0) | probably_damaging(0.998) | TCGA-JW-A5VL-01 | Cervix | cervical & endocervical cancer | Female | <65 | I/II | Unknown | Unknown | SD |
| TGIF2 | SNV | Missense_Mutation | rs753577002 | c.224N>A | p.Arg75Gln | p.R75Q | Q9GZN2 | protein_coding | deleterious(0.01) | probably_damaging(0.992) | TCGA-AA-3672-01 | Colorectum | colon adenocarcinoma | Female | >=65 | III/IV | Unknown | Unknown | SD |
| TGIF2 | SNV | Missense_Mutation | rs772232186 | c.86N>T | p.Ser29Leu | p.S29L | Q9GZN2 | protein_coding | deleterious(0) | probably_damaging(0.963) | TCGA-AA-3864-01 | Colorectum | colon adenocarcinoma | Male | >=65 | I/II | Unknown | Unknown | SD |
| TGIF2 | SNV | Missense_Mutation | c.400N>T | p.Leu134Phe | p.L134F | Q9GZN2 | protein_coding | tolerated(0.37) | benign(0.406) | TCGA-AA-A01D-01 | Colorectum | colon adenocarcinoma | Female | <65 | III/IV | Chemotherapy | capecitabine | PD | |
| TGIF2 | SNV | Missense_Mutation | c.430N>A | p.Ala144Thr | p.A144T | Q9GZN2 | protein_coding | tolerated(0.45) | benign(0.001) | TCGA-D5-6927-01 | Colorectum | colon adenocarcinoma | Male | <65 | I/II | Unknown | Unknown | SD | |
| TGIF2 | SNV | Missense_Mutation | novel | c.509N>A | p.Ala170Asp | p.A170D | Q9GZN2 | protein_coding | tolerated(0.39) | benign(0.164) | TCGA-A5-A0G1-01 | Endometrium | uterine corpus endometrioid carcinoma | Female | >=65 | I/II | Unknown | Unknown | SD |
| Page: 1 2 3 |
Top |
Related drugs of malignant transformation related genes |
| Identification of chemicals and drugs interact with genes involved in malignant transfromation |
| (DGIdb 4.0) |
| Entrez ID | Symbol | Category | Interaction Types | Drug Claim Name | Drug Name | PMIDs |
| Page: 1 |

Copyright 2023-Present -The University of Texas Health Science Center at Houston |