
|
|||||
|
 | |
| |
| |
| |
| |
| |
|
Gene: TGIF1 |
Gene summary for TGIF1 |
| Gene information | Species | Human | Gene symbol | TGIF1 | Gene ID | 7050 |
| Gene name | TGFB induced factor homeobox 1 | |
| Gene Alias | HPE4 | |
| Cytomap | 18p11.31 | |
| Gene Type | protein-coding | GO ID | GO:0000122 | UniProtAcc | Q15583 |
Top |
Malignant transformation analysis |
| Identification of the aberrant gene expression in precancerous and cancerous lesions by comparing the gene expression of stem-like cells in diseased tissues with normal stem cells |
| Entrez ID | Symbol | Replicates | Species | Organ | Tissue | Adj P-value | Log2FC | Malignancy |
| 7050 | TGIF1 | HTA11_3410_2000001011 | Human | Colorectum | AD | 4.68e-04 | 2.82e-01 | 0.0155 |
| 7050 | TGIF1 | HTA11_1938_2000001011 | Human | Colorectum | AD | 2.66e-12 | 7.75e-01 | -0.0811 |
| 7050 | TGIF1 | HTA11_78_2000001011 | Human | Colorectum | AD | 1.60e-04 | 4.91e-01 | -0.1088 |
| 7050 | TGIF1 | HTA11_347_2000001011 | Human | Colorectum | AD | 5.33e-04 | 4.07e-01 | -0.1954 |
| 7050 | TGIF1 | HTA11_696_2000001011 | Human | Colorectum | AD | 2.11e-04 | 3.02e-01 | -0.1464 |
| 7050 | TGIF1 | HTA11_866_2000001011 | Human | Colorectum | AD | 3.34e-03 | 2.77e-01 | -0.1001 |
| 7050 | TGIF1 | HTA11_1391_2000001011 | Human | Colorectum | AD | 8.76e-11 | 6.85e-01 | -0.059 |
| 7050 | TGIF1 | HTA11_866_3004761011 | Human | Colorectum | AD | 2.62e-16 | 8.27e-01 | 0.096 |
| 7050 | TGIF1 | HTA11_7663_2000001011 | Human | Colorectum | SER | 6.62e-06 | 9.86e-01 | 0.0131 |
| 7050 | TGIF1 | HTA11_10623_2000001011 | Human | Colorectum | AD | 2.17e-06 | 5.67e-01 | -0.0177 |
| 7050 | TGIF1 | HTA11_7696_3000711011 | Human | Colorectum | AD | 5.13e-19 | 6.58e-01 | 0.0674 |
| 7050 | TGIF1 | HTA11_7469_2000001011 | Human | Colorectum | AD | 1.50e-02 | 6.99e-01 | -0.0124 |
| 7050 | TGIF1 | HTA11_6818_2000001021 | Human | Colorectum | AD | 2.09e-08 | 6.13e-01 | 0.0588 |
| 7050 | TGIF1 | HTA11_99999970781_79442 | Human | Colorectum | MSS | 1.69e-27 | 8.83e-01 | 0.294 |
| 7050 | TGIF1 | HTA11_99999965104_69814 | Human | Colorectum | MSS | 7.95e-12 | 7.30e-01 | 0.281 |
| 7050 | TGIF1 | HTA11_99999971662_82457 | Human | Colorectum | MSS | 2.35e-06 | 4.56e-01 | 0.3859 |
| 7050 | TGIF1 | HTA11_99999973899_84307 | Human | Colorectum | MSS | 6.00e-06 | 6.53e-01 | 0.2585 |
| 7050 | TGIF1 | A002-C-116 | Human | Colorectum | FAP | 4.74e-02 | -5.91e-02 | -0.0452 |
| 7050 | TGIF1 | LZE4T | Human | Esophagus | ESCC | 4.60e-03 | 4.31e-02 | 0.0811 |
| 7050 | TGIF1 | LZE7T | Human | Esophagus | ESCC | 4.17e-06 | 1.18e+00 | 0.0667 |
| Page: 1 2 3 4 5 6 7 8 9 10 |
| Tissue | Expression Dynamics | Abbreviation |
| Colorectum (GSE201348) |  | FAP: Familial adenomatous polyposis |
| CRC: Colorectal cancer | ||
| Colorectum (HTA11) |  | AD: Adenomas |
| SER: Sessile serrated lesions | ||
| MSI-H: Microsatellite-high colorectal cancer | ||
| MSS: Microsatellite stable colorectal cancer | ||
| Esophagus | 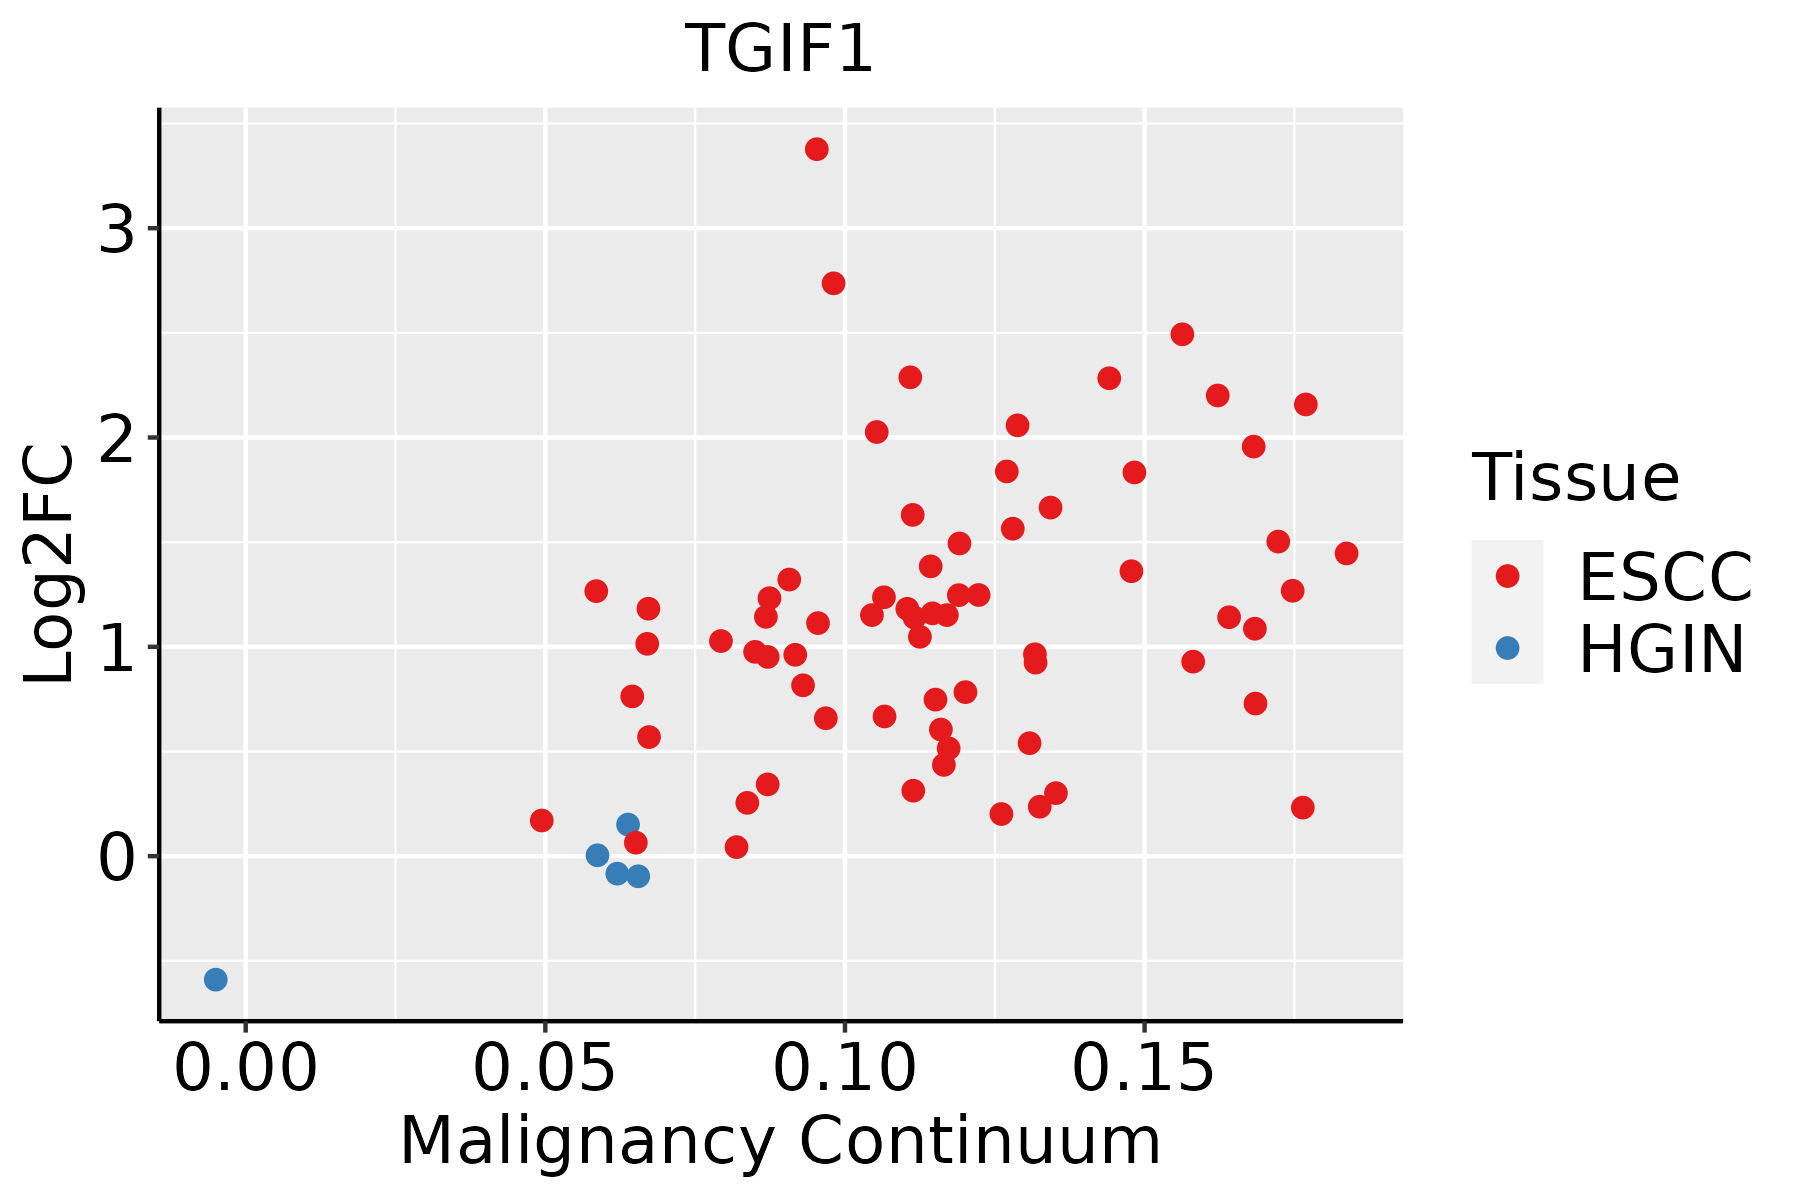 | ESCC: Esophageal squamous cell carcinoma |
| HGIN: High-grade intraepithelial neoplasias | ||
| LGIN: Low-grade intraepithelial neoplasias | ||
| Liver | 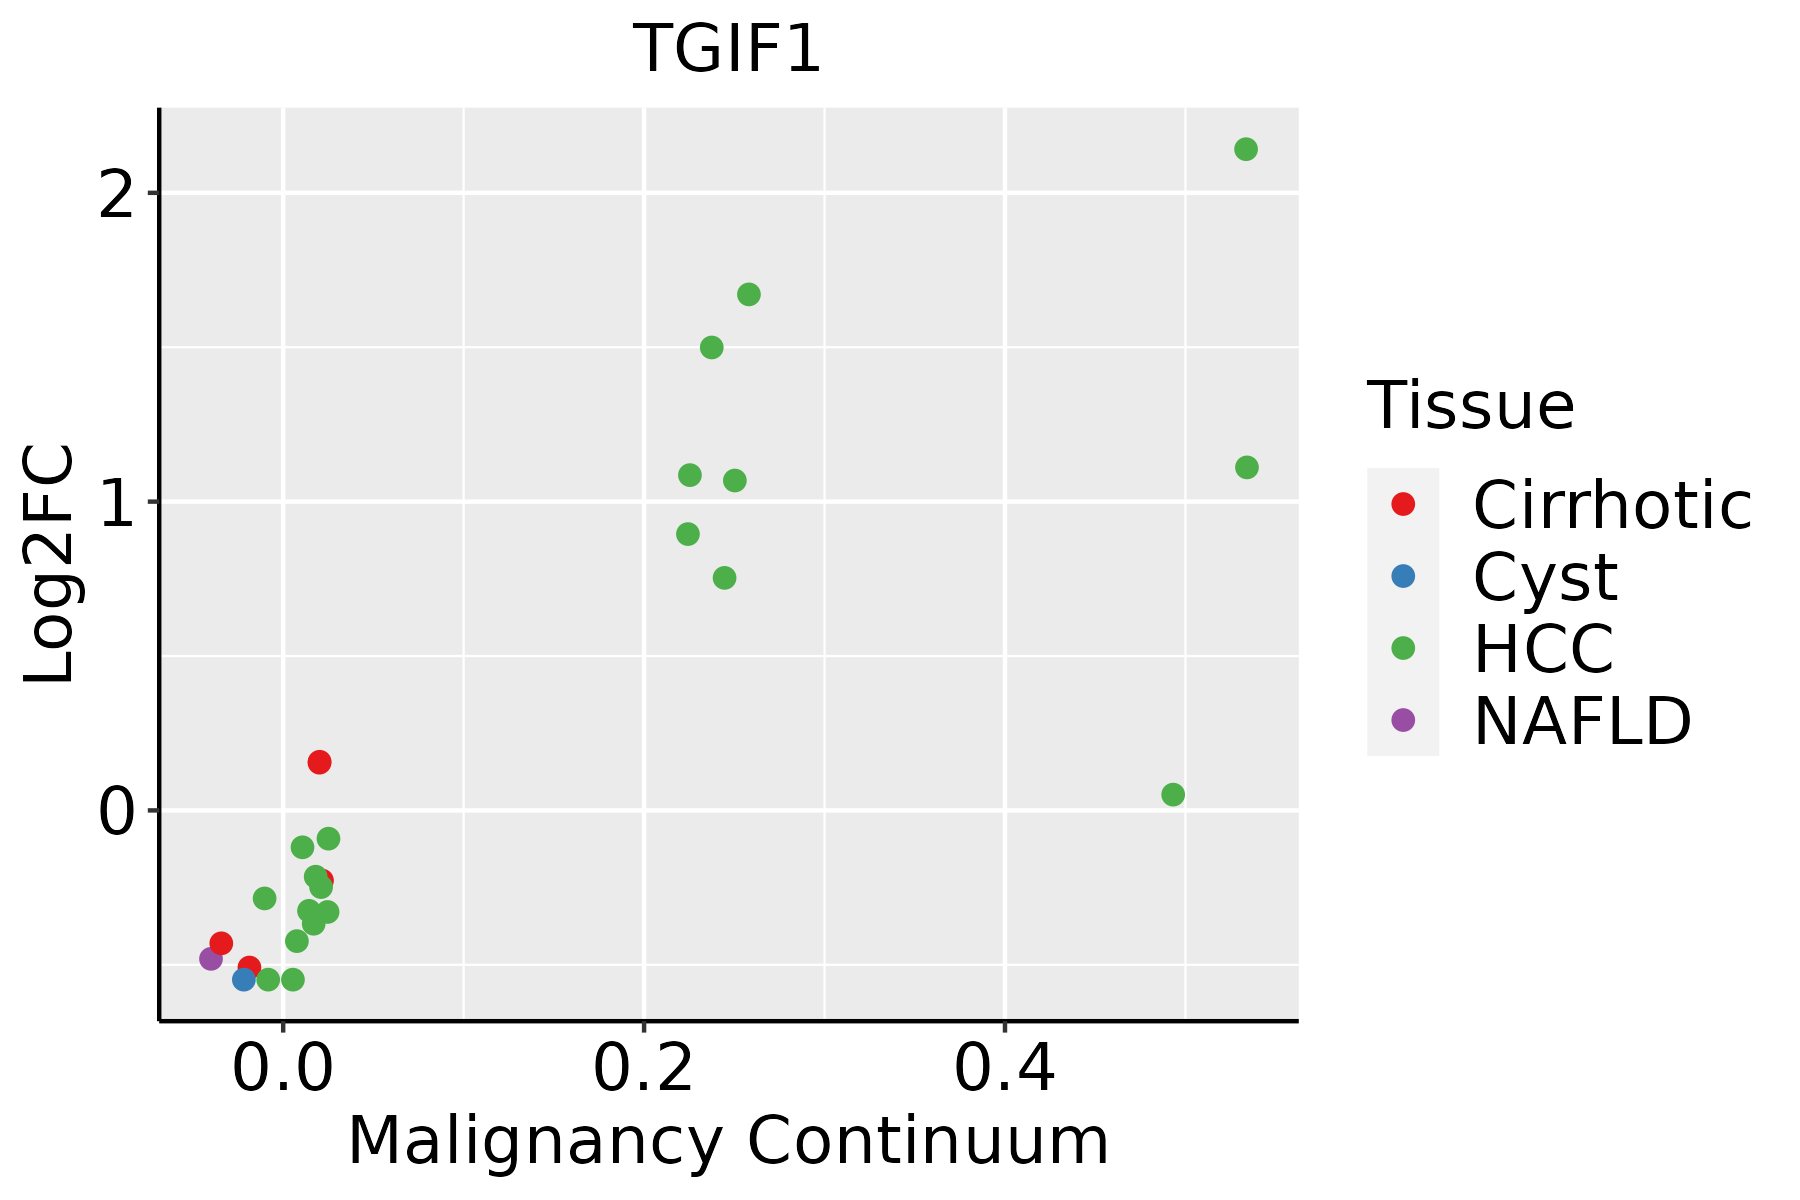 | HCC: Hepatocellular carcinoma |
| NAFLD: Non-alcoholic fatty liver disease | ||
| Lung | 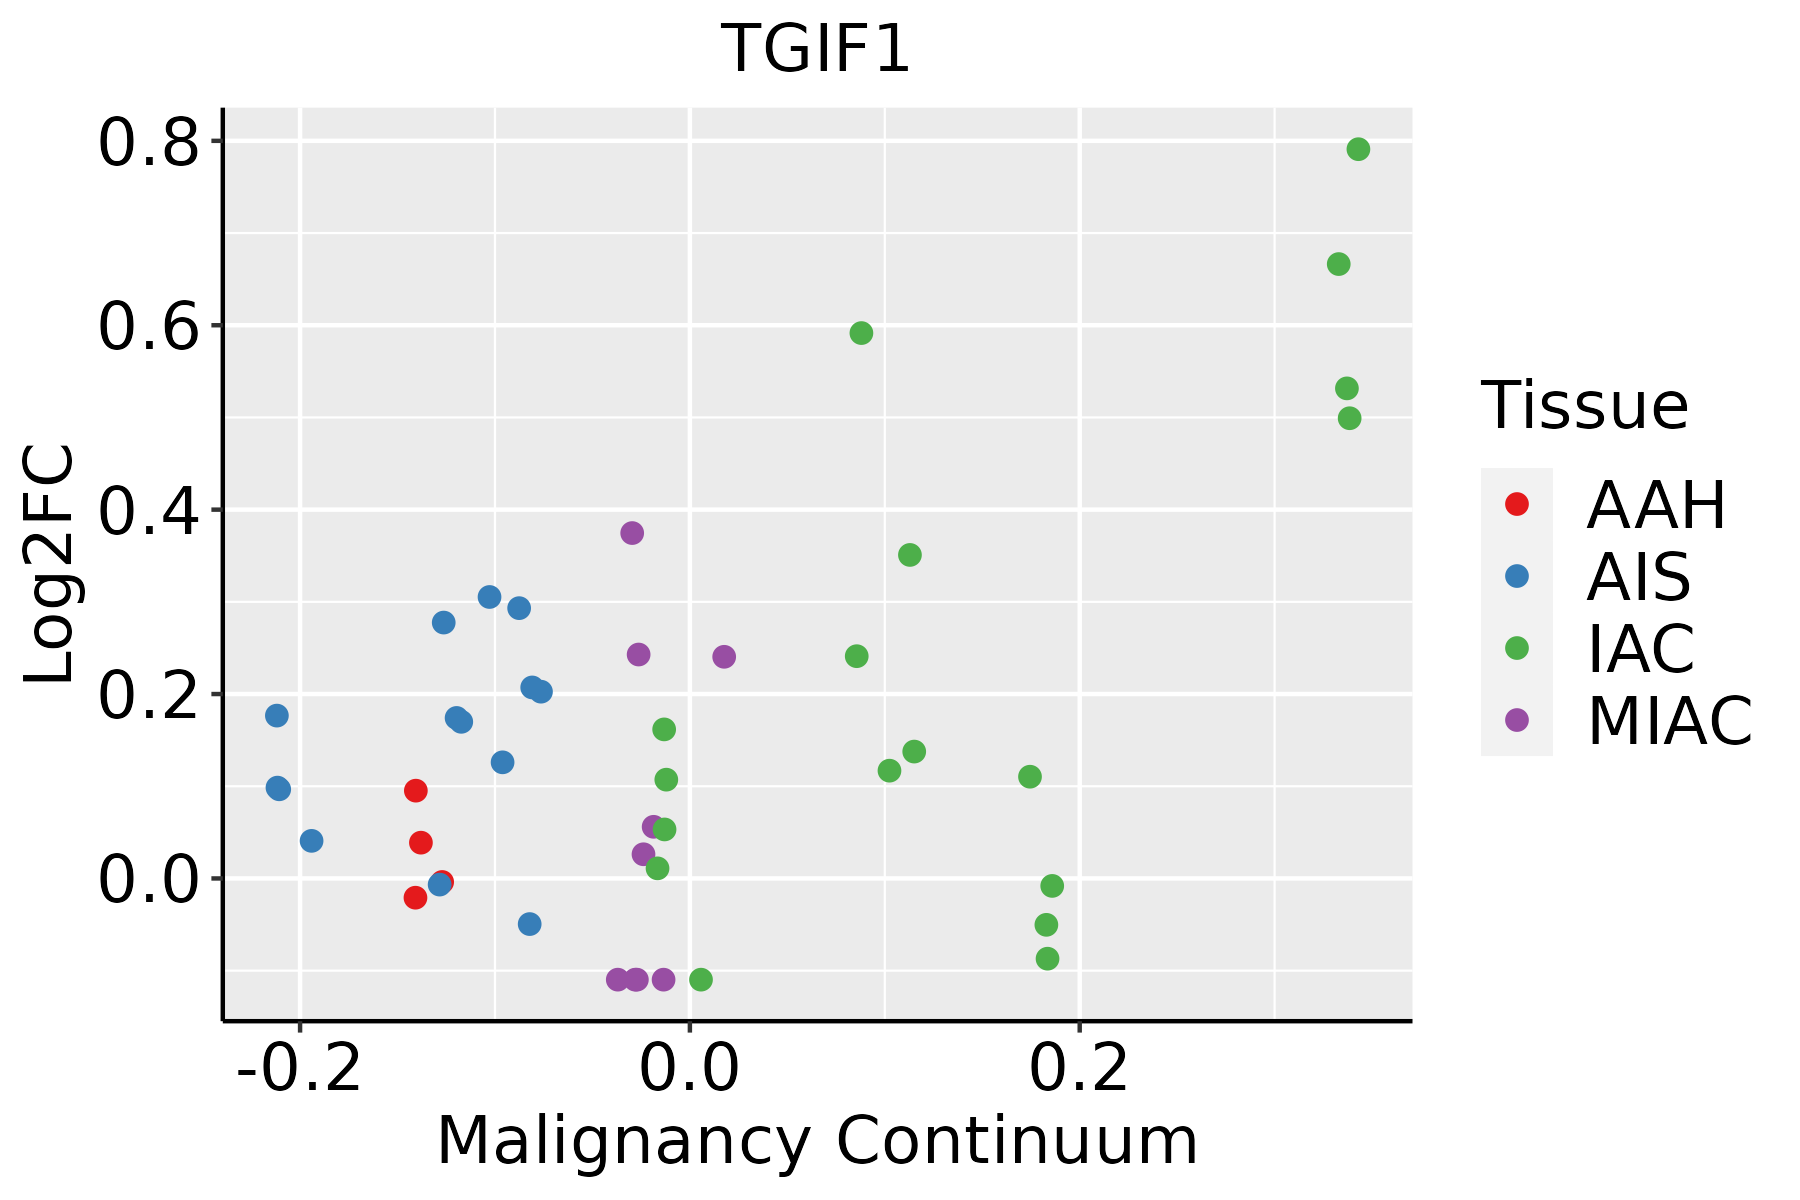 | AAH: Atypical adenomatous hyperplasia |
| AIS: Adenocarcinoma in situ | ||
| IAC: Invasive lung adenocarcinoma | ||
| MIA: Minimally invasive adenocarcinoma | ||
| Oral Cavity | 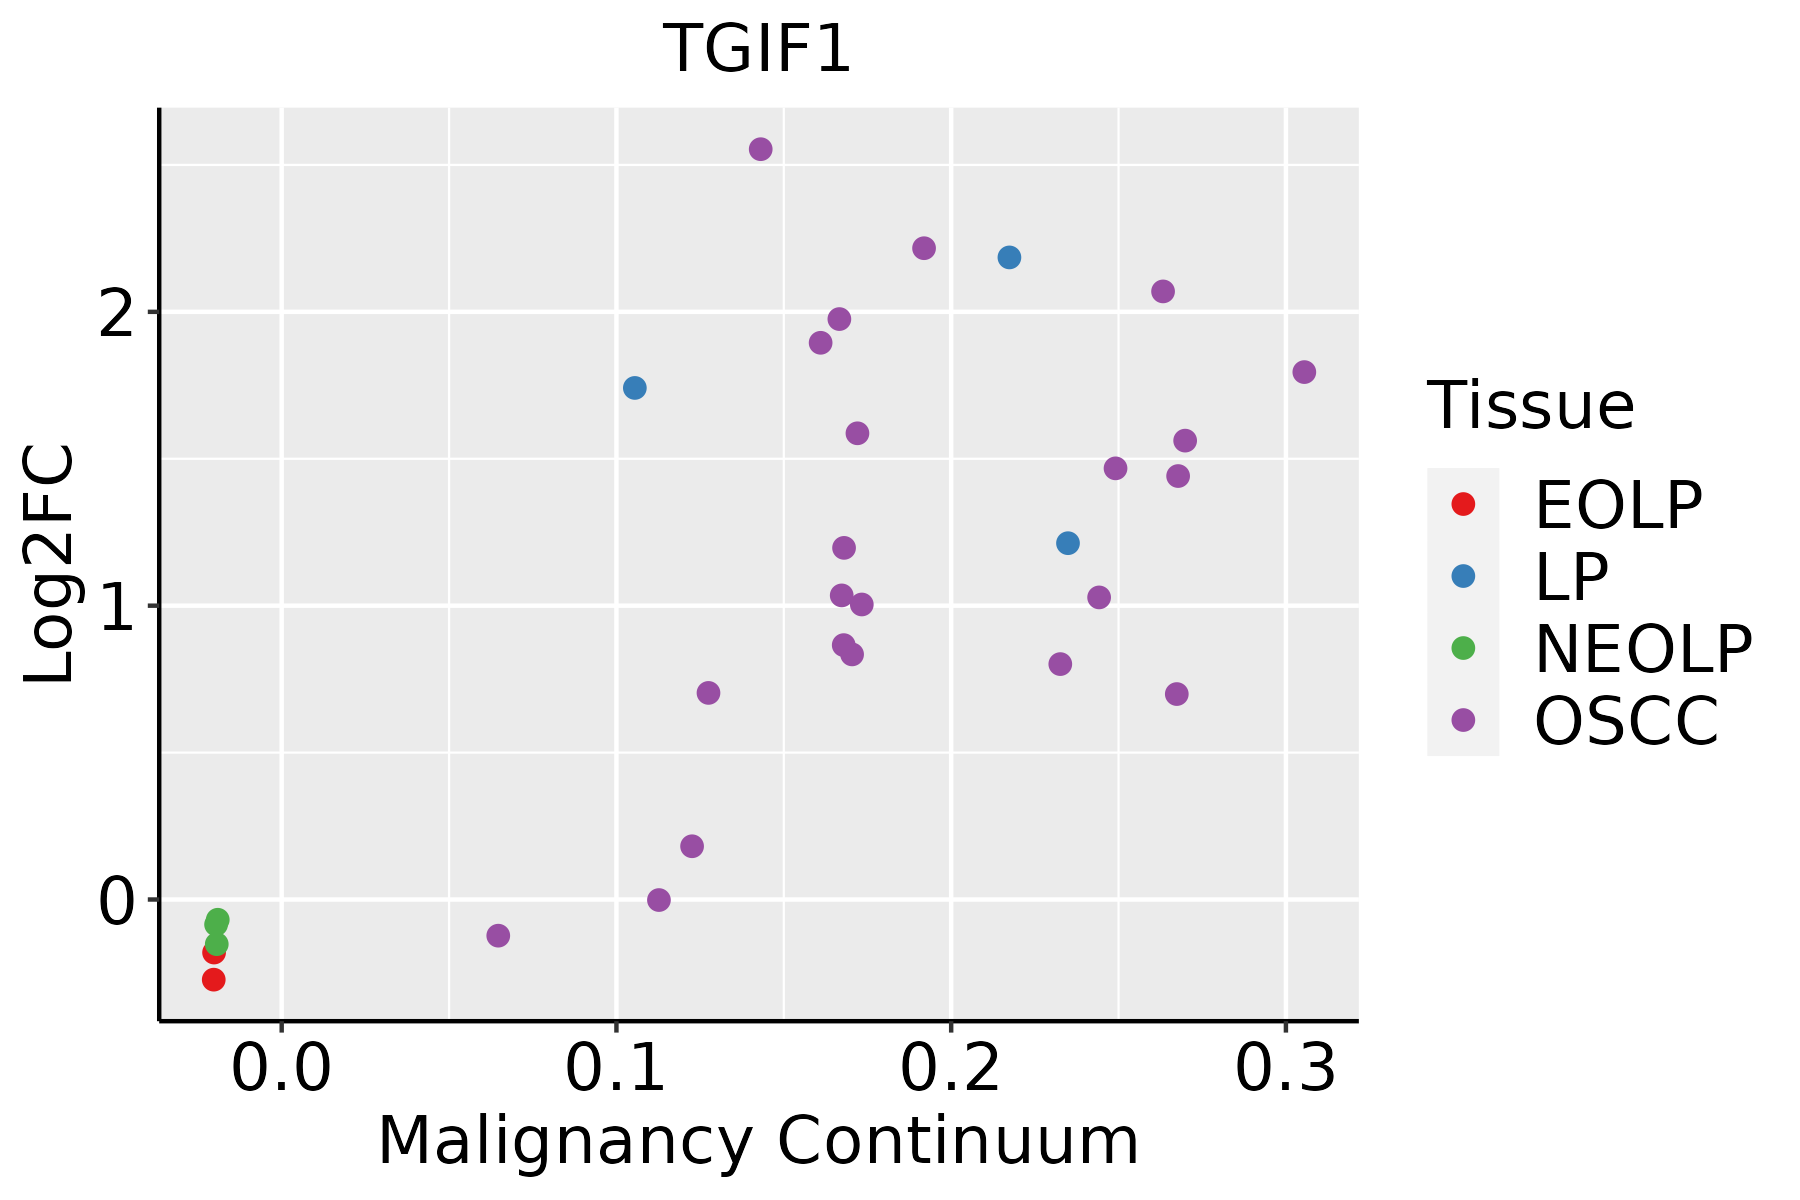 | EOLP: Erosive Oral lichen planus |
| LP: leukoplakia | ||
| NEOLP: Non-erosive oral lichen planus | ||
| OSCC: Oral squamous cell carcinoma | ||
| Prostate |  | BPH: Benign Prostatic Hyperplasia |
| Skin | 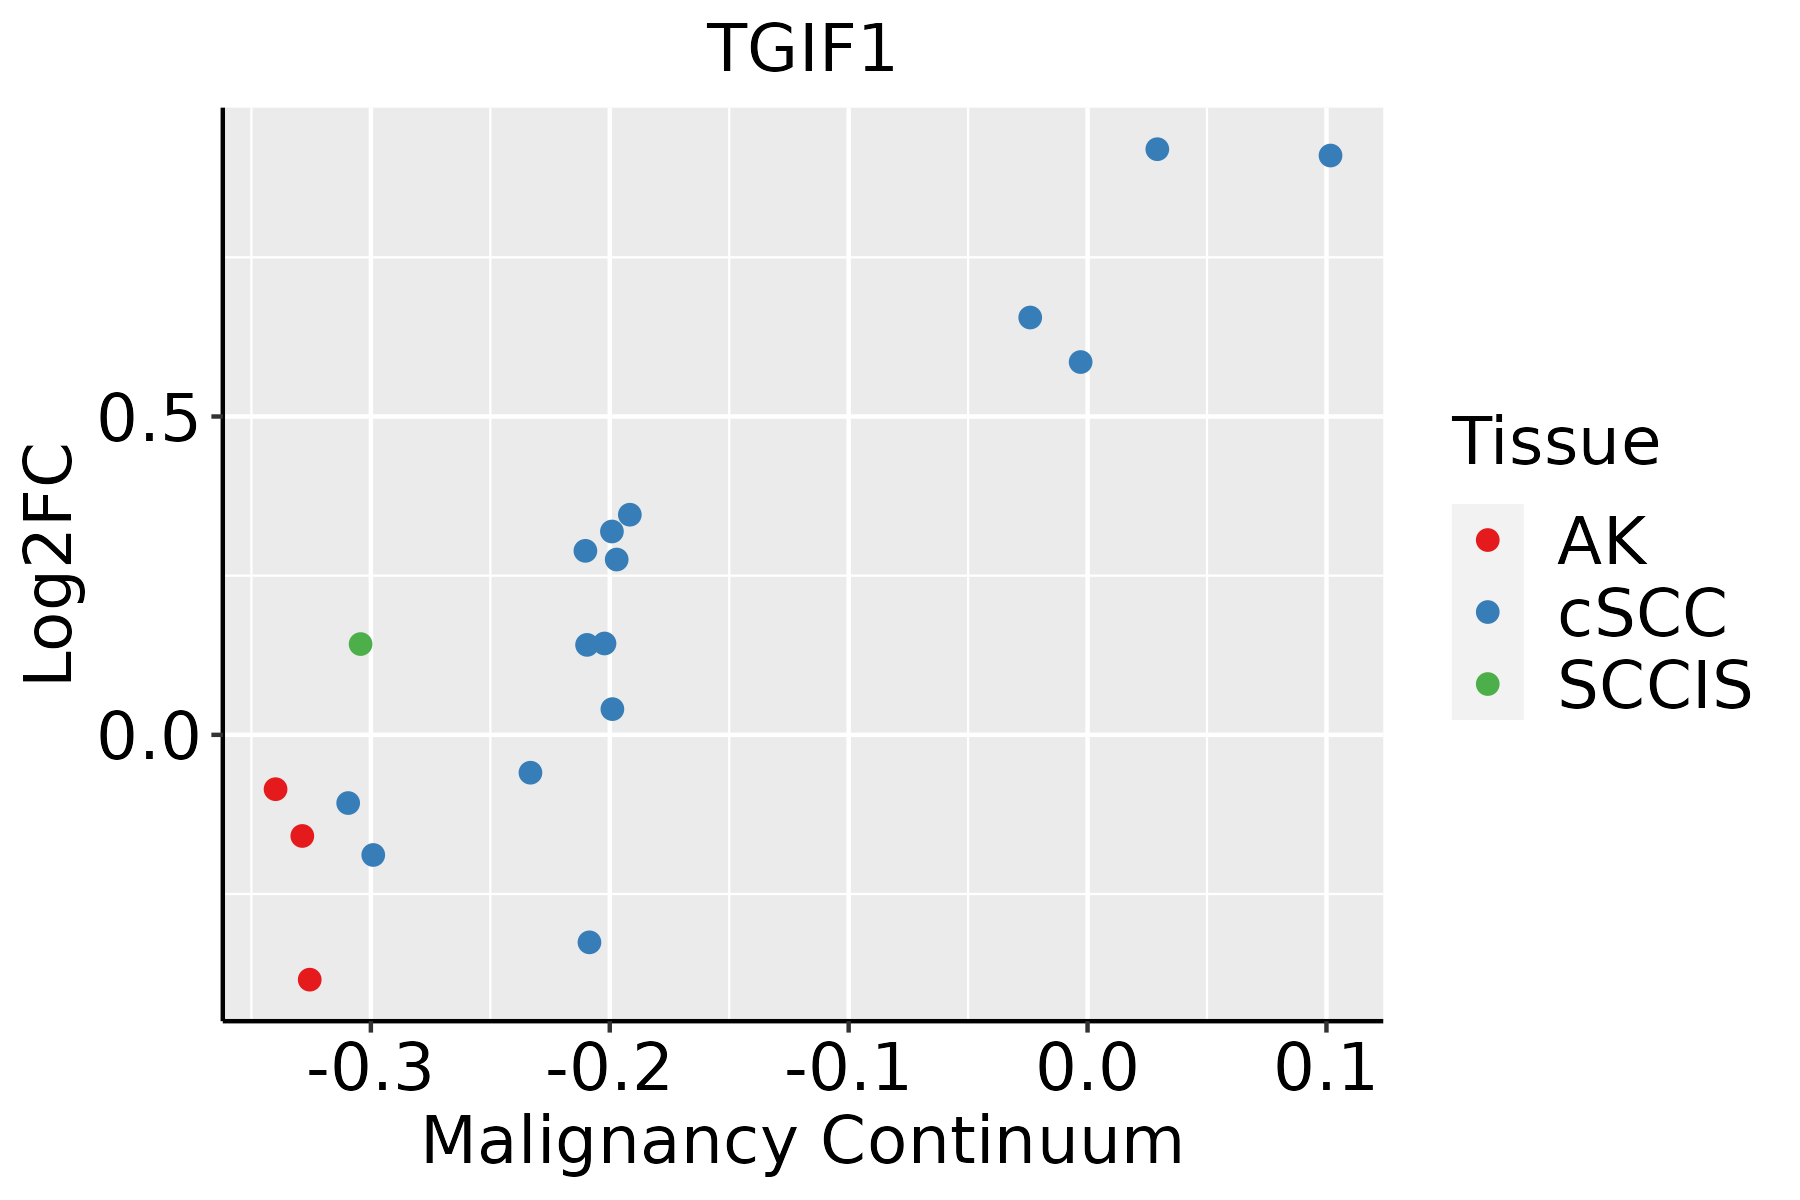 | AK: Actinic keratosis |
| cSCC: Cutaneous squamous cell carcinoma | ||
| SCCIS:squamous cell carcinoma in situ | ||
| Thyroid |  | ATC: Anaplastic thyroid cancer |
| HT: Hashimoto's thyroiditis | ||
| PTC: Papillary thyroid cancer |
| ∗log2FC in expression of this searched gene in stem-like cells from each diseased tissue sample relative to stem-like cells in normal samples in each tissue plotted against the malignancy continuum. Samples are colored based on if they are from different disease stage. |
Top |
Malignant transformation related pathway analysis |
| Find out the enriched GO biological processes and KEGG pathways involved in transition from healthy to precancer to cancer |
| Tissue | Disease Stage | Enriched GO biological Processes |
| Colorectum | AD |  |
| Colorectum | SER |  |
| Colorectum | MSS |  |
| Colorectum | MSI-H |  |
| Colorectum | FAP |  |
| ∗Top 15 enriched GO BP terms are showed in the bar plot of each disease state in each tissue. Each row represents a significant GO biological process which is colored according to the -log10(p.adjust). |
| Page: 1 2 3 4 5 6 7 8 9 |
| GO ID | Tissue | Disease Stage | Description | Gene Ratio | Bg Ratio | pvalue | p.adjust | Count |
| GO:0009410 | Colorectum | AD | response to xenobiotic stimulus | 128/3918 | 462/18723 | 2.69e-04 | 3.31e-03 | 128 |
| GO:00094101 | Colorectum | MSS | response to xenobiotic stimulus | 110/3467 | 462/18723 | 2.36e-03 | 1.92e-02 | 110 |
| GO:00094102 | Colorectum | FAP | response to xenobiotic stimulus | 87/2622 | 462/18723 | 2.15e-03 | 1.77e-02 | 87 |
| GO:000941020 | Esophagus | ESCC | response to xenobiotic stimulus | 253/8552 | 462/18723 | 4.55e-05 | 3.58e-04 | 253 |
| GO:000941012 | Liver | Cirrhotic | response to xenobiotic stimulus | 165/4634 | 462/18723 | 6.82e-08 | 2.09e-06 | 165 |
| GO:000941022 | Liver | HCC | response to xenobiotic stimulus | 248/7958 | 462/18723 | 6.47e-07 | 1.02e-05 | 248 |
| GO:000941018 | Oral cavity | OSCC | response to xenobiotic stimulus | 222/7305 | 462/18723 | 4.00e-05 | 3.48e-04 | 222 |
| GO:000941019 | Oral cavity | LP | response to xenobiotic stimulus | 141/4623 | 462/18723 | 2.33e-03 | 1.68e-02 | 141 |
| GO:000941016 | Prostate | BPH | response to xenobiotic stimulus | 106/3107 | 462/18723 | 2.24e-04 | 1.79e-03 | 106 |
| GO:000941017 | Prostate | Tumor | response to xenobiotic stimulus | 110/3246 | 462/18723 | 2.13e-04 | 1.84e-03 | 110 |
| GO:000941025 | Skin | AK | response to xenobiotic stimulus | 67/1910 | 462/18723 | 1.98e-03 | 1.34e-02 | 67 |
| GO:0009410110 | Skin | cSCC | response to xenobiotic stimulus | 151/4864 | 462/18723 | 6.76e-04 | 4.82e-03 | 151 |
| GO:0009410111 | Thyroid | PTC | response to xenobiotic stimulus | 171/5968 | 462/18723 | 1.00e-02 | 4.07e-02 | 171 |
| GO:000941027 | Thyroid | ATC | response to xenobiotic stimulus | 184/6293 | 462/18723 | 2.70e-03 | 1.23e-02 | 184 |
| Page: 1 |
| Pathway ID | Tissue | Disease Stage | Description | Gene Ratio | Bg Ratio | pvalue | p.adjust | qvalue | Count |
| hsa043507 | Esophagus | ESCC | TGF-beta signaling pathway | 69/4205 | 108/8465 | 1.92e-03 | 5.54e-03 | 2.84e-03 | 69 |
| hsa0435014 | Esophagus | ESCC | TGF-beta signaling pathway | 69/4205 | 108/8465 | 1.92e-03 | 5.54e-03 | 2.84e-03 | 69 |
| hsa043506 | Oral cavity | OSCC | TGF-beta signaling pathway | 60/3704 | 108/8465 | 8.66e-03 | 1.97e-02 | 1.00e-02 | 60 |
| hsa0435013 | Oral cavity | OSCC | TGF-beta signaling pathway | 60/3704 | 108/8465 | 8.66e-03 | 1.97e-02 | 1.00e-02 | 60 |
| hsa043505 | Prostate | BPH | TGF-beta signaling pathway | 35/1718 | 108/8465 | 1.98e-03 | 7.92e-03 | 4.90e-03 | 35 |
| hsa0435012 | Prostate | BPH | TGF-beta signaling pathway | 35/1718 | 108/8465 | 1.98e-03 | 7.92e-03 | 4.90e-03 | 35 |
| hsa0435021 | Prostate | Tumor | TGF-beta signaling pathway | 39/1791 | 108/8465 | 2.33e-04 | 1.35e-03 | 8.39e-04 | 39 |
| hsa0435031 | Prostate | Tumor | TGF-beta signaling pathway | 39/1791 | 108/8465 | 2.33e-04 | 1.35e-03 | 8.39e-04 | 39 |
| Page: 1 |
Top |
Cell-cell communication analysis |
| Identification of potential cell-cell interactions between two cell types and their ligand-receptor pairs for different disease states |
| Ligand | Receptor | LRpair | Pathway | Tissue | Disease Stage |
| Page: 1 |
Top |
Single-cell gene regulatory network inference analysis |
| Find out the significant the regulons (TFs) and the target genes of each regulon across cell types for different disease states |
| TF | Cell Type | Tissue | Disease Stage | Target Gene | RSS | Regulon Activity |
| TGIF1 | IMGOB | Colorectum | CRC | IFT81,CDCA2,ESS2, etc. | 0.00e+00 |  |
| TGIF1 | EE | Colorectum | CRC | IFT81,CDCA2,ESS2, etc. | 0.00e+00 | |
| TGIF1 | CT | Colorectum | CRC | IFT81,CDCA2,ESS2, etc. | 0.00e+00 | |
| TGIF1 | SSC | Colorectum | CRC | IFT81,CDCA2,ESS2, etc. | 2.22e-16 | |
| TGIF1 | CT | Colorectum | FAP | IFT81,CDCA2,ESS2, etc. | 4.02e-03 |  |
| TGIF1 | EE | Colorectum | FAP | IFT81,CDCA2,ESS2, etc. | 1.30e-03 | |
| TGIF1 | SSC | Colorectum | FAP | IFT81,CDCA2,ESS2, etc. | 0.00e+00 | |
| TGIF1 | END | Liver | Cirrhotic | APOD,FABP5,RP11-511P7.5, etc. | 1.96e-03 |  |
| TGIF1 | END | Liver | Healthy | APOD,FABP5,RP11-511P7.5, etc. | 1.44e-02 |  |
| TGIF1 | MVA | Liver | NAFLD | APOD,FABP5,RP11-511P7.5, etc. | 6.00e-02 |  |
| ∗The dot plots of a searched regulon are shown for all cell subpopulations in each disease state of each tissue based on the regulon specific score inferred using pySCENIC and by calculating the average expression. |
| Page: 1 2 |
Top |
Somatic mutation of malignant transformation related genes |
| Annotation of somatic variants for genes involved in malignant transformation |
| Hugo Symbol | Variant Class | Variant Classification | dbSNP RS | HGVSc | HGVSp | HGVSp Short | SWISSPROT | BIOTYPE | SIFT | PolyPhen | Tumor Sample Barcode | Tissue | Histology | Sex | Age | Stage | Therapy Types | Drugs | Outcome |
| TGIF1 | SNV | Missense_Mutation | novel | c.683N>T | p.Arg228Ile | p.R228I | Q15583 | protein_coding | deleterious(0) | possibly_damaging(0.773) | TCGA-AN-A046-01 | Breast | breast invasive carcinoma | Female | >=65 | I/II | Unknown | Unknown | SD |
| TGIF1 | insertion | Nonsense_Mutation | novel | c.945_946insGGTCAGGAAACTTGTTGAGTTAAATT | p.Ser316GlyfsTer6 | p.S316Gfs*6 | Q15583 | protein_coding | TCGA-A2-A0CT-01 | Breast | breast invasive carcinoma | Female | >=65 | I/II | Chemotherapy | cytoxan | SD | ||
| TGIF1 | deletion | Frame_Shift_Del | c.548_593delTGTATGAGCACCGTTACAATGCCTATCCTTCAGAGCAAGAAAAAGC | p.Leu183ArgfsTer30 | p.L183Rfs*30 | Q15583 | protein_coding | TCGA-BH-A0AZ-01 | Breast | breast invasive carcinoma | Female | <65 | III/IV | Chemotherapy | doxorubicin | CR | |||
| TGIF1 | SNV | Missense_Mutation | c.433N>C | p.Glu145Gln | p.E145Q | Q15583 | protein_coding | deleterious_low_confidence(0.03) | benign(0.052) | TCGA-DR-A0ZM-01 | Cervix | cervical & endocervical cancer | Female | <65 | III/IV | Unspecific | Cisplatin | SD | |
| TGIF1 | SNV | Missense_Mutation | c.410T>G | p.Val137Gly | p.V137G | Q15583 | protein_coding | tolerated_low_confidence(0.08) | benign(0.138) | TCGA-MU-A51Y-01 | Cervix | cervical & endocervical cancer | Female | <65 | I/II | Unknown | Unknown | SD | |
| TGIF1 | SNV | Missense_Mutation | c.634N>G | p.Cys212Gly | p.C212G | Q15583 | protein_coding | deleterious(0) | probably_damaging(0.928) | TCGA-G4-6298-01 | Colorectum | colon adenocarcinoma | Male | >=65 | III/IV | Chemotherapy | irinotecan | PD | |
| TGIF1 | SNV | Missense_Mutation | c.535N>A | p.Leu179Ile | p.L179I | Q15583 | protein_coding | deleterious(0) | probably_damaging(0.988) | TCGA-EI-6917-01 | Colorectum | rectum adenocarcinoma | Male | <65 | III/IV | Chemotherapy | 5fluorouracil+oxaciplatina+l-folinian | SD | |
| TGIF1 | SNV | Missense_Mutation | novel | c.124N>C | p.Phe42Leu | p.F42L | Q15583 | protein_coding | tolerated_low_confidence(0.16) | benign(0) | TCGA-F5-6814-01 | Colorectum | rectum adenocarcinoma | Male | <65 | I/II | Unknown | Unknown | SD |
| TGIF1 | insertion | Frame_Shift_Ins | novel | c.864_865insCCGT | p.Ser291ValfsTer61 | p.S291Vfs*61 | Q15583 | protein_coding | TCGA-A6-2684-01 | Colorectum | colon adenocarcinoma | Female | >=65 | I/II | Unknown | Unknown | PD | ||
| TGIF1 | insertion | Frame_Shift_Ins | novel | c.449_450insG | p.Asp151GlyfsTer35 | p.D151Gfs*35 | Q15583 | protein_coding | TCGA-A6-3808-01 | Colorectum | colon adenocarcinoma | Male | >=65 | I/II | Unknown | Unknown | SD |
| Page: 1 2 3 4 5 |
Top |
Related drugs of malignant transformation related genes |
| Identification of chemicals and drugs interact with genes involved in malignant transfromation |
| (DGIdb 4.0) |
| Entrez ID | Symbol | Category | Interaction Types | Drug Claim Name | Drug Name | PMIDs |
| Page: 1 |

Copyright 2023-Present -The University of Texas Health Science Center at Houston |