
|
|||||
|
 | |
| |
| |
| |
| |
| |
|
Gene: TGFBR1 |
Gene summary for TGFBR1 |
| Gene information | Species | Human | Gene symbol | TGFBR1 | Gene ID | 7046 |
| Gene name | transforming growth factor beta receptor 1 | |
| Gene Alias | AAT5 | |
| Cytomap | 9q22.33 | |
| Gene Type | protein-coding | GO ID | GO:0000003 | UniProtAcc | B4DXN7 |
Top |
Malignant transformation analysis |
| Identification of the aberrant gene expression in precancerous and cancerous lesions by comparing the gene expression of stem-like cells in diseased tissues with normal stem cells |
| Entrez ID | Symbol | Replicates | Species | Organ | Tissue | Adj P-value | Log2FC | Malignancy |
| 7046 | TGFBR1 | LZE24T | Human | Esophagus | ESCC | 4.74e-08 | 1.77e-01 | 0.0596 |
| 7046 | TGFBR1 | LZE6T | Human | Esophagus | ESCC | 1.21e-02 | 4.88e-02 | 0.0845 |
| 7046 | TGFBR1 | P2T-E | Human | Esophagus | ESCC | 1.52e-16 | 1.90e-01 | 0.1177 |
| 7046 | TGFBR1 | P4T-E | Human | Esophagus | ESCC | 9.11e-08 | 1.85e-01 | 0.1323 |
| 7046 | TGFBR1 | P5T-E | Human | Esophagus | ESCC | 2.03e-02 | -1.02e-01 | 0.1327 |
| 7046 | TGFBR1 | P8T-E | Human | Esophagus | ESCC | 1.88e-08 | -4.69e-02 | 0.0889 |
| 7046 | TGFBR1 | P9T-E | Human | Esophagus | ESCC | 2.58e-06 | 5.10e-02 | 0.1131 |
| 7046 | TGFBR1 | P10T-E | Human | Esophagus | ESCC | 6.54e-07 | -6.99e-02 | 0.116 |
| 7046 | TGFBR1 | P11T-E | Human | Esophagus | ESCC | 1.55e-06 | 3.48e-01 | 0.1426 |
| 7046 | TGFBR1 | P12T-E | Human | Esophagus | ESCC | 2.28e-12 | 1.29e-01 | 0.1122 |
| 7046 | TGFBR1 | P15T-E | Human | Esophagus | ESCC | 7.77e-03 | -2.72e-02 | 0.1149 |
| 7046 | TGFBR1 | P16T-E | Human | Esophagus | ESCC | 2.12e-10 | -1.11e-01 | 0.1153 |
| 7046 | TGFBR1 | P20T-E | Human | Esophagus | ESCC | 1.69e-06 | -2.44e-02 | 0.1124 |
| 7046 | TGFBR1 | P21T-E | Human | Esophagus | ESCC | 7.04e-29 | 5.00e-01 | 0.1617 |
| 7046 | TGFBR1 | P22T-E | Human | Esophagus | ESCC | 6.89e-08 | -8.27e-02 | 0.1236 |
| 7046 | TGFBR1 | P23T-E | Human | Esophagus | ESCC | 3.53e-06 | -9.41e-03 | 0.108 |
| 7046 | TGFBR1 | P24T-E | Human | Esophagus | ESCC | 1.29e-09 | 4.93e-02 | 0.1287 |
| 7046 | TGFBR1 | P26T-E | Human | Esophagus | ESCC | 1.16e-13 | 9.29e-04 | 0.1276 |
| 7046 | TGFBR1 | P27T-E | Human | Esophagus | ESCC | 4.33e-17 | -5.84e-02 | 0.1055 |
| 7046 | TGFBR1 | P28T-E | Human | Esophagus | ESCC | 1.23e-16 | 2.34e-01 | 0.1149 |
| Page: 1 2 3 4 5 |
| Tissue | Expression Dynamics | Abbreviation |
| Esophagus | 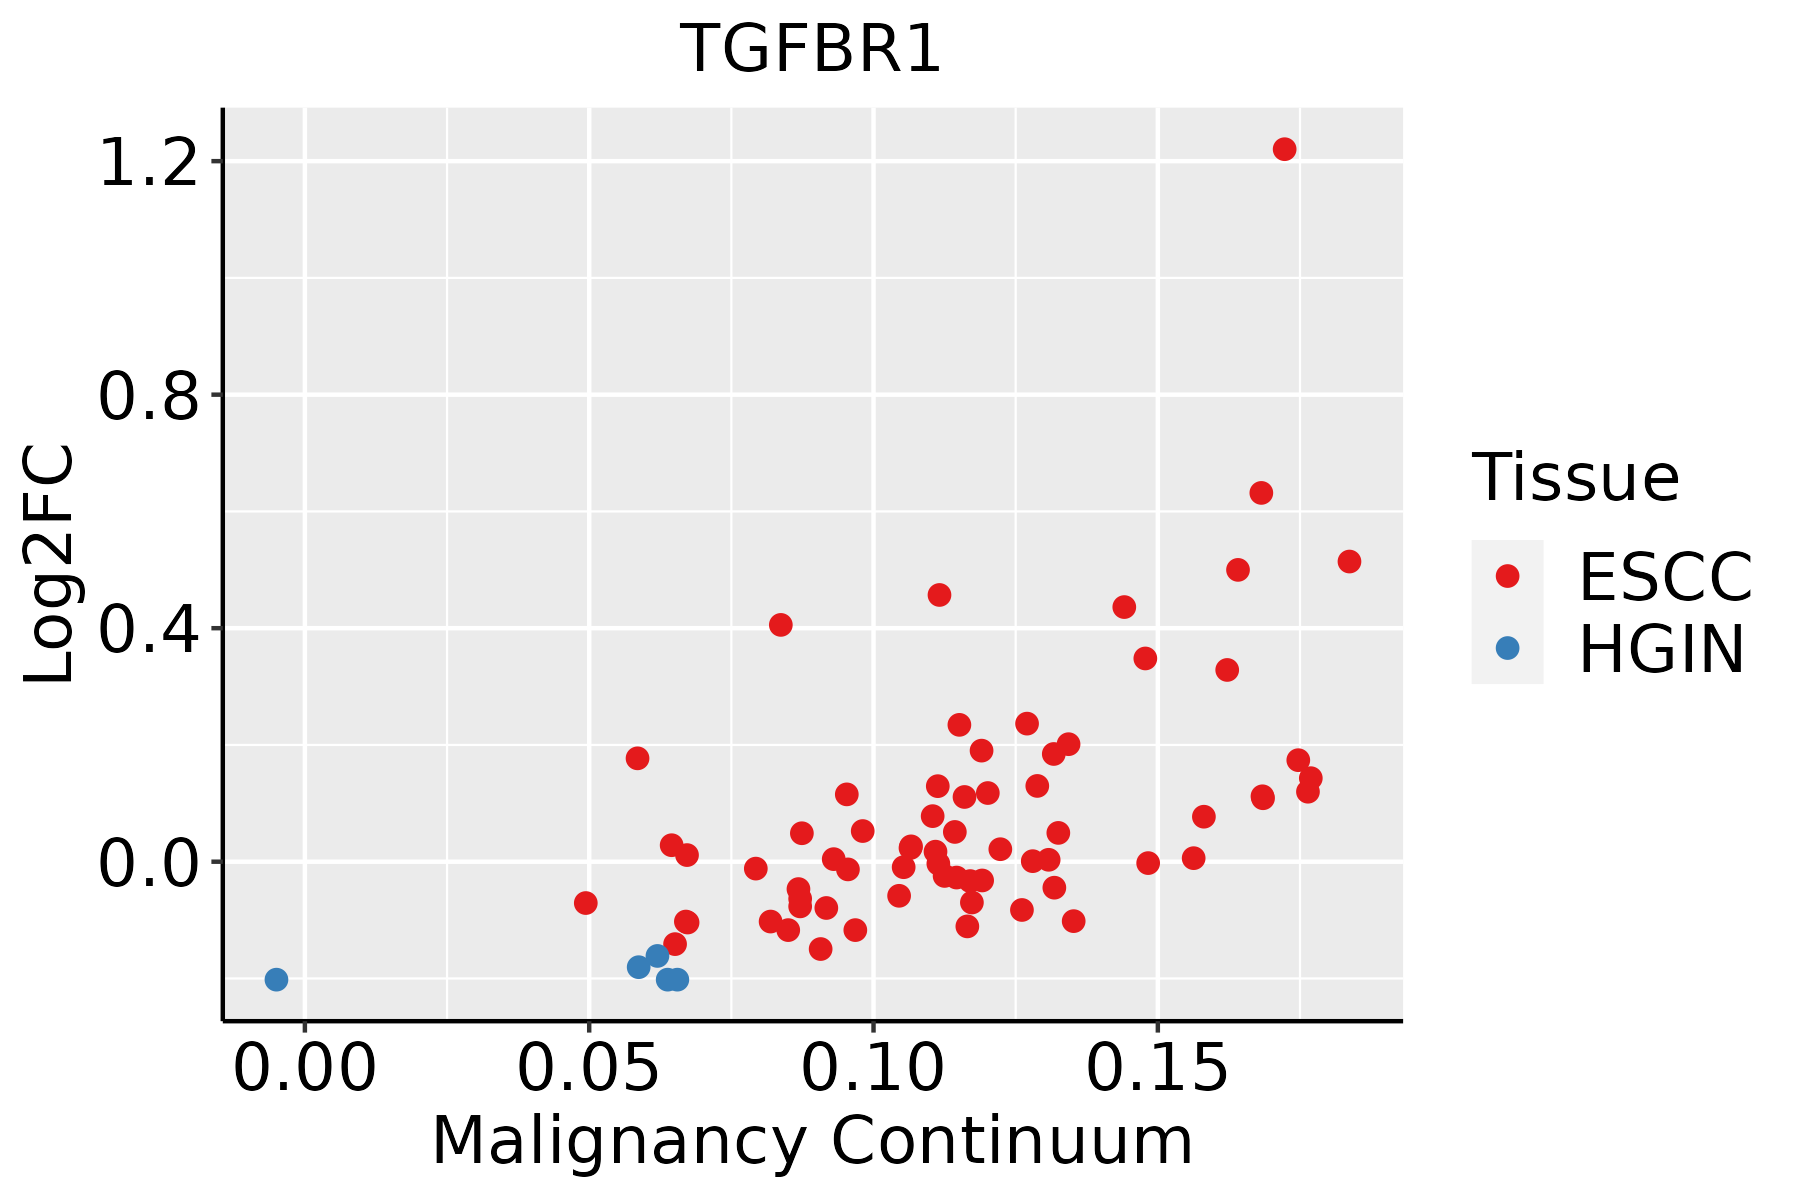 | ESCC: Esophageal squamous cell carcinoma |
| HGIN: High-grade intraepithelial neoplasias | ||
| LGIN: Low-grade intraepithelial neoplasias | ||
| Liver | 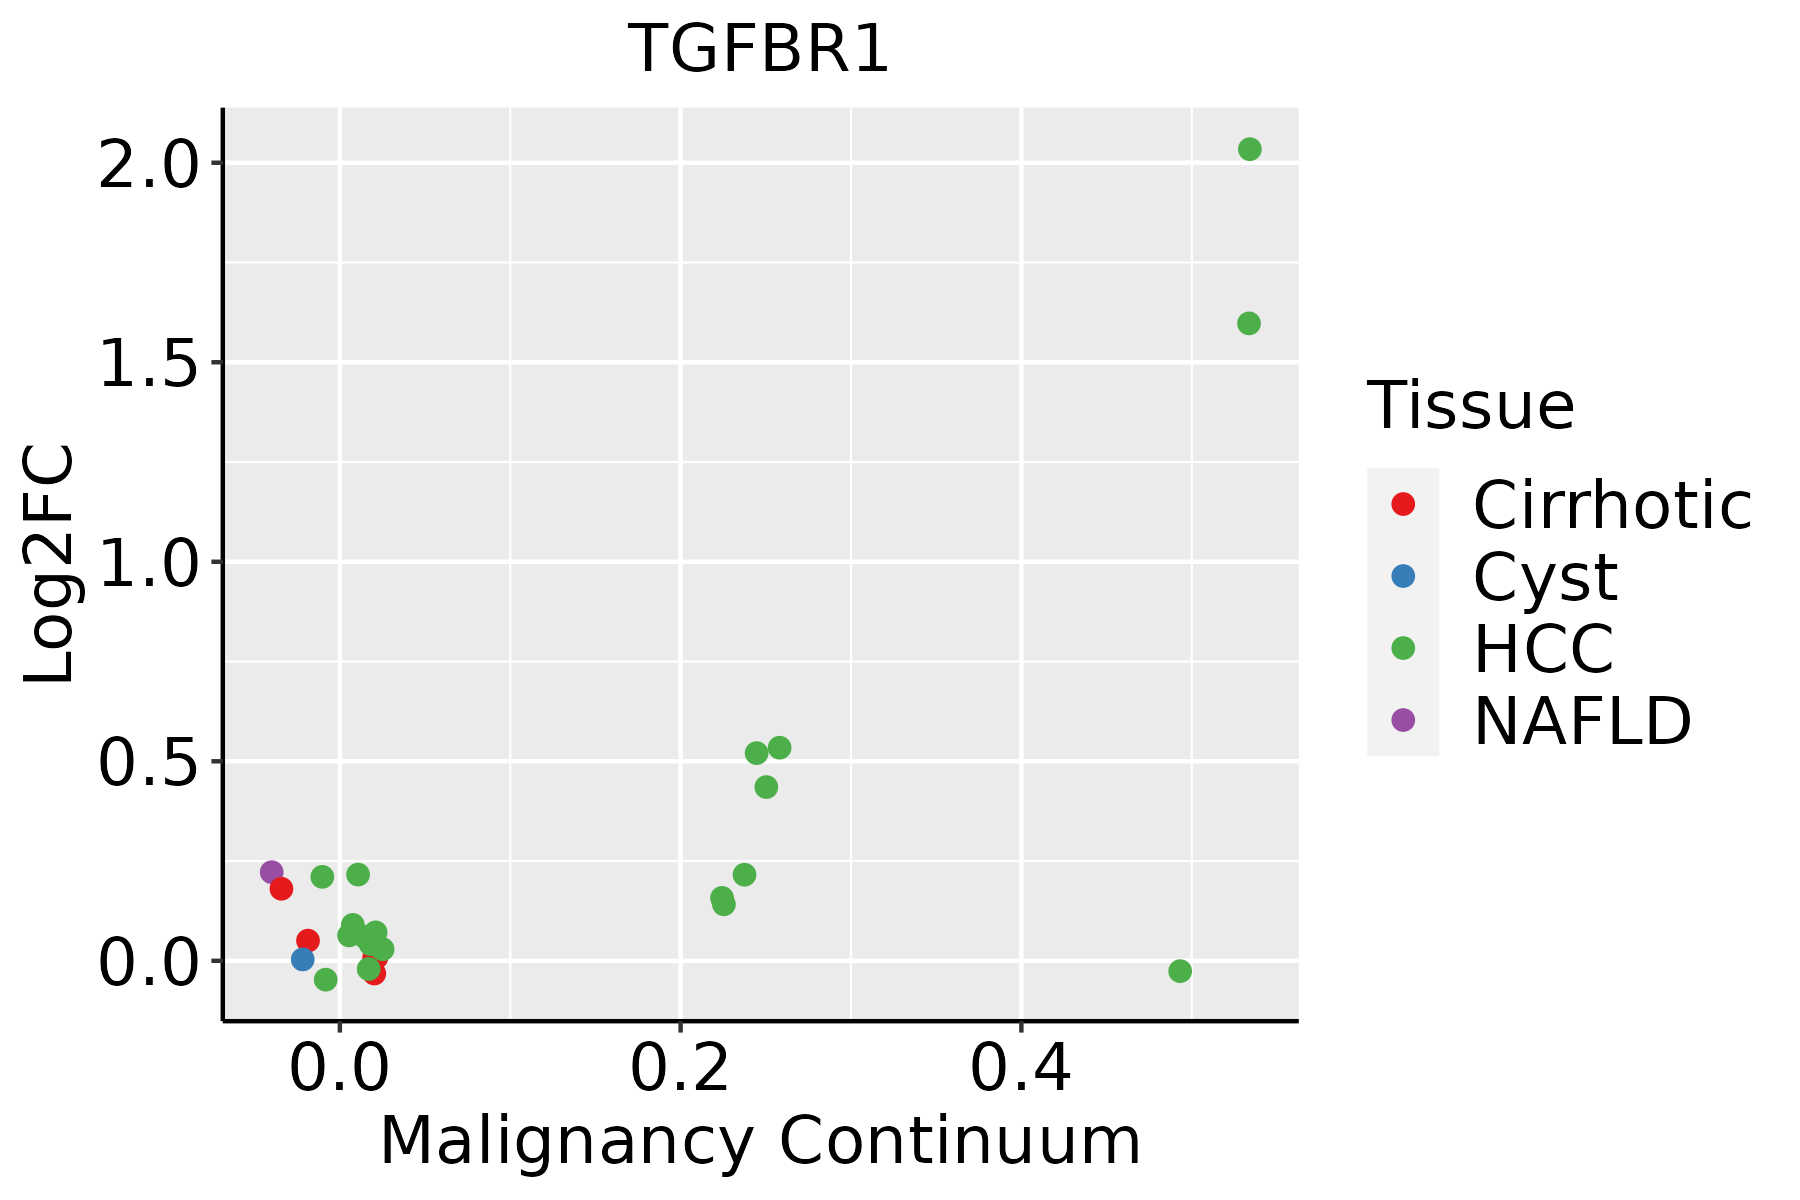 | HCC: Hepatocellular carcinoma |
| NAFLD: Non-alcoholic fatty liver disease | ||
| Oral Cavity | 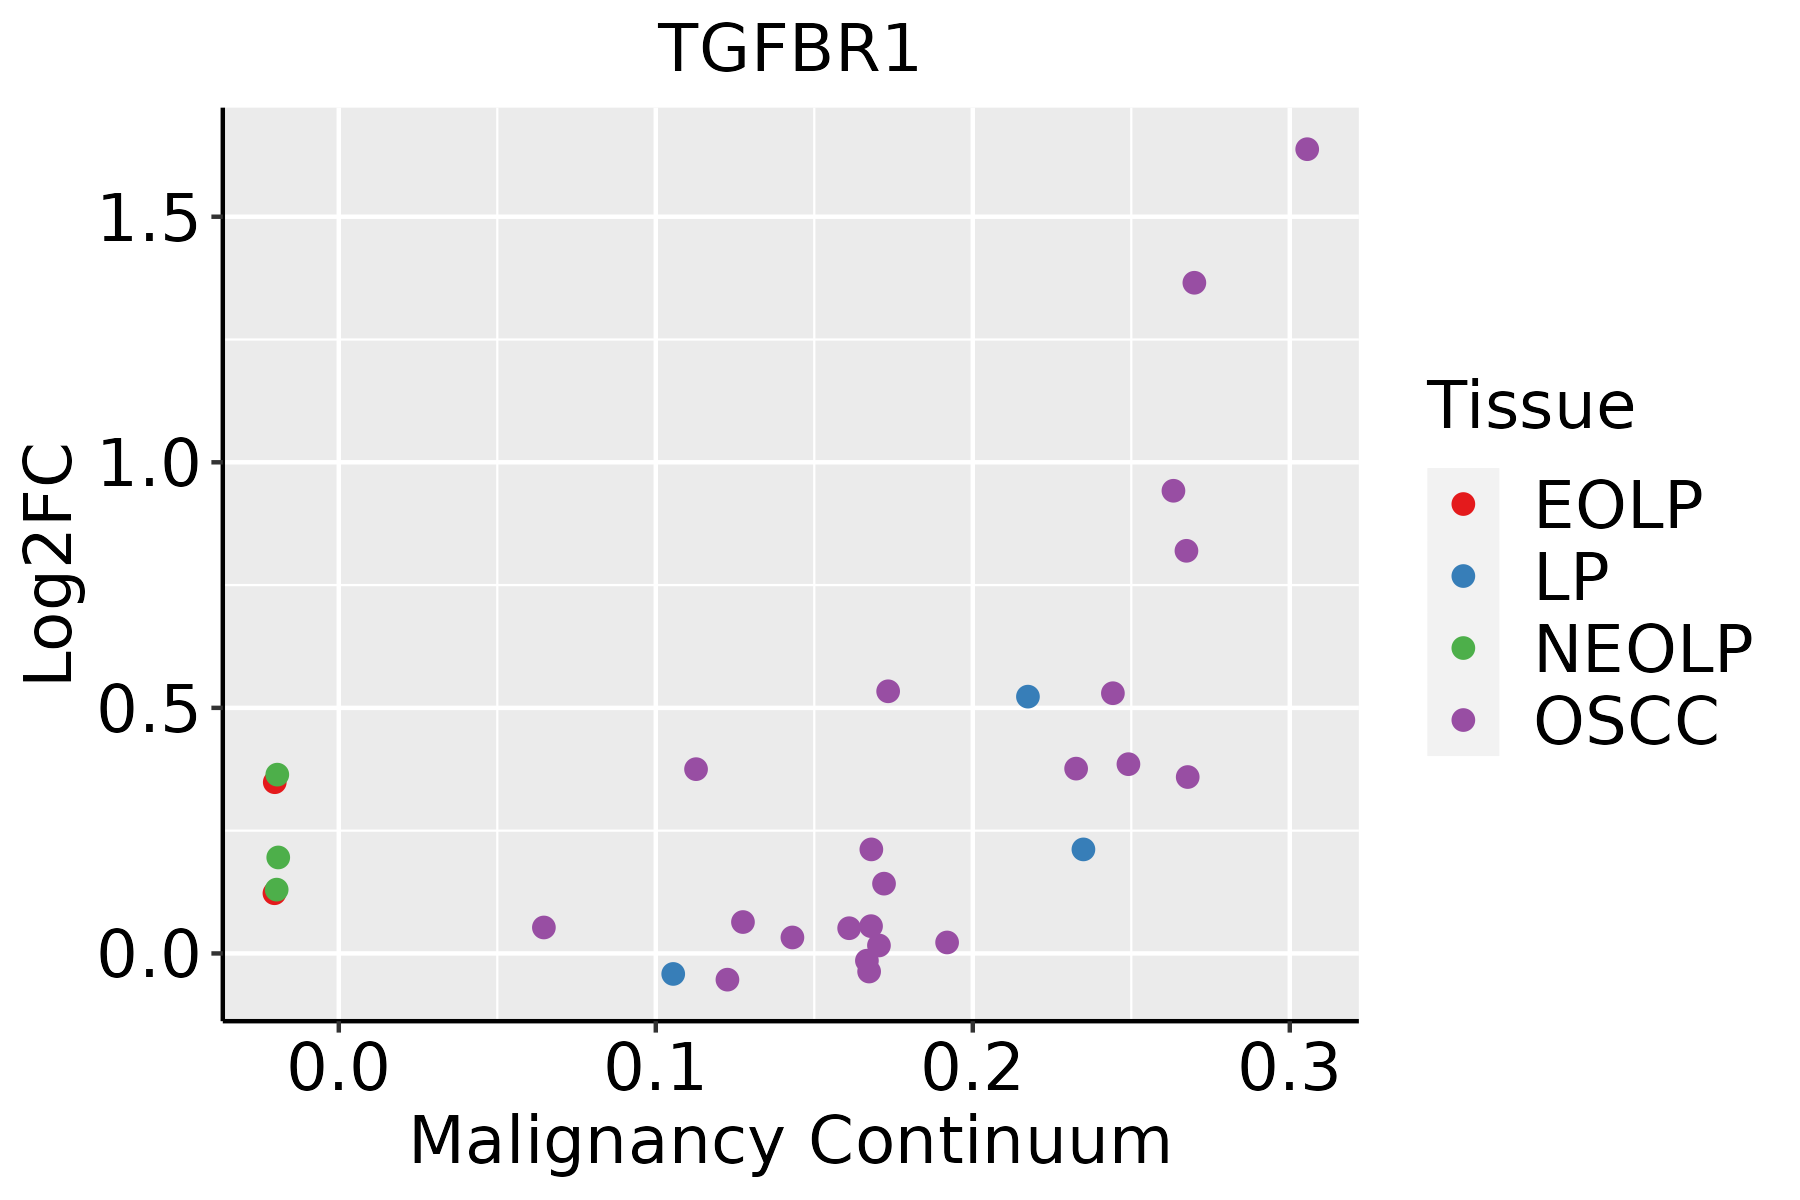 | EOLP: Erosive Oral lichen planus |
| LP: leukoplakia | ||
| NEOLP: Non-erosive oral lichen planus | ||
| OSCC: Oral squamous cell carcinoma | ||
| Skin | 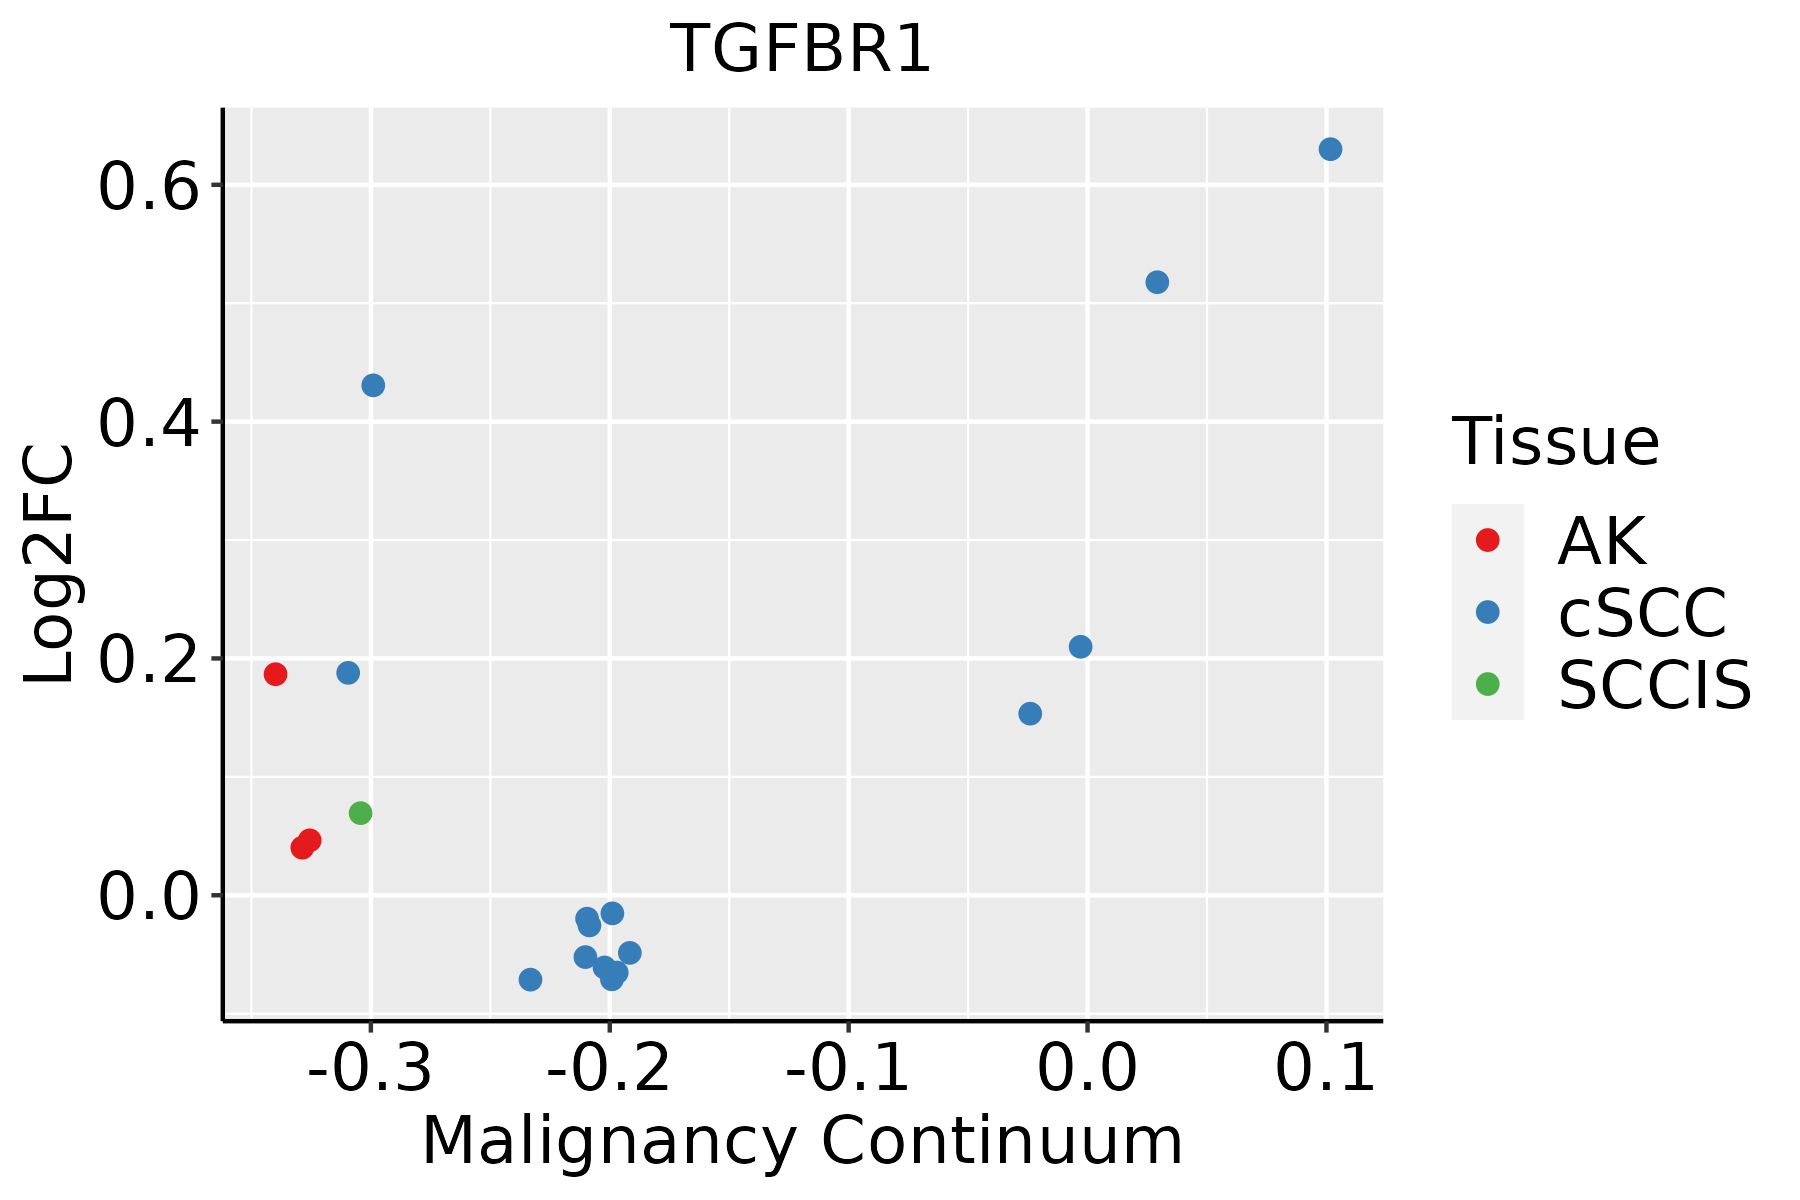 | AK: Actinic keratosis |
| cSCC: Cutaneous squamous cell carcinoma | ||
| SCCIS:squamous cell carcinoma in situ | ||
| Thyroid |  | ATC: Anaplastic thyroid cancer |
| HT: Hashimoto's thyroiditis | ||
| PTC: Papillary thyroid cancer |
| ∗log2FC in expression of this searched gene in stem-like cells from each diseased tissue sample relative to stem-like cells in normal samples in each tissue plotted against the malignancy continuum. Samples are colored based on if they are from different disease stage. |
Top |
Malignant transformation related pathway analysis |
| Find out the enriched GO biological processes and KEGG pathways involved in transition from healthy to precancer to cancer |
| Tissue | Disease Stage | Enriched GO biological Processes |
| Colorectum | AD |  |
| Colorectum | SER |  |
| Colorectum | MSS |  |
| Colorectum | MSI-H |  |
| Colorectum | FAP |  |
| ∗Top 15 enriched GO BP terms are showed in the bar plot of each disease state in each tissue. Each row represents a significant GO biological process which is colored according to the -log10(p.adjust). |
| Page: 1 2 3 4 5 6 7 8 9 |
| GO ID | Tissue | Disease Stage | Description | Gene Ratio | Bg Ratio | pvalue | p.adjust | Count |
| GO:2001233111 | Esophagus | ESCC | regulation of apoptotic signaling pathway | 256/8552 | 356/18723 | 4.11e-24 | 1.04e-21 | 256 |
| GO:0022411111 | Esophagus | ESCC | cellular component disassembly | 305/8552 | 443/18723 | 1.94e-23 | 4.57e-21 | 305 |
| GO:1903320111 | Esophagus | ESCC | regulation of protein modification by small protein conjugation or removal | 181/8552 | 242/18723 | 1.80e-20 | 2.60e-18 | 181 |
| GO:0051098111 | Esophagus | ESCC | regulation of binding | 251/8552 | 363/18723 | 6.73e-20 | 8.46e-18 | 251 |
| GO:0031396111 | Esophagus | ESCC | regulation of protein ubiquitination | 154/8552 | 210/18723 | 2.70e-16 | 2.04e-14 | 154 |
| GO:0097191111 | Esophagus | ESCC | extrinsic apoptotic signaling pathway | 159/8552 | 219/18723 | 4.12e-16 | 2.94e-14 | 159 |
| GO:000170119 | Esophagus | ESCC | in utero embryonic development | 243/8552 | 367/18723 | 1.00e-15 | 6.86e-14 | 243 |
| GO:2001234111 | Esophagus | ESCC | negative regulation of apoptotic signaling pathway | 161/8552 | 224/18723 | 1.24e-15 | 8.09e-14 | 161 |
| GO:2001236111 | Esophagus | ESCC | regulation of extrinsic apoptotic signaling pathway | 111/8552 | 151/18723 | 2.97e-12 | 1.18e-10 | 111 |
| GO:0048732111 | Esophagus | ESCC | gland development | 269/8552 | 436/18723 | 7.81e-12 | 2.95e-10 | 269 |
| GO:004339320 | Esophagus | ESCC | regulation of protein binding | 135/8552 | 196/18723 | 3.69e-11 | 1.22e-09 | 135 |
| GO:1902905111 | Esophagus | ESCC | positive regulation of supramolecular fiber organization | 142/8552 | 209/18723 | 5.51e-11 | 1.76e-09 | 142 |
| GO:1902903111 | Esophagus | ESCC | regulation of supramolecular fiber organization | 237/8552 | 383/18723 | 9.06e-11 | 2.75e-09 | 237 |
| GO:0016049110 | Esophagus | ESCC | cell growth | 289/8552 | 482/18723 | 1.29e-10 | 3.77e-09 | 289 |
| GO:2001235110 | Esophagus | ESCC | positive regulation of apoptotic signaling pathway | 92/8552 | 126/18723 | 3.91e-10 | 1.05e-08 | 92 |
| GO:005149520 | Esophagus | ESCC | positive regulation of cytoskeleton organization | 147/8552 | 226/18723 | 2.93e-09 | 6.38e-08 | 147 |
| GO:000155819 | Esophagus | ESCC | regulation of cell growth | 248/8552 | 414/18723 | 2.97e-09 | 6.45e-08 | 248 |
| GO:000701527 | Esophagus | ESCC | actin filament organization | 259/8552 | 442/18723 | 2.37e-08 | 4.50e-07 | 259 |
| GO:0061458110 | Esophagus | ESCC | reproductive system development | 247/8552 | 427/18723 | 2.24e-07 | 3.42e-06 | 247 |
| GO:004860818 | Esophagus | ESCC | reproductive structure development | 245/8552 | 424/18723 | 2.82e-07 | 4.14e-06 | 245 |
| Page: 1 2 3 4 5 6 7 8 9 10 11 12 13 14 15 16 17 18 19 20 21 22 23 24 25 26 27 28 29 30 31 32 33 |
| Pathway ID | Tissue | Disease Stage | Description | Gene Ratio | Bg Ratio | pvalue | p.adjust | qvalue | Count |
| hsa04144210 | Esophagus | ESCC | Endocytosis | 186/4205 | 251/8465 | 9.74e-16 | 4.66e-14 | 2.39e-14 | 186 |
| hsa05166211 | Esophagus | ESCC | Human T-cell leukemia virus 1 infection | 164/4205 | 222/8465 | 8.13e-14 | 2.09e-12 | 1.07e-12 | 164 |
| hsa0421829 | Esophagus | ESCC | Cellular senescence | 119/4205 | 156/8465 | 5.89e-12 | 9.40e-11 | 4.81e-11 | 119 |
| hsa05415211 | Esophagus | ESCC | Diabetic cardiomyopathy | 146/4205 | 203/8465 | 5.81e-11 | 7.78e-10 | 3.99e-10 | 146 |
| hsa0521020 | Esophagus | ESCC | Colorectal cancer | 69/4205 | 86/8465 | 4.06e-09 | 4.13e-08 | 2.11e-08 | 69 |
| hsa0521216 | Esophagus | ESCC | Pancreatic cancer | 62/4205 | 76/8465 | 7.37e-09 | 6.85e-08 | 3.51e-08 | 62 |
| hsa0522020 | Esophagus | ESCC | Chronic myeloid leukemia | 61/4205 | 76/8465 | 3.20e-08 | 2.68e-07 | 1.37e-07 | 61 |
| hsa0452030 | Esophagus | ESCC | Adherens junction | 69/4205 | 93/8465 | 1.08e-06 | 6.83e-06 | 3.50e-06 | 69 |
| hsa0493310 | Esophagus | ESCC | AGE-RAGE signaling pathway in diabetic complications | 72/4205 | 100/8465 | 4.15e-06 | 2.28e-05 | 1.17e-05 | 72 |
| hsa051619 | Esophagus | ESCC | Hepatitis B | 108/4205 | 162/8465 | 7.68e-06 | 4.15e-05 | 2.12e-05 | 108 |
| hsa040689 | Esophagus | ESCC | FoxO signaling pathway | 89/4205 | 131/8465 | 1.56e-05 | 7.98e-05 | 4.09e-05 | 89 |
| hsa0522518 | Esophagus | ESCC | Hepatocellular carcinoma | 109/4205 | 168/8465 | 4.27e-05 | 1.88e-04 | 9.64e-05 | 109 |
| hsa049268 | Esophagus | ESCC | Relaxin signaling pathway | 81/4205 | 129/8465 | 1.72e-03 | 5.09e-03 | 2.61e-03 | 81 |
| hsa043507 | Esophagus | ESCC | TGF-beta signaling pathway | 69/4205 | 108/8465 | 1.92e-03 | 5.54e-03 | 2.84e-03 | 69 |
| hsa051425 | Esophagus | ESCC | Chagas disease | 65/4205 | 102/8465 | 2.81e-03 | 7.59e-03 | 3.89e-03 | 65 |
| hsa046599 | Esophagus | ESCC | Th17 cell differentiation | 68/4205 | 108/8465 | 3.53e-03 | 9.30e-03 | 4.76e-03 | 68 |
| hsa0439018 | Esophagus | ESCC | Hippo signaling pathway | 92/4205 | 157/8465 | 1.46e-02 | 3.31e-02 | 1.69e-02 | 92 |
| hsa0414437 | Esophagus | ESCC | Endocytosis | 186/4205 | 251/8465 | 9.74e-16 | 4.66e-14 | 2.39e-14 | 186 |
| hsa05166310 | Esophagus | ESCC | Human T-cell leukemia virus 1 infection | 164/4205 | 222/8465 | 8.13e-14 | 2.09e-12 | 1.07e-12 | 164 |
| hsa0421838 | Esophagus | ESCC | Cellular senescence | 119/4205 | 156/8465 | 5.89e-12 | 9.40e-11 | 4.81e-11 | 119 |
| Page: 1 2 3 4 5 6 7 8 9 |
Top |
Cell-cell communication analysis |
| Identification of potential cell-cell interactions between two cell types and their ligand-receptor pairs for different disease states |
| Ligand | Receptor | LRpair | Pathway | Tissue | Disease Stage |
| TGFB1 | TGFbR1_R2 | TGFB1_TGFBR1_TGFBR2 | TGFb | Breast | ADJ |
| TGFB3 | TGFbR1_R2 | TGFB3_TGFBR1_TGFBR2 | TGFb | Breast | ADJ |
| TGFB1 | TGFbR1_R2 | TGFB1_TGFBR1_TGFBR2 | TGFb | Breast | DCIS |
| TGFB3 | TGFbR1_R2 | TGFB3_TGFBR1_TGFBR2 | TGFb | Breast | DCIS |
| TGFB1 | TGFbR1_R2 | TGFB1_TGFBR1_TGFBR2 | TGFb | Breast | IDC |
| TGFB1 | TGFbR1_R2 | TGFB1_TGFBR1_TGFBR2 | TGFb | Cervix | CC |
| TGFB1 | TGFbR1_R2 | TGFB1_TGFBR1_TGFBR2 | TGFb | CRC | CRC |
| TGFB1 | TGFbR1_R2 | TGFB1_TGFBR1_TGFBR2 | TGFb | CRC | MSI-H |
| TGFB1 | TGFbR1_R2 | TGFB1_TGFBR1_TGFBR2 | TGFb | CRC | SER |
| TGFB1 | TGFbR1_R2 | TGFB1_TGFBR1_TGFBR2 | TGFb | Endometrium | ADJ |
| TGFB2 | TGFbR1_R2 | TGFB2_TGFBR1_TGFBR2 | TGFb | Endometrium | ADJ |
| TGFB1 | TGFbR1_R2 | TGFB1_TGFBR1_TGFBR2 | TGFb | Endometrium | AEH |
| TGFB1 | TGFbR1_R2 | TGFB1_TGFBR1_TGFBR2 | TGFb | Esophagus | ESCC |
| TGFB3 | TGFbR1_R2 | TGFB3_TGFBR1_TGFBR2 | TGFb | Esophagus | ESCC |
| TGFB1 | TGFbR1_R2 | TGFB1_TGFBR1_TGFBR2 | TGFb | HNSCC | ADJ |
| TGFB1 | TGFbR1_R2 | TGFB1_TGFBR1_TGFBR2 | TGFb | HNSCC | OSCC |
| TGFB3 | TGFbR1_R2 | TGFB3_TGFBR1_TGFBR2 | TGFb | HNSCC | OSCC |
| TGFB1 | TGFbR1_R2 | TGFB1_TGFBR1_TGFBR2 | TGFb | HNSCC | Precancer |
| TGFB3 | TGFbR1_R2 | TGFB3_TGFBR1_TGFBR2 | TGFb | HNSCC | Precancer |
| TGFB1 | TGFbR1_R2 | TGFB1_TGFBR1_TGFBR2 | TGFb | Liver | HCC |
| Page: 1 |
Top |
Single-cell gene regulatory network inference analysis |
| Find out the significant the regulons (TFs) and the target genes of each regulon across cell types for different disease states |
| TF | Cell Type | Tissue | Disease Stage | Target Gene | RSS | Regulon Activity |
| ∗The dot plots of a searched regulon are shown for all cell subpopulations in each disease state of each tissue based on the regulon specific score inferred using pySCENIC and by calculating the average expression. |
| Page: 1 |
Top |
Somatic mutation of malignant transformation related genes |
| Annotation of somatic variants for genes involved in malignant transformation |
| Hugo Symbol | Variant Class | Variant Classification | dbSNP RS | HGVSc | HGVSp | HGVSp Short | SWISSPROT | BIOTYPE | SIFT | PolyPhen | Tumor Sample Barcode | Tissue | Histology | Sex | Age | Stage | Therapy Types | Drugs | Outcome |
| TGFBR1 | SNV | Missense_Mutation | c.1210N>T | p.Asp404Tyr | p.D404Y | P36897 | protein_coding | deleterious(0) | probably_damaging(1) | TCGA-AC-A23H-01 | Breast | breast invasive carcinoma | Female | >=65 | I/II | Unknown | Unknown | PD | |
| TGFBR1 | SNV | Missense_Mutation | c.695N>T | p.Glu232Val | p.E232V | P36897 | protein_coding | deleterious(0) | benign(0.251) | TCGA-AO-A12D-01 | Breast | breast invasive carcinoma | Female | <65 | I/II | Chemotherapy | cyclophosphamide | SD | |
| TGFBR1 | SNV | Missense_Mutation | c.239G>A | p.Arg80Gln | p.R80Q | P36897 | protein_coding | tolerated(0.49) | benign(0.149) | TCGA-AR-A2LE-01 | Breast | breast invasive carcinoma | Female | >=65 | I/II | Hormone Therapy | tamoxiphen | PD | |
| TGFBR1 | SNV | Missense_Mutation | c.1200N>G | p.Phe400Leu | p.F400L | P36897 | protein_coding | deleterious(0) | probably_damaging(0.964) | TCGA-BH-A0B5-01 | Breast | breast invasive carcinoma | Female | <65 | III/IV | Chemotherapy | adriamycin | CR | |
| TGFBR1 | SNV | Missense_Mutation | c.559N>T | p.Asp187Tyr | p.D187Y | P36897 | protein_coding | tolerated(0.05) | probably_damaging(0.998) | TCGA-BH-A0H5-01 | Breast | breast invasive carcinoma | Female | <65 | I/II | Chemotherapy | cytoxan | CR | |
| TGFBR1 | insertion | In_Frame_Ins | novel | c.1379_1380insTCCTTGTTCCTTCTTACTTCTTCATAGTTGTCTTTGTTTTCT | p.Asn460_Arg461insProCysSerPheLeuLeuLeuHisSerCysLeuCysPheLeu | p.N460_R461insPCSFLLLHSCLCFL | P36897 | protein_coding | TCGA-AN-A0FS-01 | Breast | breast invasive carcinoma | Female | <65 | I/II | Unknown | Unknown | SD | ||
| TGFBR1 | insertion | Frame_Shift_Ins | novel | c.434_435insTACTC | p.Met146ThrfsTer4 | p.M146Tfs*4 | P36897 | protein_coding | TCGA-AR-A0TU-01 | Breast | breast invasive carcinoma | Female | <65 | I/II | Unspecific | Doxorubicin | SD | ||
| TGFBR1 | insertion | Nonsense_Mutation | novel | c.656_657insAGGGAAATGAATGAC | p.Arg219_Phe220insGlyLysTerMetThr | p.R219_F220insGK*MT | P36897 | protein_coding | TCGA-AR-A0TU-01 | Breast | breast invasive carcinoma | Female | <65 | I/II | Unspecific | Doxorubicin | SD | ||
| TGFBR1 | insertion | Frame_Shift_Ins | novel | c.434_435insTACTC | p.Met146ThrfsTer4 | p.M146Tfs*4 | P36897 | protein_coding | TCGA-AR-A0U0-01 | Breast | breast invasive carcinoma | Female | >=65 | I/II | Unknown | Unknown | SD | ||
| TGFBR1 | SNV | Missense_Mutation | novel | c.1465N>A | p.Ala489Thr | p.A489T | P36897 | protein_coding | deleterious(0.03) | probably_damaging(0.929) | TCGA-2W-A8YY-01 | Cervix | cervical & endocervical cancer | Female | <65 | I/II | Chemotherapy | cisplatin | CR |
| Page: 1 2 3 4 5 6 7 8 9 |
Top |
Related drugs of malignant transformation related genes |
| Identification of chemicals and drugs interact with genes involved in malignant transfromation |
| (DGIdb 4.0) |
| Entrez ID | Symbol | Category | Interaction Types | Drug Claim Name | Drug Name | PMIDs |
| 7046 | TGFBR1 | DRUGGABLE GENOME, ENZYME, KINASE, CLINICALLY ACTIONABLE, SERINE THREONINE KINASE, CELL SURFACE, TUMOR SUPPRESSOR | inhibitor | 249565800 | ||
| 7046 | TGFBR1 | DRUGGABLE GENOME, ENZYME, KINASE, CLINICALLY ACTIONABLE, SERINE THREONINE KINASE, CELL SURFACE, TUMOR SUPPRESSOR | LY2157299 | |||
| 7046 | TGFBR1 | DRUGGABLE GENOME, ENZYME, KINASE, CLINICALLY ACTIONABLE, SERINE THREONINE KINASE, CELL SURFACE, TUMOR SUPPRESSOR | Metelimumab | METELIMUMAB | ||
| 7046 | TGFBR1 | DRUGGABLE GENOME, ENZYME, KINASE, CLINICALLY ACTIONABLE, SERINE THREONINE KINASE, CELL SURFACE, TUMOR SUPPRESSOR | inhibitor | 252166689 | ||
| 7046 | TGFBR1 | DRUGGABLE GENOME, ENZYME, KINASE, CLINICALLY ACTIONABLE, SERINE THREONINE KINASE, CELL SURFACE, TUMOR SUPPRESSOR | LY-2382770 | LY-2382770 | ||
| 7046 | TGFBR1 | DRUGGABLE GENOME, ENZYME, KINASE, CLINICALLY ACTIONABLE, SERINE THREONINE KINASE, CELL SURFACE, TUMOR SUPPRESSOR | inhibitor | HESPERADIN | HESPERADIN | 19035792 |
| 7046 | TGFBR1 | DRUGGABLE GENOME, ENZYME, KINASE, CLINICALLY ACTIONABLE, SERINE THREONINE KINASE, CELL SURFACE, TUMOR SUPPRESSOR | inhibitor | 178102671 | ||
| 7046 | TGFBR1 | DRUGGABLE GENOME, ENZYME, KINASE, CLINICALLY ACTIONABLE, SERINE THREONINE KINASE, CELL SURFACE, TUMOR SUPPRESSOR | inhibitor | 223366128 | GALUNISERTIB | |
| 7046 | TGFBR1 | DRUGGABLE GENOME, ENZYME, KINASE, CLINICALLY ACTIONABLE, SERINE THREONINE KINASE, CELL SURFACE, TUMOR SUPPRESSOR | inhibitor | 249565874 | ||
| 7046 | TGFBR1 | DRUGGABLE GENOME, ENZYME, KINASE, CLINICALLY ACTIONABLE, SERINE THREONINE KINASE, CELL SURFACE, TUMOR SUPPRESSOR | inhibitor | 249565787 | VACTOSERTIB |
| Page: 1 2 3 |

Copyright 2023-Present -The University of Texas Health Science Center at Houston |