| Tissue | Expression Dynamics | Abbreviation |
| Colorectum (GSE201348) |  | FAP: Familial adenomatous polyposis |
| CRC: Colorectal cancer |
| Colorectum (HTA11) | 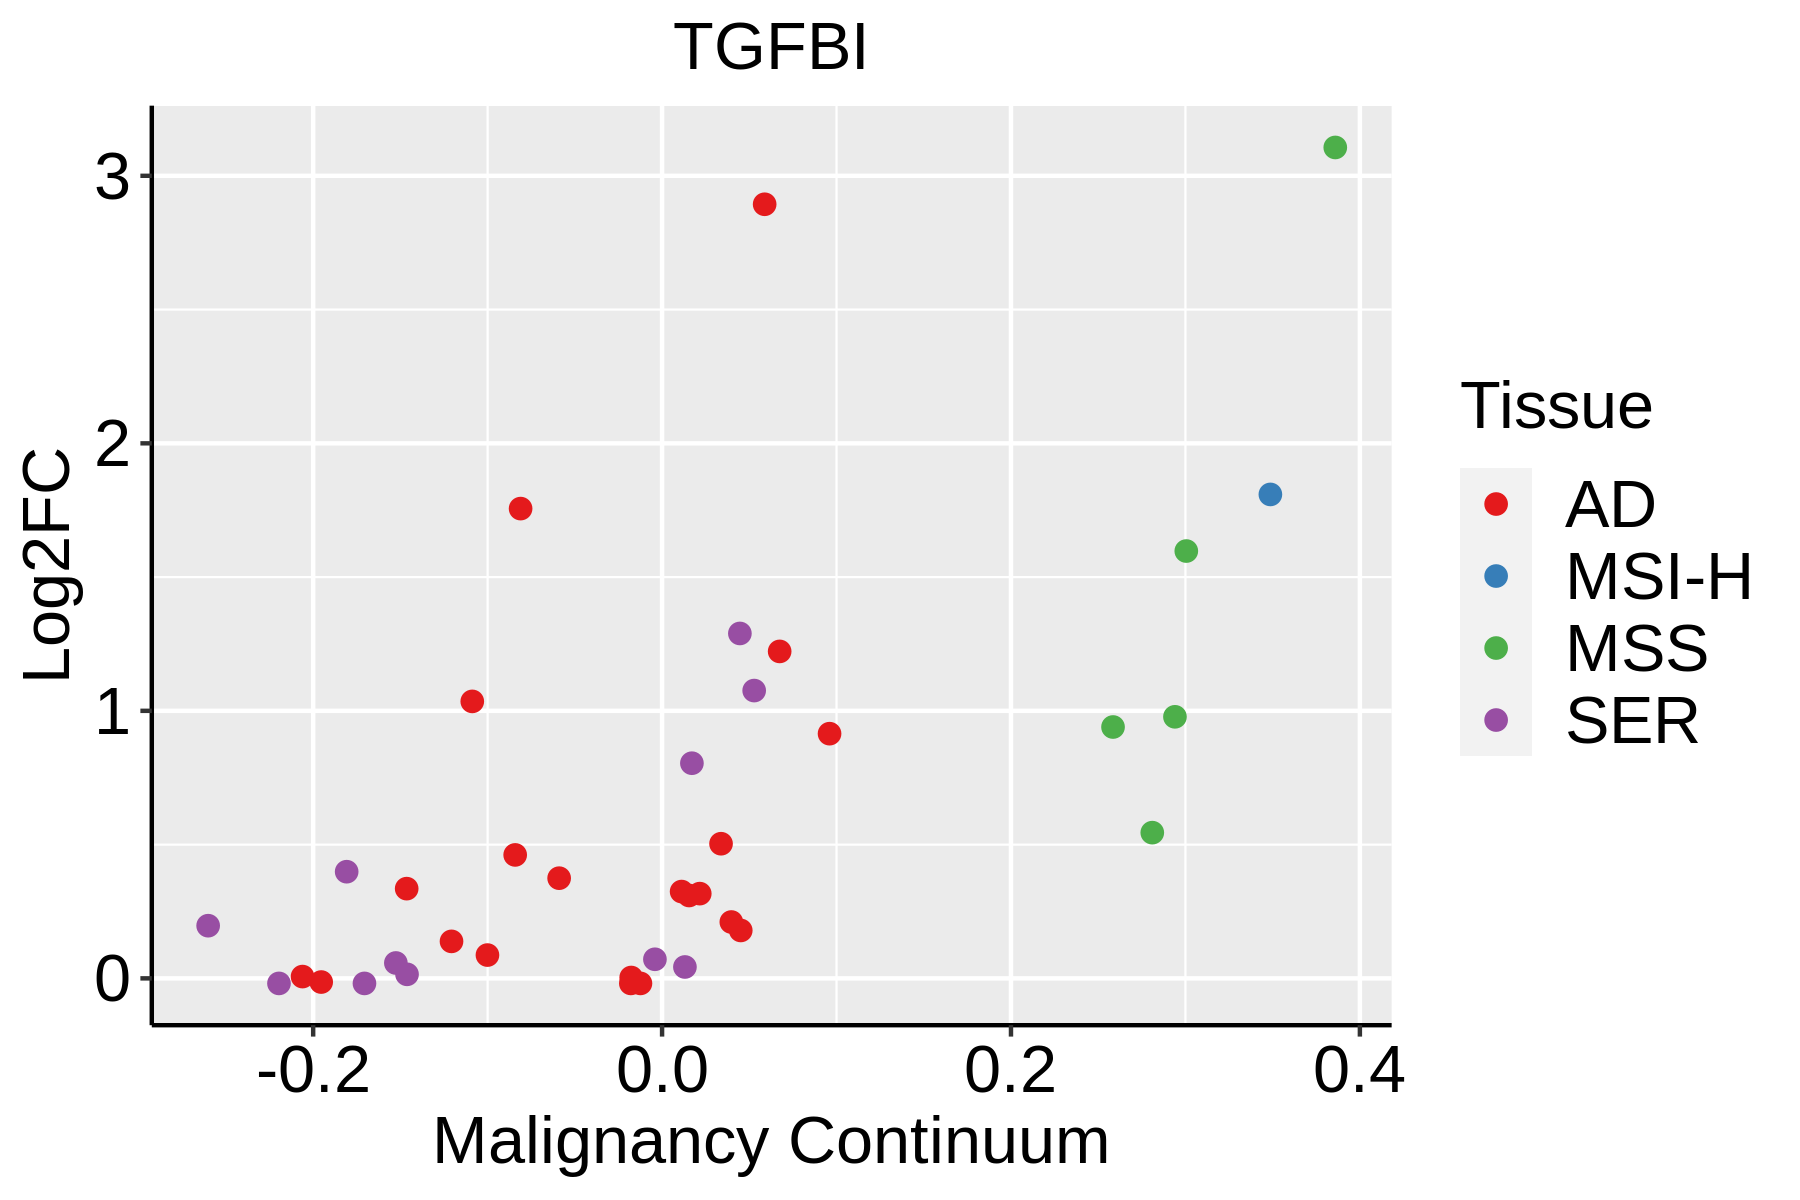 | AD: Adenomas |
| SER: Sessile serrated lesions |
| MSI-H: Microsatellite-high colorectal cancer |
| MSS: Microsatellite stable colorectal cancer |
| Endometrium | 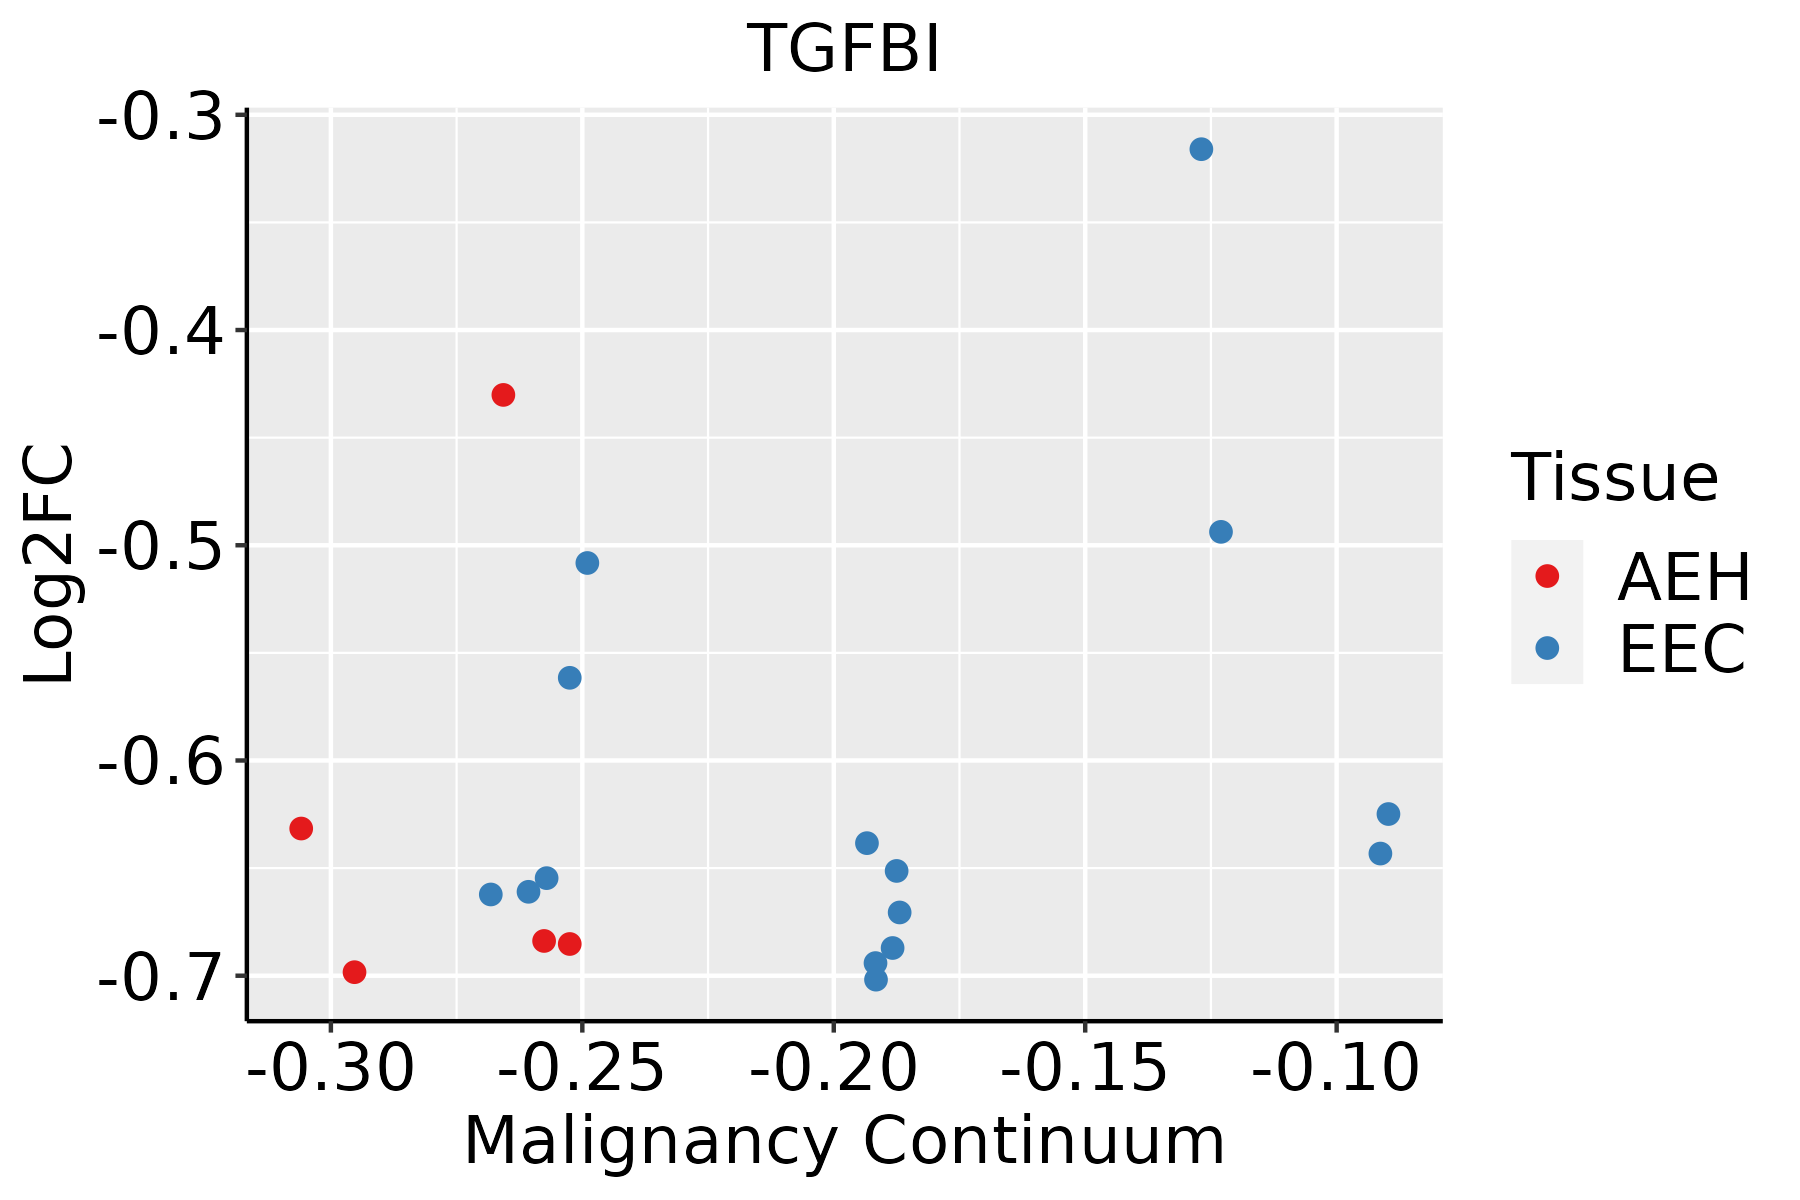 | AEH: Atypical endometrial hyperplasia |
| EEC: Endometrioid Cancer |
| Esophagus |  | ESCC: Esophageal squamous cell carcinoma |
| HGIN: High-grade intraepithelial neoplasias |
| LGIN: Low-grade intraepithelial neoplasias |
| Liver | 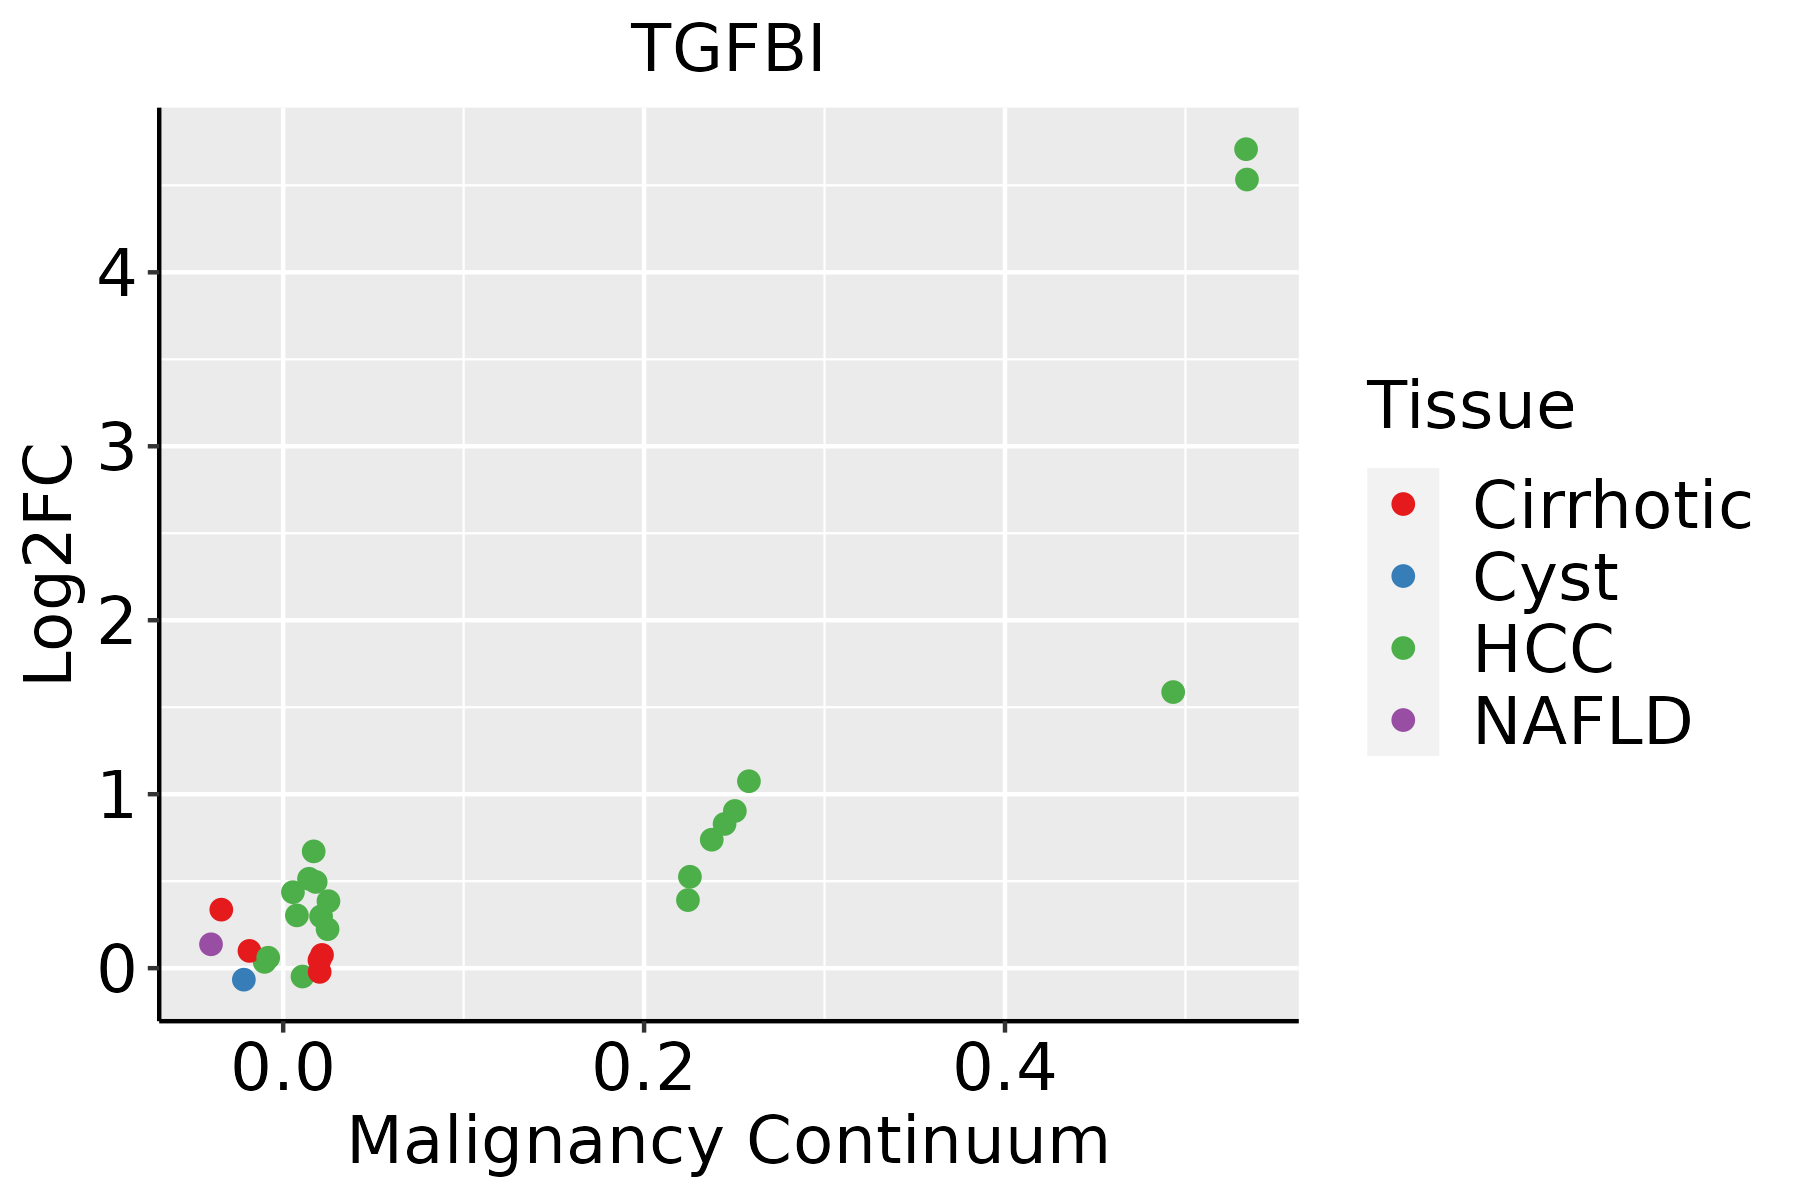 | HCC: Hepatocellular carcinoma |
| NAFLD: Non-alcoholic fatty liver disease |
| Oral Cavity | 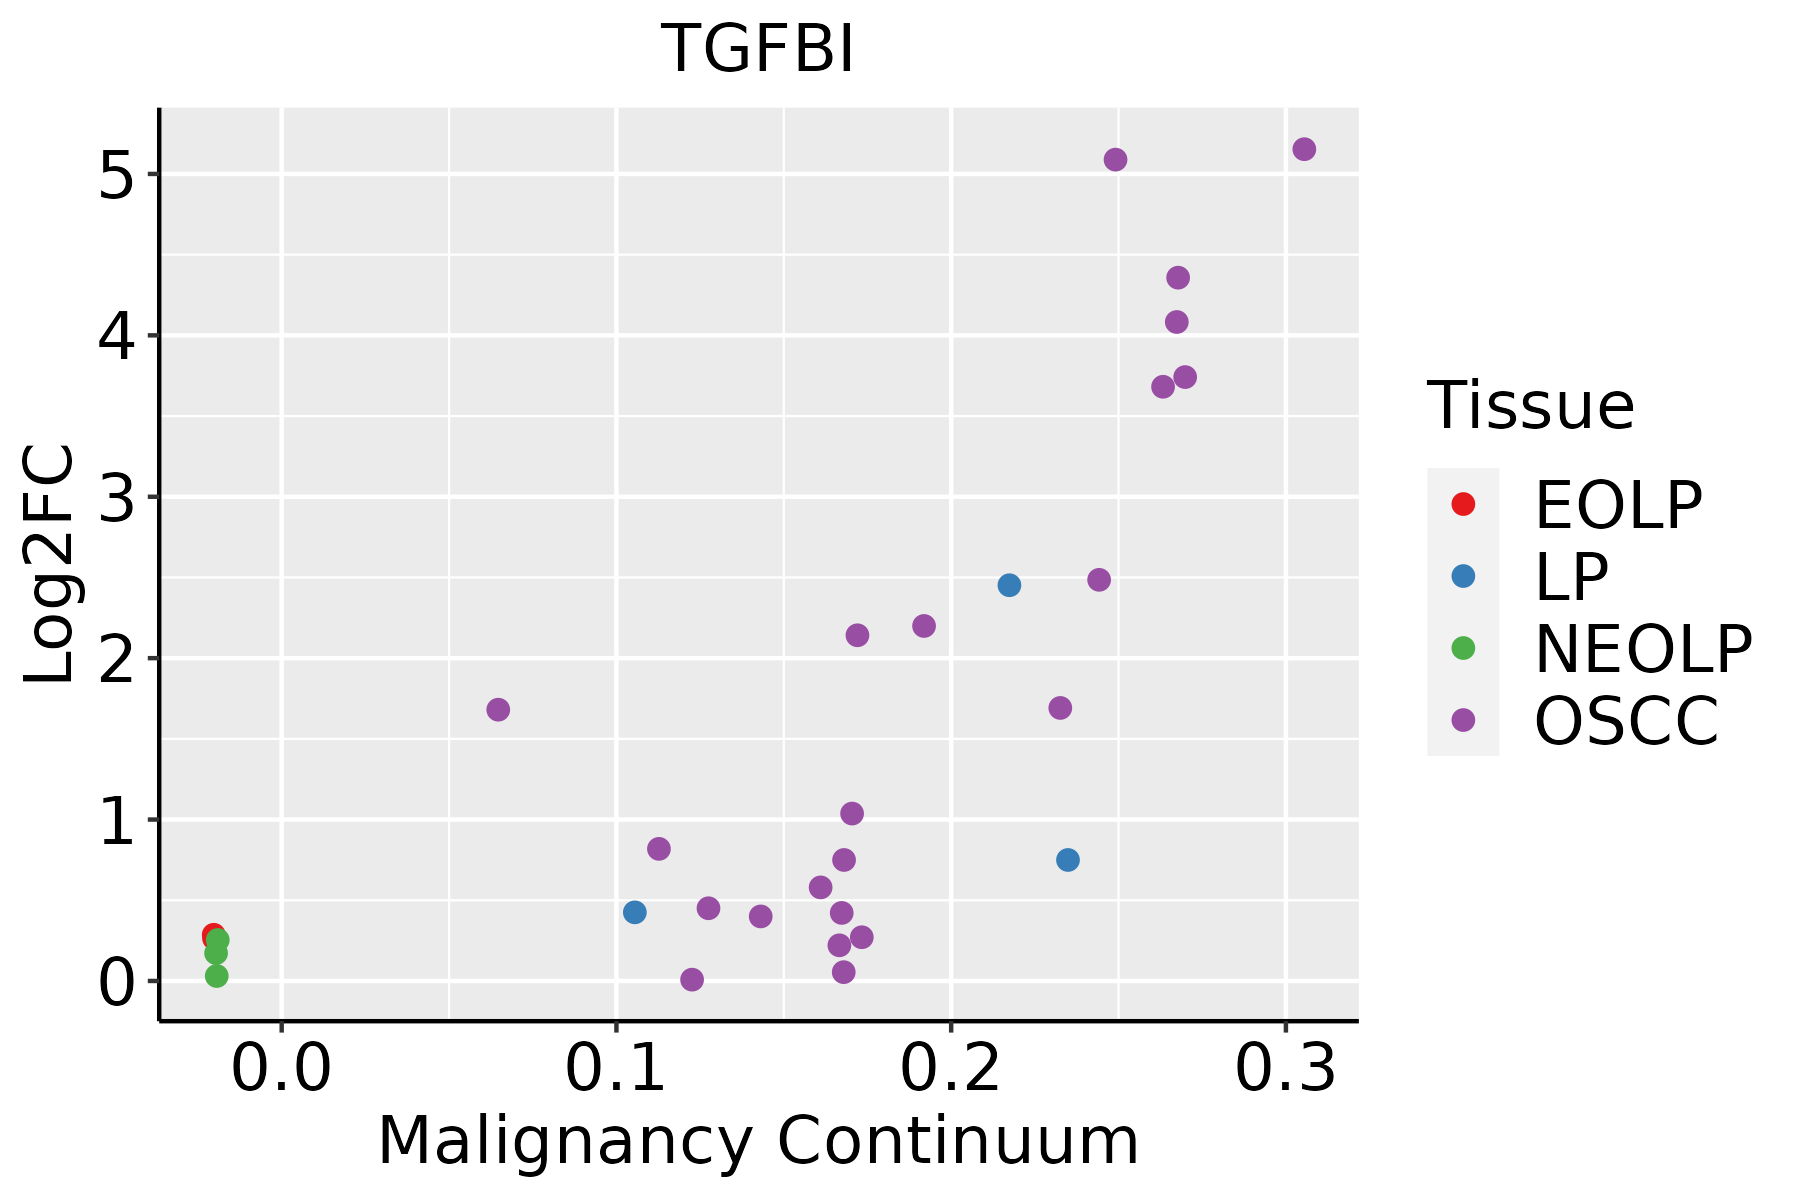 | EOLP: Erosive Oral lichen planus |
| LP: leukoplakia |
| NEOLP: Non-erosive oral lichen planus |
| OSCC: Oral squamous cell carcinoma |
| Skin | 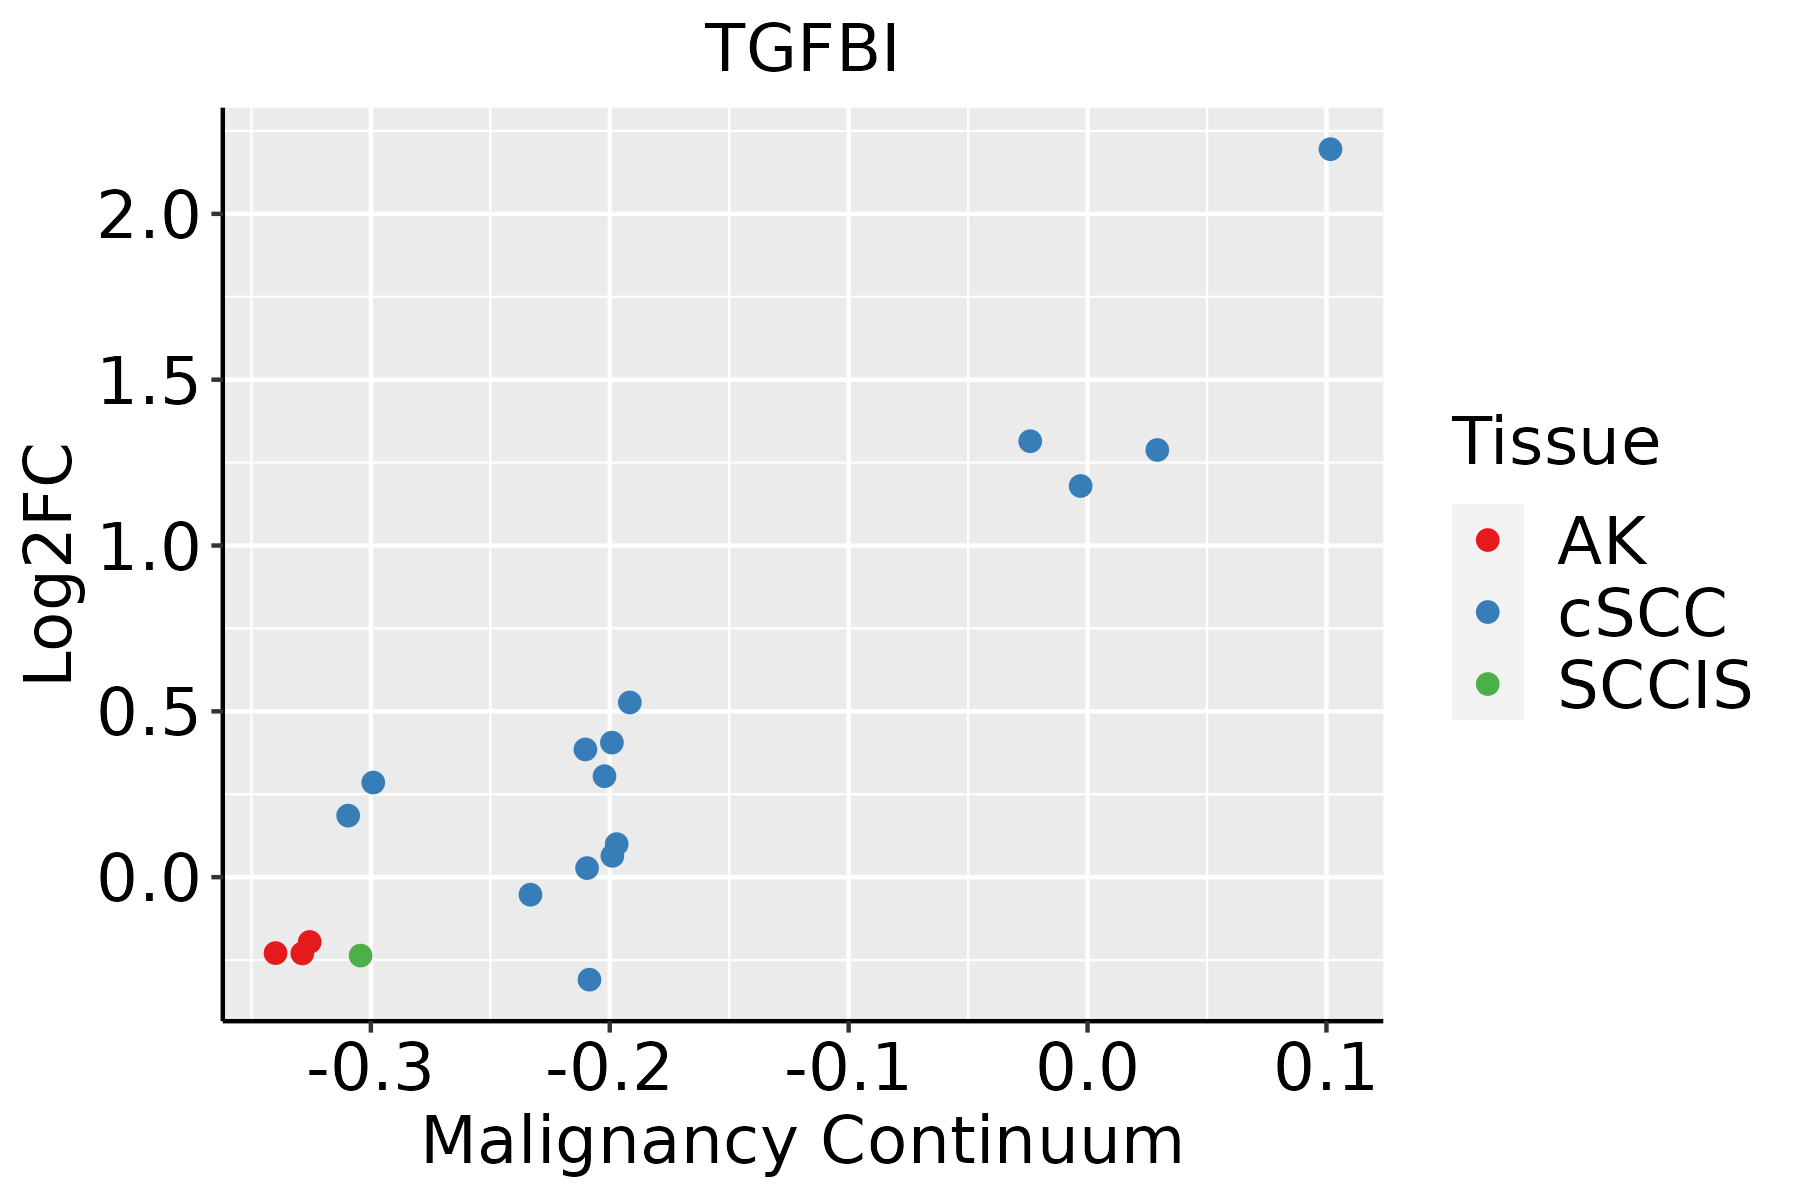 | AK: Actinic keratosis |
| cSCC: Cutaneous squamous cell carcinoma |
| SCCIS:squamous cell carcinoma in situ |
| Thyroid | 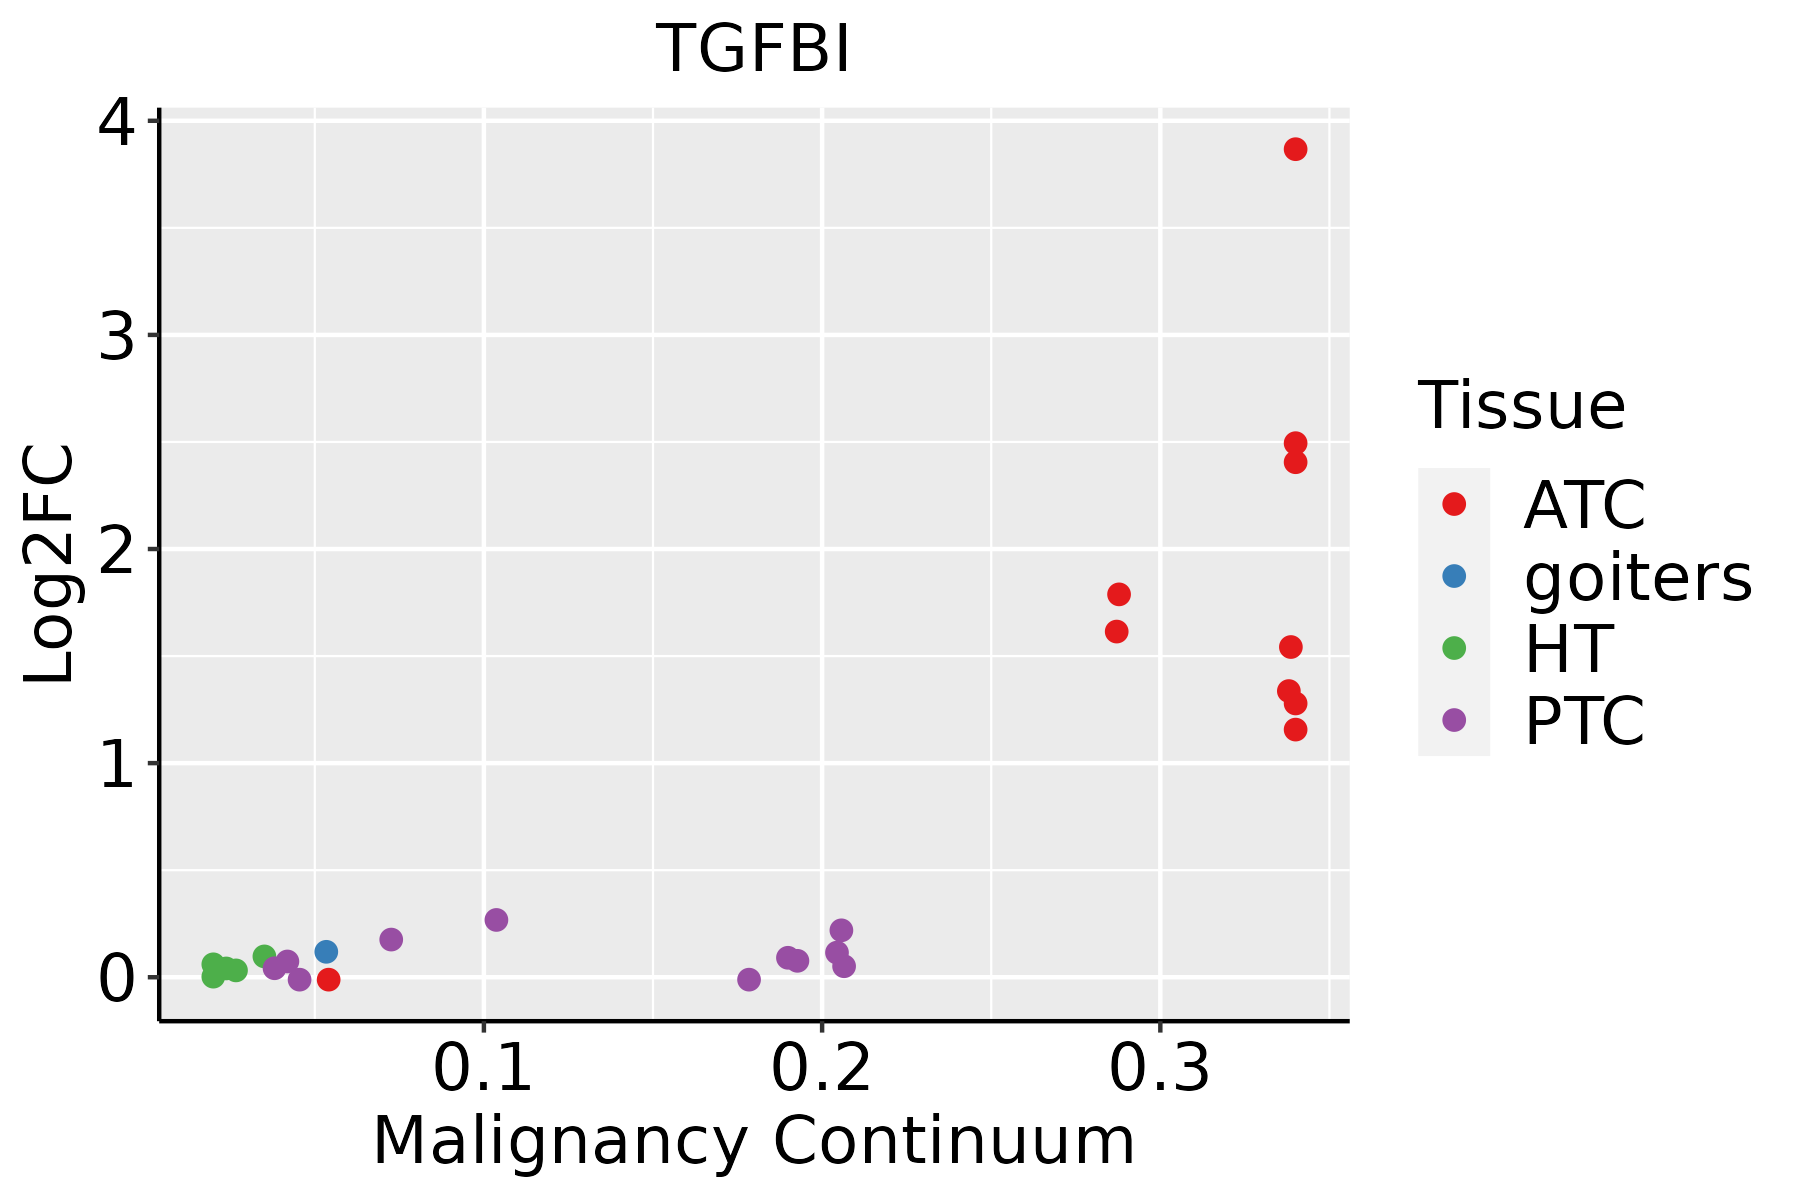 | ATC: Anaplastic thyroid cancer |
| HT: Hashimoto's thyroiditis |
| PTC: Papillary thyroid cancer |
| GO ID | Tissue | Disease Stage | Description | Gene Ratio | Bg Ratio | pvalue | p.adjust | Count |
| GO:0007162 | Colorectum | SER | negative regulation of cell adhesion | 68/2897 | 303/18723 | 8.02e-04 | 1.01e-02 | 68 |
| GO:00071621 | Colorectum | FAP | negative regulation of cell adhesion | 61/2622 | 303/18723 | 1.96e-03 | 1.65e-02 | 61 |
| GO:0002062 | Colorectum | CRC | chondrocyte differentiation | 21/2078 | 106/18723 | 5.87e-03 | 4.33e-02 | 21 |
| GO:00071622 | Colorectum | CRC | negative regulation of cell adhesion | 48/2078 | 303/18723 | 7.14e-03 | 4.96e-02 | 48 |
| GO:0061448 | Endometrium | AEH | connective tissue development | 44/2100 | 252/18723 | 1.92e-03 | 1.51e-02 | 44 |
| GO:00071627 | Endometrium | AEH | negative regulation of cell adhesion | 49/2100 | 303/18723 | 5.43e-03 | 3.37e-02 | 49 |
| GO:000716214 | Endometrium | EEC | negative regulation of cell adhesion | 54/2168 | 303/18723 | 8.19e-04 | 7.62e-03 | 54 |
| GO:00614481 | Endometrium | EEC | connective tissue development | 44/2168 | 252/18723 | 3.51e-03 | 2.36e-02 | 44 |
| GO:00301984 | Esophagus | ESCC | extracellular matrix organization | 171/8552 | 301/18723 | 6.08e-05 | 4.67e-04 | 171 |
| GO:00430624 | Esophagus | ESCC | extracellular structure organization | 171/8552 | 302/18723 | 7.73e-05 | 5.76e-04 | 171 |
| GO:00452294 | Esophagus | ESCC | external encapsulating structure organization | 172/8552 | 304/18723 | 7.80e-05 | 5.80e-04 | 172 |
| GO:00512161 | Esophagus | ESCC | cartilage development | 103/8552 | 190/18723 | 1.08e-02 | 3.67e-02 | 103 |
| GO:00020623 | Esophagus | ESCC | chondrocyte differentiation | 60/8552 | 106/18723 | 1.53e-02 | 4.94e-02 | 60 |
| GO:00301983 | Oral cavity | OSCC | extracellular matrix organization | 146/7305 | 301/18723 | 4.67e-04 | 2.77e-03 | 146 |
| GO:00452293 | Oral cavity | OSCC | external encapsulating structure organization | 147/7305 | 304/18723 | 5.30e-04 | 3.08e-03 | 147 |
| GO:00430623 | Oral cavity | OSCC | extracellular structure organization | 146/7305 | 302/18723 | 5.59e-04 | 3.23e-03 | 146 |
| GO:00071629 | Oral cavity | OSCC | negative regulation of cell adhesion | 145/7305 | 303/18723 | 9.95e-04 | 5.18e-03 | 145 |
| GO:000716216 | Oral cavity | EOLP | negative regulation of cell adhesion | 61/2218 | 303/18723 | 2.11e-05 | 3.28e-04 | 61 |
| GO:003019811 | Oral cavity | EOLP | extracellular matrix organization | 52/2218 | 301/18723 | 3.29e-03 | 1.90e-02 | 52 |
| GO:004306211 | Oral cavity | EOLP | extracellular structure organization | 52/2218 | 302/18723 | 3.52e-03 | 2.01e-02 | 52 |
| Hugo Symbol | Variant Class | Variant Classification | dbSNP RS | HGVSc | HGVSp | HGVSp Short | SWISSPROT | BIOTYPE | SIFT | PolyPhen | Tumor Sample Barcode | Tissue | Histology | Sex | Age | Stage | Therapy Types | Drugs | Outcome |
| TGFBI | SNV | Missense_Mutation | rs774207585 | c.1831N>A | p.Glu611Lys | p.E611K | Q15582 | protein_coding | tolerated(0.19) | possibly_damaging(0.565) | TCGA-A2-A0D1-01 | Breast | breast invasive carcinoma | Female | >=65 | I/II | Chemotherapy | taxotere | SD |
| TGFBI | SNV | Missense_Mutation | | c.1414N>T | p.Leu472Phe | p.L472F | Q15582 | protein_coding | deleterious(0) | possibly_damaging(0.876) | TCGA-A8-A09Q-01 | Breast | breast invasive carcinoma | Female | >=65 | III/IV | Hormone Therapy | anastrozole | SD |
| TGFBI | SNV | Missense_Mutation | novel | c.1360N>G | p.Thr454Ala | p.T454A | Q15582 | protein_coding | tolerated(0.89) | benign(0.001) | TCGA-AN-A046-01 | Breast | breast invasive carcinoma | Female | >=65 | I/II | Unknown | Unknown | SD |
| TGFBI | SNV | Missense_Mutation | novel | c.760N>C | p.Glu254Gln | p.E254Q | Q15582 | protein_coding | tolerated(0.07) | probably_damaging(0.971) | TCGA-BH-A0B6-01 | Breast | breast invasive carcinoma | Female | <65 | I/II | Unknown | Unknown | SD |
| TGFBI | SNV | Missense_Mutation | | c.1071C>G | p.Ile357Met | p.I357M | Q15582 | protein_coding | deleterious(0.02) | benign(0.369) | TCGA-BH-A0BZ-01 | Breast | breast invasive carcinoma | Female | <65 | III/IV | Chemotherapy | doxorubicin | CR |
| TGFBI | SNV | Missense_Mutation | novel | c.1483N>A | p.Asp495Asn | p.D495N | Q15582 | protein_coding | tolerated(0.37) | possibly_damaging(0.811) | TCGA-C8-A12T-01 | Breast | breast invasive carcinoma | Female | <65 | I/II | Unknown | Unknown | SD |
| TGFBI | SNV | Missense_Mutation | | c.358C>A | p.Leu120Met | p.L120M | Q15582 | protein_coding | tolerated(0.12) | benign(0.289) | TCGA-D8-A1XK-01 | Breast | breast invasive carcinoma | Female | <65 | I/II | Chemotherapy | doxorubicine+cyclophosphamide | SD |
| TGFBI | SNV | Missense_Mutation | rs200065806 | c.1540C>A | p.Arg514Ser | p.R514S | Q15582 | protein_coding | deleterious(0.01) | possibly_damaging(0.666) | TCGA-LD-A66U-01 | Breast | breast invasive carcinoma | Female | <65 | I/II | Chemotherapy | adriamycin | SD |
| TGFBI | insertion | Nonsense_Mutation | novel | c.1545_1546insCTGAGATAGGGCCGTTGCACTCCAGCCTGGGCA | p.Phe515_Ser516insLeuArgTerGlyArgCysThrProAlaTrpAla | p.F515_S516insLR*GRCTPAWA | Q15582 | protein_coding | | | TCGA-B6-A0IN-01 | Breast | breast invasive carcinoma | Female | <65 | I/II | Unknown | Unknown | PD |
| TGFBI | SNV | Missense_Mutation | novel | c.1435A>G | p.Ile479Val | p.I479V | Q15582 | protein_coding | tolerated(0.23) | benign(0.208) | TCGA-2W-A8YY-01 | Cervix | cervical & endocervical cancer | Female | <65 | I/II | Chemotherapy | cisplatin | CR |


