
|
|||||
|
 | |
| |
| |
| |
| |
| |
|
Gene: TGFB2 |
Gene summary for TGFB2 |
| Gene information | Species | Human | Gene symbol | TGFB2 | Gene ID | 7042 |
| Gene name | transforming growth factor beta 2 | |
| Gene Alias | G-TSF | |
| Cytomap | 1q41 | |
| Gene Type | protein-coding | GO ID | GO:0000003 | UniProtAcc | P61812 |
Top |
Malignant transformation analysis |
| Identification of the aberrant gene expression in precancerous and cancerous lesions by comparing the gene expression of stem-like cells in diseased tissues with normal stem cells |
| Entrez ID | Symbol | Replicates | Species | Organ | Tissue | Adj P-value | Log2FC | Malignancy |
| 7042 | TGFB2 | HCC2 | Human | Liver | HCC | 1.20e-24 | 8.34e-01 | 0.5341 |
| 7042 | TGFB2 | HCC5 | Human | Liver | HCC | 2.87e-30 | 1.03e+00 | 0.4932 |
| 7042 | TGFB2 | S014 | Human | Liver | HCC | 1.24e-07 | 5.76e-01 | 0.2254 |
| 7042 | TGFB2 | S016 | Human | Liver | HCC | 4.57e-05 | 4.60e-01 | 0.2243 |
| 7042 | TGFB2 | S028 | Human | Liver | HCC | 5.88e-08 | 5.46e-01 | 0.2503 |
| 7042 | TGFB2 | C04 | Human | Oral cavity | OSCC | 3.43e-05 | 4.13e-01 | 0.2633 |
| 7042 | TGFB2 | C30 | Human | Oral cavity | OSCC | 4.30e-08 | 5.33e-01 | 0.3055 |
| 7042 | TGFB2 | C09 | Human | Oral cavity | OSCC | 1.71e-17 | 5.78e-01 | 0.1431 |
| 7042 | TGFB2 | SYSMH3 | Human | Oral cavity | OSCC | 1.06e-03 | 2.44e-01 | 0.2442 |
| 7042 | TGFB2 | male-WTA | Human | Thyroid | PTC | 2.57e-05 | 8.51e-02 | 0.1037 |
| 7042 | TGFB2 | PTC01 | Human | Thyroid | PTC | 1.57e-02 | 9.07e-02 | 0.1899 |
| 7042 | TGFB2 | PTC05 | Human | Thyroid | PTC | 2.55e-02 | 2.04e-01 | 0.2065 |
| 7042 | TGFB2 | PTC06 | Human | Thyroid | PTC | 2.44e-03 | 1.64e-01 | 0.2057 |
| 7042 | TGFB2 | PTC07 | Human | Thyroid | PTC | 1.02e-18 | 4.17e-01 | 0.2044 |
| 7042 | TGFB2 | ATC13 | Human | Thyroid | ATC | 6.16e-27 | 4.38e-01 | 0.34 |
| 7042 | TGFB2 | ATC2 | Human | Thyroid | ATC | 4.80e-21 | 1.61e+00 | 0.34 |
| 7042 | TGFB2 | ATC5 | Human | Thyroid | ATC | 1.93e-22 | 4.71e-01 | 0.34 |
| Page: 1 |
| Tissue | Expression Dynamics | Abbreviation |
| Liver |  | HCC: Hepatocellular carcinoma |
| NAFLD: Non-alcoholic fatty liver disease | ||
| Oral Cavity |  | EOLP: Erosive Oral lichen planus |
| LP: leukoplakia | ||
| NEOLP: Non-erosive oral lichen planus | ||
| OSCC: Oral squamous cell carcinoma | ||
| Prostate | 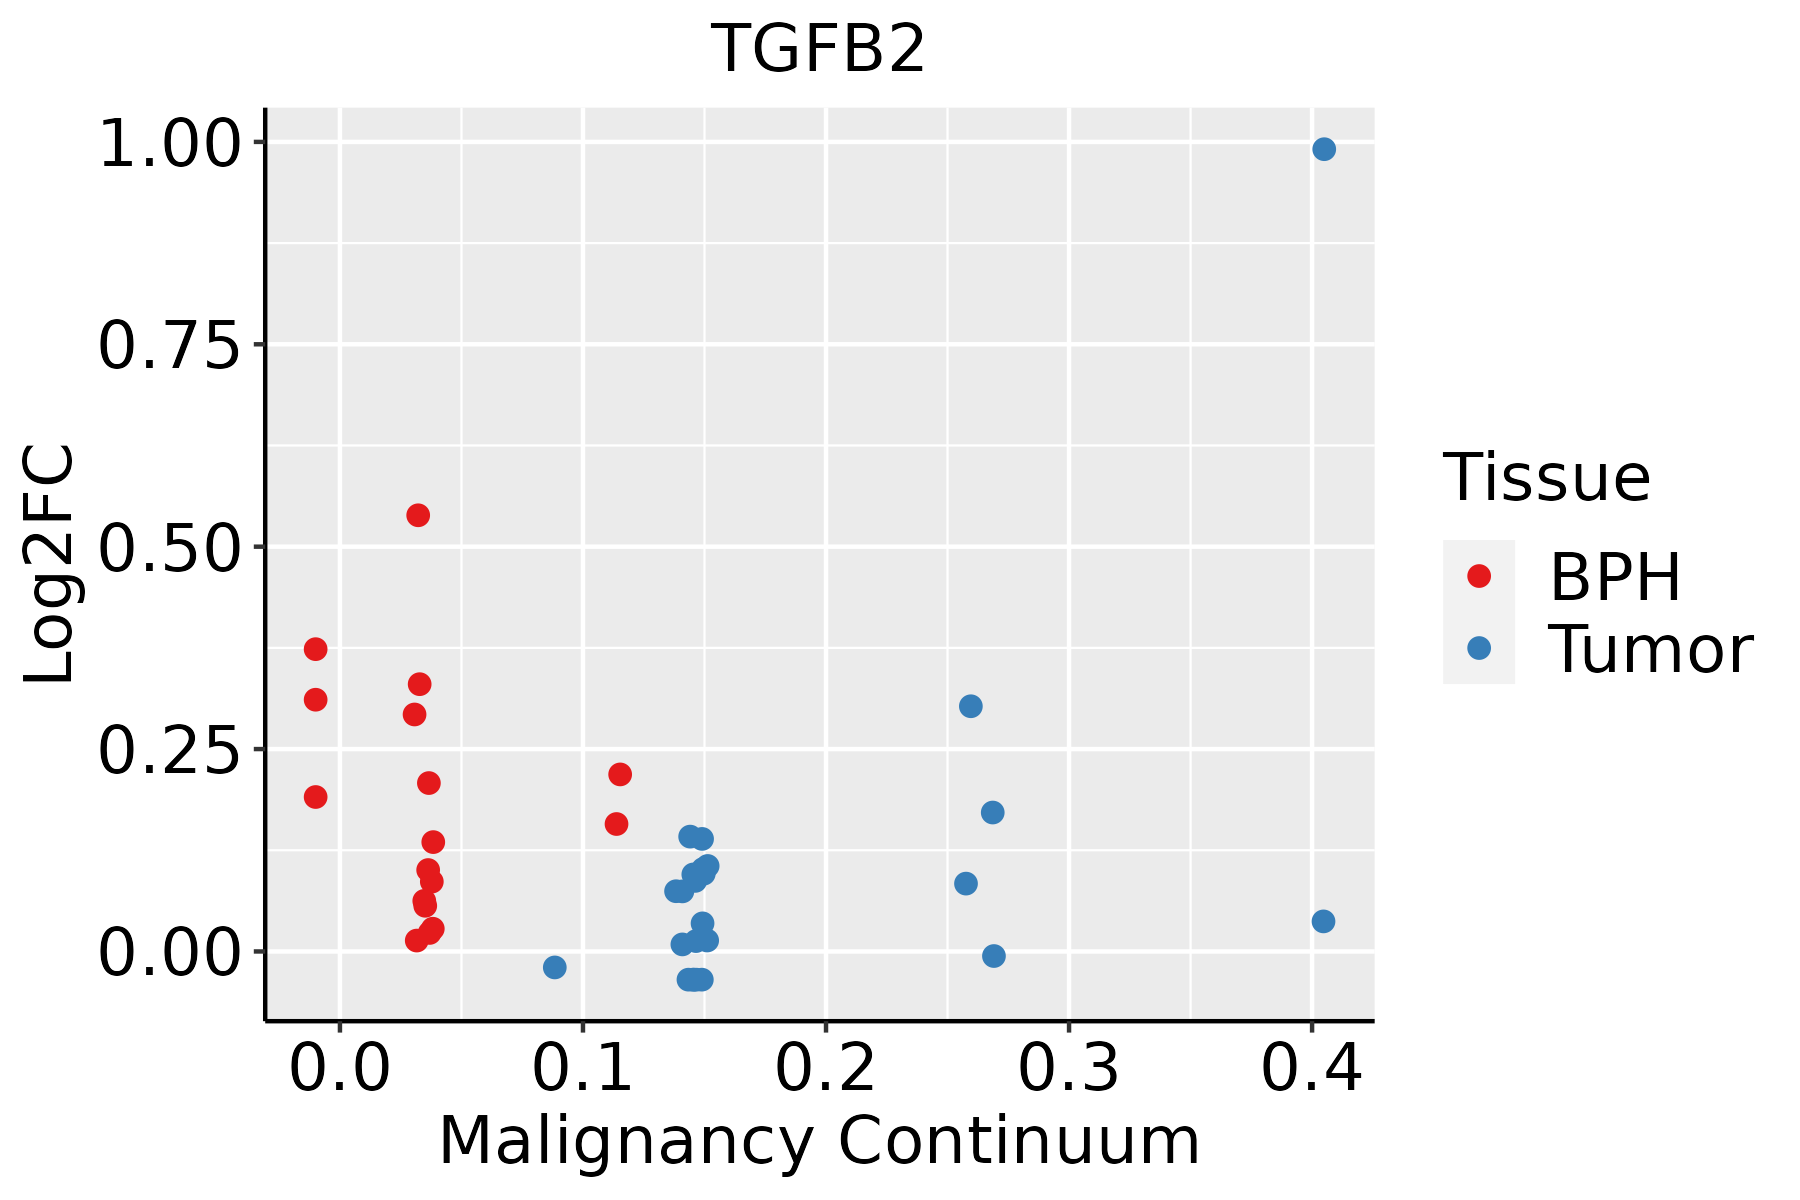 | BPH: Benign Prostatic Hyperplasia |
| Thyroid | 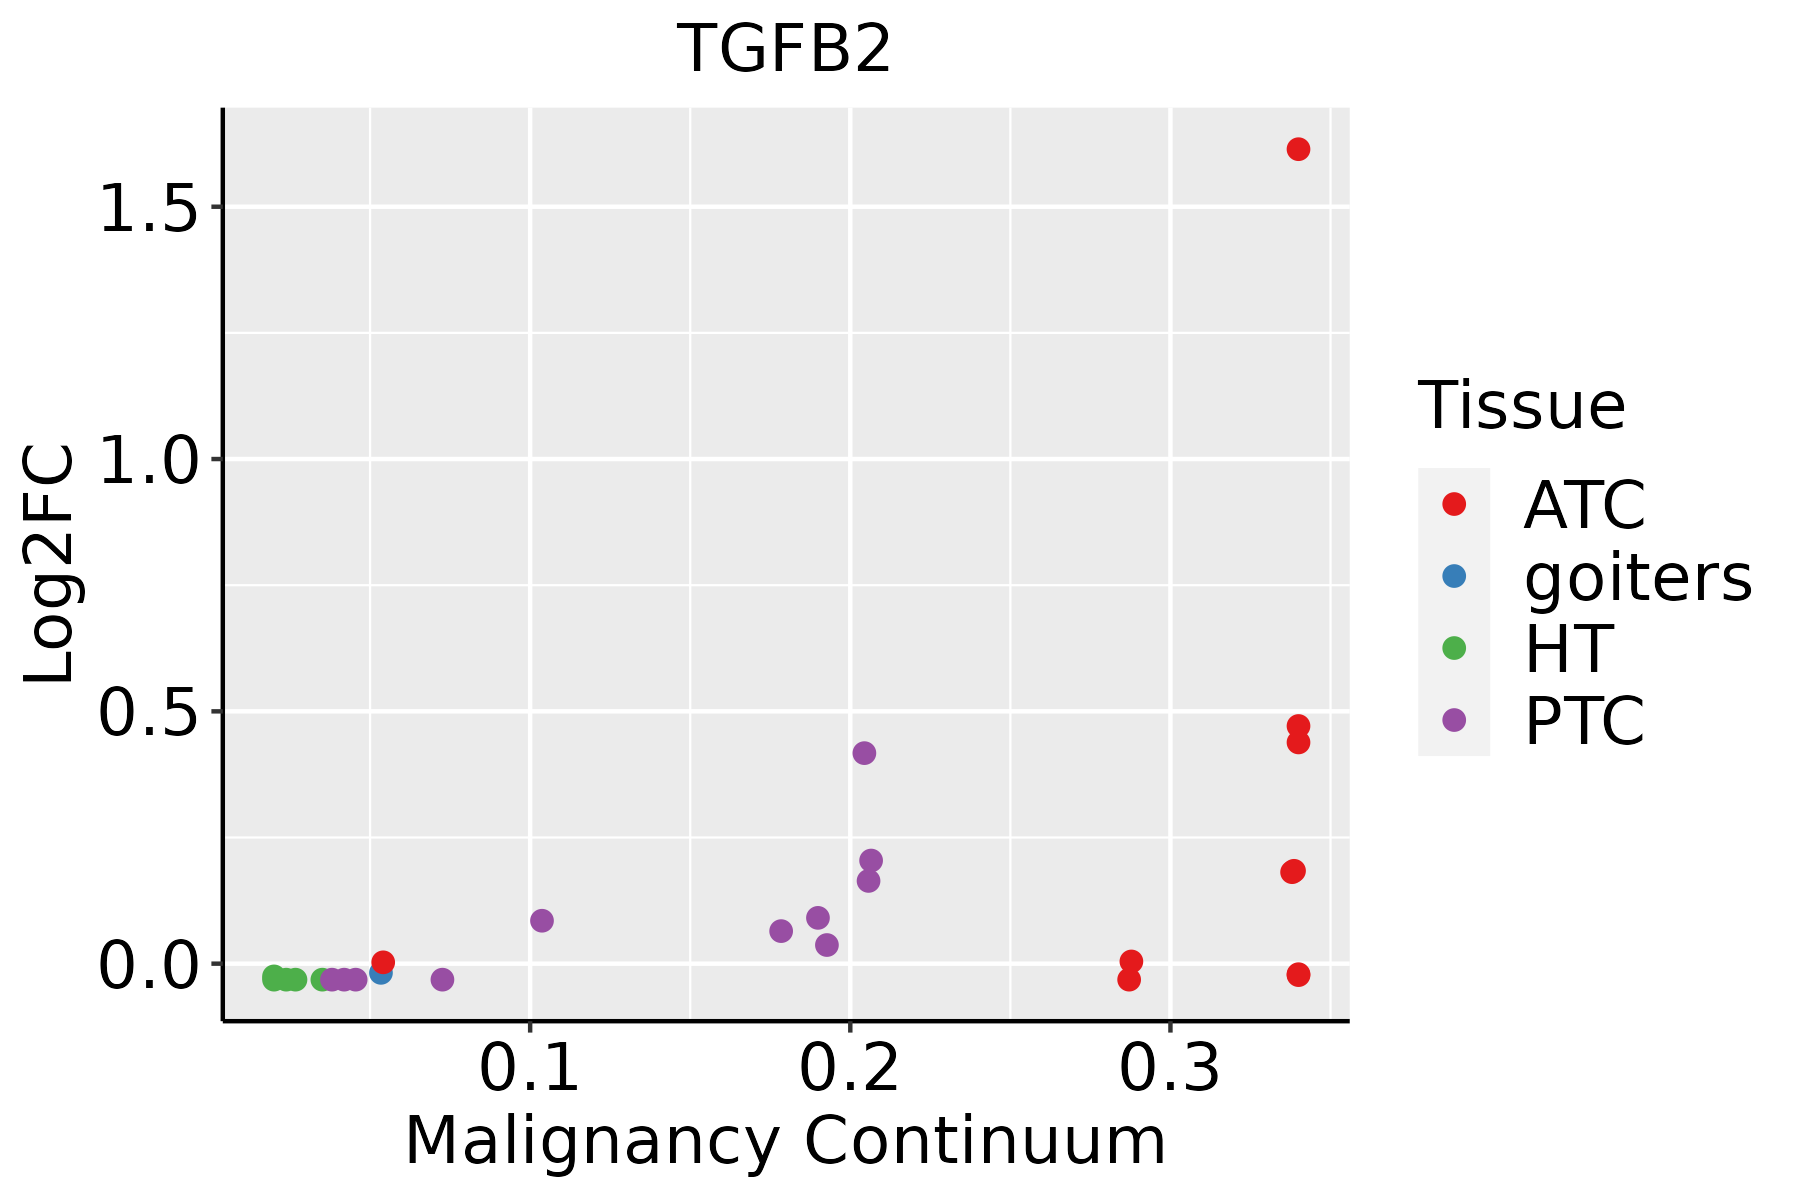 | ATC: Anaplastic thyroid cancer |
| HT: Hashimoto's thyroiditis | ||
| PTC: Papillary thyroid cancer |
| ∗log2FC in expression of this searched gene in stem-like cells from each diseased tissue sample relative to stem-like cells in normal samples in each tissue plotted against the malignancy continuum. Samples are colored based on if they are from different disease stage. |
Top |
Malignant transformation related pathway analysis |
| Find out the enriched GO biological processes and KEGG pathways involved in transition from healthy to precancer to cancer |
| Tissue | Disease Stage | Enriched GO biological Processes |
| Colorectum | AD |  |
| Colorectum | SER |  |
| Colorectum | MSS |  |
| Colorectum | MSI-H |  |
| Colorectum | FAP |  |
| ∗Top 15 enriched GO BP terms are showed in the bar plot of each disease state in each tissue. Each row represents a significant GO biological process which is colored according to the -log10(p.adjust). |
| Page: 1 2 3 4 5 6 7 8 9 |
| GO ID | Tissue | Disease Stage | Description | Gene Ratio | Bg Ratio | pvalue | p.adjust | Count |
| GO:190495122 | Liver | HCC | positive regulation of establishment of protein localization | 207/7958 | 319/18723 | 3.95e-16 | 3.29e-14 | 207 |
| GO:005122222 | Liver | HCC | positive regulation of protein transport | 194/7958 | 303/18723 | 2.41e-14 | 1.56e-12 | 194 |
| GO:001056322 | Liver | HCC | negative regulation of phosphorus metabolic process | 259/7958 | 442/18723 | 4.29e-12 | 1.92e-10 | 259 |
| GO:004593622 | Liver | HCC | negative regulation of phosphate metabolic process | 258/7958 | 441/18723 | 6.00e-12 | 2.60e-10 | 258 |
| GO:004854522 | Liver | HCC | response to steroid hormone | 206/7958 | 339/18723 | 6.81e-12 | 2.92e-10 | 206 |
| GO:009719122 | Liver | HCC | extrinsic apoptotic signaling pathway | 143/7958 | 219/18723 | 6.99e-12 | 2.97e-10 | 143 |
| GO:001604921 | Liver | HCC | cell growth | 269/7958 | 482/18723 | 1.84e-09 | 5.35e-08 | 269 |
| GO:004873222 | Liver | HCC | gland development | 242/7958 | 436/18723 | 2.26e-08 | 5.28e-07 | 242 |
| GO:190165422 | Liver | HCC | response to ketone | 119/7958 | 194/18723 | 8.65e-08 | 1.72e-06 | 119 |
| GO:001631121 | Liver | HCC | dephosphorylation | 230/7958 | 417/18723 | 1.00e-07 | 1.96e-06 | 230 |
| GO:000155821 | Liver | HCC | regulation of cell growth | 228/7958 | 414/18723 | 1.34e-07 | 2.55e-06 | 228 |
| GO:007099722 | Liver | HCC | neuron death | 202/7958 | 361/18723 | 1.44e-07 | 2.70e-06 | 202 |
| GO:190121412 | Liver | HCC | regulation of neuron death | 179/7958 | 319/18723 | 5.65e-07 | 9.01e-06 | 179 |
| GO:000941022 | Liver | HCC | response to xenobiotic stimulus | 248/7958 | 462/18723 | 6.47e-07 | 1.02e-05 | 248 |
| GO:000726521 | Liver | HCC | Ras protein signal transduction | 187/7958 | 337/18723 | 8.89e-07 | 1.35e-05 | 187 |
| GO:000166612 | Liver | HCC | response to hypoxia | 172/7958 | 307/18723 | 1.06e-06 | 1.59e-05 | 172 |
| GO:003629312 | Liver | HCC | response to decreased oxygen levels | 179/7958 | 322/18723 | 1.29e-06 | 1.87e-05 | 179 |
| GO:007048212 | Liver | HCC | response to oxygen levels | 191/7958 | 347/18723 | 1.42e-06 | 2.03e-05 | 191 |
| GO:003530312 | Liver | HCC | regulation of dephosphorylation | 80/7958 | 128/18723 | 3.85e-06 | 4.98e-05 | 80 |
| GO:004578711 | Liver | HCC | positive regulation of cell cycle | 172/7958 | 313/18723 | 5.29e-06 | 6.58e-05 | 172 |
| Page: 1 2 3 4 5 6 7 8 9 10 11 12 13 14 15 16 17 18 19 20 21 22 23 24 25 26 27 28 29 30 31 32 33 34 35 36 37 |
| Pathway ID | Tissue | Disease Stage | Description | Gene Ratio | Bg Ratio | pvalue | p.adjust | qvalue | Count |
| hsa0541522 | Liver | HCC | Diabetic cardiomyopathy | 151/4020 | 203/8465 | 2.72e-15 | 1.01e-13 | 5.63e-14 | 151 |
| hsa0516622 | Liver | HCC | Human T-cell leukemia virus 1 infection | 139/4020 | 222/8465 | 3.17e-06 | 2.79e-05 | 1.55e-05 | 139 |
| hsa052258 | Liver | HCC | Hepatocellular carcinoma | 106/4020 | 168/8465 | 2.87e-05 | 1.85e-04 | 1.03e-04 | 106 |
| hsa0520521 | Liver | HCC | Proteoglycans in cancer | 121/4020 | 205/8465 | 5.22e-04 | 2.18e-03 | 1.21e-03 | 121 |
| hsa049334 | Liver | HCC | AGE-RAGE signaling pathway in diabetic complications | 62/4020 | 100/8465 | 2.35e-03 | 7.95e-03 | 4.42e-03 | 62 |
| hsa05142 | Liver | HCC | Chagas disease | 61/4020 | 102/8465 | 8.04e-03 | 2.17e-02 | 1.21e-02 | 61 |
| hsa0541532 | Liver | HCC | Diabetic cardiomyopathy | 151/4020 | 203/8465 | 2.72e-15 | 1.01e-13 | 5.63e-14 | 151 |
| hsa0516632 | Liver | HCC | Human T-cell leukemia virus 1 infection | 139/4020 | 222/8465 | 3.17e-06 | 2.79e-05 | 1.55e-05 | 139 |
| hsa0522511 | Liver | HCC | Hepatocellular carcinoma | 106/4020 | 168/8465 | 2.87e-05 | 1.85e-04 | 1.03e-04 | 106 |
| hsa0520531 | Liver | HCC | Proteoglycans in cancer | 121/4020 | 205/8465 | 5.22e-04 | 2.18e-03 | 1.21e-03 | 121 |
| hsa0493311 | Liver | HCC | AGE-RAGE signaling pathway in diabetic complications | 62/4020 | 100/8465 | 2.35e-03 | 7.95e-03 | 4.42e-03 | 62 |
| hsa051421 | Liver | HCC | Chagas disease | 61/4020 | 102/8465 | 8.04e-03 | 2.17e-02 | 1.21e-02 | 61 |
| hsa041108 | Oral cavity | OSCC | Cell cycle | 118/3704 | 157/8465 | 7.15e-16 | 2.66e-14 | 1.35e-14 | 118 |
| hsa0516630 | Oral cavity | OSCC | Human T-cell leukemia virus 1 infection | 150/3704 | 222/8465 | 3.68e-13 | 7.26e-12 | 3.70e-12 | 150 |
| hsa0421820 | Oral cavity | OSCC | Cellular senescence | 112/3704 | 156/8465 | 8.04e-13 | 1.42e-11 | 7.21e-12 | 112 |
| hsa0521210 | Oral cavity | OSCC | Pancreatic cancer | 60/3704 | 76/8465 | 3.32e-10 | 4.45e-09 | 2.26e-09 | 60 |
| hsa0521018 | Oral cavity | OSCC | Colorectal cancer | 66/3704 | 86/8465 | 3.99e-10 | 4.95e-09 | 2.52e-09 | 66 |
| hsa0541529 | Oral cavity | OSCC | Diabetic cardiomyopathy | 131/3704 | 203/8465 | 1.33e-09 | 1.49e-08 | 7.57e-09 | 131 |
| hsa0520526 | Oral cavity | OSCC | Proteoglycans in cancer | 128/3704 | 205/8465 | 4.00e-08 | 3.12e-07 | 1.59e-07 | 128 |
| hsa0522018 | Oral cavity | OSCC | Chronic myeloid leukemia | 56/3704 | 76/8465 | 1.04e-07 | 7.43e-07 | 3.78e-07 | 56 |
| Page: 1 2 3 4 5 6 7 |
Top |
Cell-cell communication analysis |
| Identification of potential cell-cell interactions between two cell types and their ligand-receptor pairs for different disease states |
| Ligand | Receptor | LRpair | Pathway | Tissue | Disease Stage |
| TGFB2 | TGFbR1_R2 | TGFB2_TGFBR1_TGFBR2 | TGFb | Endometrium | ADJ |
| TGFB2 | TGFbR1_R2 | TGFB2_TGFBR1_TGFBR2 | TGFb | Lung | AAH |
| TGFB2 | TGFbR1_R2 | TGFB2_TGFBR1_TGFBR2 | TGFb | THCA | Cancer |
| TGFB2 | ACVR1B_TGFbR2 | TGFB2_ACVR1B_TGFBR2 | TGFb | THCA | Cancer |
| TGFB2 | ACVR1_TGFbR | TGFB2_ACVR1_TGFBR1 | TGFb | THCA | Cancer |
| Page: 1 |
Top |
Single-cell gene regulatory network inference analysis |
| Find out the significant the regulons (TFs) and the target genes of each regulon across cell types for different disease states |
| TF | Cell Type | Tissue | Disease Stage | Target Gene | RSS | Regulon Activity |
| ∗The dot plots of a searched regulon are shown for all cell subpopulations in each disease state of each tissue based on the regulon specific score inferred using pySCENIC and by calculating the average expression. |
| Page: 1 |
Top |
Somatic mutation of malignant transformation related genes |
| Annotation of somatic variants for genes involved in malignant transformation |
| Hugo Symbol | Variant Class | Variant Classification | dbSNP RS | HGVSc | HGVSp | HGVSp Short | SWISSPROT | BIOTYPE | SIFT | PolyPhen | Tumor Sample Barcode | Tissue | Histology | Sex | Age | Stage | Therapy Types | Drugs | Outcome |
| TGFB2 | SNV | Missense_Mutation | novel | c.613T>G | p.Leu205Val | p.L205V | P61812 | protein_coding | tolerated(0.5) | benign(0.009) | TCGA-AN-A046-01 | Breast | breast invasive carcinoma | Female | >=65 | I/II | Unknown | Unknown | SD |
| TGFB2 | SNV | Missense_Mutation | c.688G>A | p.Asp230Asn | p.D230N | P61812 | protein_coding | deleterious(0) | probably_damaging(0.983) | TCGA-2W-A8YY-01 | Cervix | cervical & endocervical cancer | Female | <65 | I/II | Chemotherapy | cisplatin | CR | |
| TGFB2 | insertion | Frame_Shift_Ins | novel | c.156_157insC | p.Glu55ArgfsTer5 | p.E55Rfs*5 | P61812 | protein_coding | TCGA-C5-A7CG-01 | Cervix | cervical & endocervical cancer | Female | <65 | I/II | Unknown | Unknown | SD | ||
| TGFB2 | SNV | Missense_Mutation | c.915N>T | p.Lys305Asn | p.K305N | P61812 | protein_coding | tolerated(0.16) | benign(0.02) | TCGA-A6-4107-01 | Colorectum | colon adenocarcinoma | Female | <65 | III/IV | Chemotherapy | 5 | SD | |
| TGFB2 | SNV | Missense_Mutation | c.403N>A | p.Gln135Lys | p.Q135K | P61812 | protein_coding | tolerated(0.59) | benign(0) | TCGA-AA-3831-01 | Colorectum | colon adenocarcinoma | Male | >=65 | I/II | Unknown | Unknown | SD | |
| TGFB2 | SNV | Missense_Mutation | c.224G>T | p.Arg75Met | p.R75M | P61812 | protein_coding | deleterious(0) | probably_damaging(0.996) | TCGA-AA-3864-01 | Colorectum | colon adenocarcinoma | Male | >=65 | I/II | Unknown | Unknown | SD | |
| TGFB2 | SNV | Missense_Mutation | rs766536496 | c.640G>A | p.Asp214Asn | p.D214N | P61812 | protein_coding | tolerated(0.29) | benign(0.021) | TCGA-AA-3977-01 | Colorectum | colon adenocarcinoma | Male | >=65 | I/II | Unknown | Unknown | SD |
| TGFB2 | SNV | Missense_Mutation | novel | c.1150N>G | p.Ser384Ala | p.S384A | P61812 | protein_coding | tolerated(1) | benign(0.005) | TCGA-CA-6717-01 | Colorectum | colon adenocarcinoma | Male | <65 | I/II | Chemotherapy | oxaliplatin | CR |
| TGFB2 | SNV | Missense_Mutation | c.665N>A | p.Ala222Glu | p.A222E | P61812 | protein_coding | tolerated(0.21) | benign(0.025) | TCGA-D5-6930-01 | Colorectum | colon adenocarcinoma | Male | >=65 | I/II | Unknown | Unknown | SD | |
| TGFB2 | SNV | Missense_Mutation | c.956T>C | p.Leu319Pro | p.L319P | P61812 | protein_coding | deleterious(0.01) | probably_damaging(0.986) | TCGA-DM-A280-01 | Colorectum | colon adenocarcinoma | Female | >=65 | I/II | Unknown | Unknown | SD |
| Page: 1 2 3 4 5 6 7 |
Top |
Related drugs of malignant transformation related genes |
| Identification of chemicals and drugs interact with genes involved in malignant transfromation |
| (DGIdb 4.0) |
| Entrez ID | Symbol | Category | Interaction Types | Drug Claim Name | Drug Name | PMIDs |
| 7042 | TGFB2 | GROWTH FACTOR, TRANSCRIPTION FACTOR, DRUGGABLE GENOME | FANG vaccine | |||
| 7042 | TGFB2 | GROWTH FACTOR, TRANSCRIPTION FACTOR, DRUGGABLE GENOME | LERDELIMUMAB | LERDELIMUMAB | ||
| 7042 | TGFB2 | GROWTH FACTOR, TRANSCRIPTION FACTOR, DRUGGABLE GENOME | TRABEDERSEN | TRABEDERSEN | ||
| 7042 | TGFB2 | GROWTH FACTOR, TRANSCRIPTION FACTOR, DRUGGABLE GENOME | BELAGENPUMATUCEL-L | BELAGENPUMATUCEL-L | ||
| 7042 | TGFB2 | GROWTH FACTOR, TRANSCRIPTION FACTOR, DRUGGABLE GENOME | antibody | FRESOLIMUMAB | FRESOLIMUMAB | |
| 7042 | TGFB2 | GROWTH FACTOR, TRANSCRIPTION FACTOR, DRUGGABLE GENOME | AP12009 | |||
| 7042 | TGFB2 | GROWTH FACTOR, TRANSCRIPTION FACTOR, DRUGGABLE GENOME | inhibitor | CHEMBL1743022 | FRESOLIMUMAB | |
| 7042 | TGFB2 | GROWTH FACTOR, TRANSCRIPTION FACTOR, DRUGGABLE GENOME | inhibitor | CHEMBL2108967 | LERDELIMUMAB |
| Page: 1 |

Copyright 2023-Present -The University of Texas Health Science Center at Houston |