
|
|||||
|
 | |
| |
| |
| |
| |
| |
|
Gene: TFR2 |
Gene summary for TFR2 |
| Gene information | Species | Human | Gene symbol | TFR2 | Gene ID | 7036 |
| Gene name | transferrin receptor 2 | |
| Gene Alias | HFE3 | |
| Cytomap | 7q22.1 | |
| Gene Type | protein-coding | GO ID | GO:0000041 | UniProtAcc | Q9UP52 |
Top |
Malignant transformation analysis |
| Identification of the aberrant gene expression in precancerous and cancerous lesions by comparing the gene expression of stem-like cells in diseased tissues with normal stem cells |
| Entrez ID | Symbol | Replicates | Species | Organ | Tissue | Adj P-value | Log2FC | Malignancy |
| 7036 | TFR2 | NAFLD1 | Human | Liver | NAFLD | 3.35e-13 | 1.14e+00 | -0.04 |
| 7036 | TFR2 | S43 | Human | Liver | Cirrhotic | 1.45e-04 | -9.61e-02 | -0.0187 |
| 7036 | TFR2 | HCC1_Meng | Human | Liver | HCC | 1.07e-84 | 4.16e-01 | 0.0246 |
| 7036 | TFR2 | HCC2_Meng | Human | Liver | HCC | 1.07e-08 | -2.47e-01 | 0.0107 |
| 7036 | TFR2 | HCC1 | Human | Liver | HCC | 1.11e-05 | 3.34e+00 | 0.5336 |
| 7036 | TFR2 | HCC2 | Human | Liver | HCC | 4.17e-18 | 4.21e+00 | 0.5341 |
| 7036 | TFR2 | Pt13.b | Human | Liver | HCC | 1.46e-18 | 2.26e-01 | 0.0251 |
| 7036 | TFR2 | Pt14.b | Human | Liver | HCC | 5.96e-10 | 4.43e-01 | 0.018 |
| 7036 | TFR2 | S015 | Human | Liver | HCC | 3.55e-08 | 9.61e-01 | 0.2375 |
| 7036 | TFR2 | S027 | Human | Liver | HCC | 1.67e-17 | 3.26e+00 | 0.2446 |
| 7036 | TFR2 | S028 | Human | Liver | HCC | 5.43e-61 | 3.70e+00 | 0.2503 |
| 7036 | TFR2 | S029 | Human | Liver | HCC | 2.39e-52 | 3.78e+00 | 0.2581 |
| Page: 1 |
| Tissue | Expression Dynamics | Abbreviation |
| Liver | 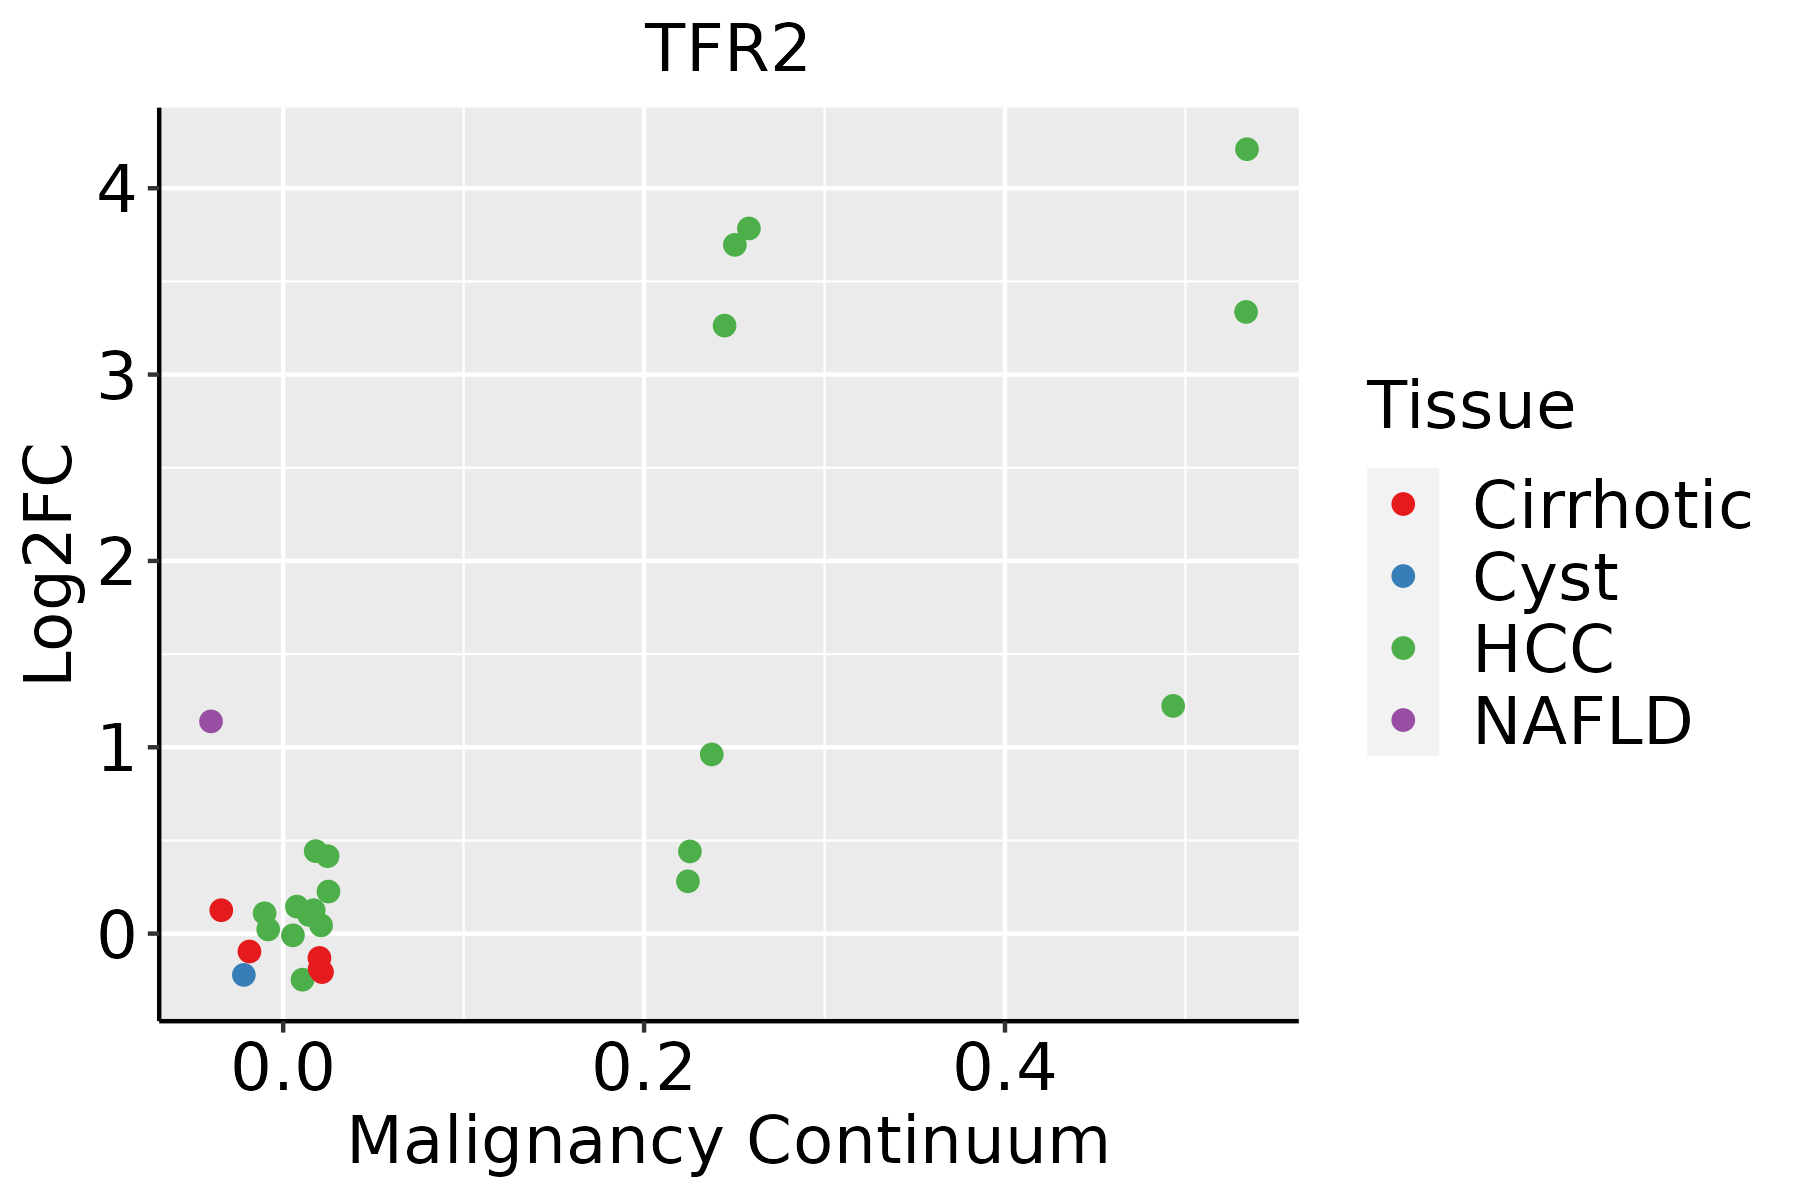 | HCC: Hepatocellular carcinoma |
| NAFLD: Non-alcoholic fatty liver disease |
| ∗log2FC in expression of this searched gene in stem-like cells from each diseased tissue sample relative to stem-like cells in normal samples in each tissue plotted against the malignancy continuum. Samples are colored based on if they are from different disease stage. |
Top |
Malignant transformation related pathway analysis |
| Find out the enriched GO biological processes and KEGG pathways involved in transition from healthy to precancer to cancer |
| Tissue | Disease Stage | Enriched GO biological Processes |
| Colorectum | AD |  |
| Colorectum | SER |  |
| Colorectum | MSS |  |
| Colorectum | MSI-H |  |
| Colorectum | FAP |  |
| ∗Top 15 enriched GO BP terms are showed in the bar plot of each disease state in each tissue. Each row represents a significant GO biological process which is colored according to the -log10(p.adjust). |
| Page: 1 2 3 4 5 6 7 8 9 |
| GO ID | Tissue | Disease Stage | Description | Gene Ratio | Bg Ratio | pvalue | p.adjust | Count |
| GO:00068984 | Liver | NAFLD | receptor-mediated endocytosis | 49/1882 | 244/18723 | 1.80e-06 | 7.78e-05 | 49 |
| GO:00458074 | Liver | NAFLD | positive regulation of endocytosis | 25/1882 | 100/18723 | 1.34e-05 | 3.97e-04 | 25 |
| GO:0002526 | Liver | NAFLD | acute inflammatory response | 26/1882 | 112/18723 | 3.68e-05 | 9.23e-04 | 26 |
| GO:00100387 | Liver | NAFLD | response to metal ion | 62/1882 | 373/18723 | 5.05e-05 | 1.19e-03 | 62 |
| GO:0006953 | Liver | NAFLD | acute-phase response | 13/1882 | 49/18723 | 8.43e-04 | 1.03e-02 | 13 |
| GO:00335723 | Liver | NAFLD | transferrin transport | 5/1882 | 10/18723 | 1.67e-03 | 1.74e-02 | 5 |
| GO:00301005 | Liver | NAFLD | regulation of endocytosis | 35/1882 | 211/18723 | 2.09e-03 | 2.06e-02 | 35 |
| GO:00902764 | Liver | NAFLD | regulation of peptide hormone secretion | 32/1882 | 196/18723 | 4.06e-03 | 3.40e-02 | 32 |
| GO:00068262 | Liver | NAFLD | iron ion transport | 13/1882 | 58/18723 | 4.32e-03 | 3.55e-02 | 13 |
| GO:00027914 | Liver | NAFLD | regulation of peptide secretion | 32/1882 | 200/18723 | 5.53e-03 | 4.23e-02 | 32 |
| GO:00900874 | Liver | NAFLD | regulation of peptide transport | 32/1882 | 202/18723 | 6.42e-03 | 4.69e-02 | 32 |
| GO:00902771 | Liver | NAFLD | positive regulation of peptide hormone secretion | 19/1882 | 103/18723 | 6.58e-03 | 4.69e-02 | 19 |
| GO:001003812 | Liver | Cirrhotic | response to metal ion | 150/4634 | 373/18723 | 2.27e-11 | 1.37e-09 | 150 |
| GO:00516046 | Liver | Cirrhotic | protein maturation | 121/4634 | 294/18723 | 3.54e-10 | 1.68e-08 | 121 |
| GO:00550766 | Liver | Cirrhotic | transition metal ion homeostasis | 59/4634 | 138/18723 | 2.59e-06 | 4.65e-05 | 59 |
| GO:000689811 | Liver | Cirrhotic | receptor-mediated endocytosis | 91/4634 | 244/18723 | 8.13e-06 | 1.22e-04 | 91 |
| GO:00469164 | Liver | Cirrhotic | cellular transition metal ion homeostasis | 48/4634 | 115/18723 | 4.51e-05 | 5.30e-04 | 48 |
| GO:00712487 | Liver | Cirrhotic | cellular response to metal ion | 73/4634 | 197/18723 | 7.73e-05 | 8.54e-04 | 73 |
| GO:00712417 | Liver | Cirrhotic | cellular response to inorganic substance | 81/4634 | 226/18723 | 1.21e-04 | 1.20e-03 | 81 |
| GO:003010011 | Liver | Cirrhotic | regulation of endocytosis | 74/4634 | 211/18723 | 4.86e-04 | 3.90e-03 | 74 |
| Page: 1 2 3 |
| Pathway ID | Tissue | Disease Stage | Description | Gene Ratio | Bg Ratio | pvalue | p.adjust | qvalue | Count |
| Page: 1 |
Top |
Cell-cell communication analysis |
| Identification of potential cell-cell interactions between two cell types and their ligand-receptor pairs for different disease states |
| Ligand | Receptor | LRpair | Pathway | Tissue | Disease Stage |
| Page: 1 |
Top |
Single-cell gene regulatory network inference analysis |
| Find out the significant the regulons (TFs) and the target genes of each regulon across cell types for different disease states |
| TF | Cell Type | Tissue | Disease Stage | Target Gene | RSS | Regulon Activity |
| ∗The dot plots of a searched regulon are shown for all cell subpopulations in each disease state of each tissue based on the regulon specific score inferred using pySCENIC and by calculating the average expression. |
| Page: 1 |
Top |
Somatic mutation of malignant transformation related genes |
| Annotation of somatic variants for genes involved in malignant transformation |
| Hugo Symbol | Variant Class | Variant Classification | dbSNP RS | HGVSc | HGVSp | HGVSp Short | SWISSPROT | BIOTYPE | SIFT | PolyPhen | Tumor Sample Barcode | Tissue | Histology | Sex | Age | Stage | Therapy Types | Drugs | Outcome |
| TFR2 | SNV | Missense_Mutation | novel | c.27G>C | p.Gln9His | p.Q9H | Q9UP52 | protein_coding | tolerated_low_confidence(0.09) | benign(0) | TCGA-3C-AALI-01 | Breast | breast invasive carcinoma | Female | <65 | I/II | Unspecific | Poly E | Complete Response |
| TFR2 | SNV | Missense_Mutation | c.53N>A | p.Ser18Tyr | p.S18Y | Q9UP52 | protein_coding | deleterious_low_confidence(0.04) | benign(0.01) | TCGA-AR-A1AH-01 | Breast | breast invasive carcinoma | Female | <65 | I/II | Unspecific | PD | ||
| TFR2 | SNV | Missense_Mutation | c.2083T>C | p.Ser695Pro | p.S695P | Q9UP52 | protein_coding | deleterious(0) | probably_damaging(0.999) | TCGA-E2-A1LS-01 | Breast | breast invasive carcinoma | Female | <65 | I/II | Unspecific | Cyclophosphamide | SD | |
| TFR2 | SNV | Missense_Mutation | c.2316N>A | p.Phe772Leu | p.F772L | Q9UP52 | protein_coding | tolerated(0.61) | benign(0.027) | TCGA-EK-A2PG-01 | Cervix | cervical & endocervical cancer | Female | >=65 | I/II | Unknown | Unknown | SD | |
| TFR2 | SNV | Missense_Mutation | rs750603454 | c.89N>A | p.Arg30Gln | p.R30Q | Q9UP52 | protein_coding | tolerated_low_confidence(1) | benign(0) | TCGA-VS-A9UI-01 | Cervix | cervical & endocervical cancer | Female | >=65 | I/II | Unknown | Unknown | SD |
| TFR2 | SNV | Missense_Mutation | c.1980N>A | p.Phe660Leu | p.F660L | Q9UP52 | protein_coding | deleterious(0.04) | benign(0.039) | TCGA-AA-3510-01 | Colorectum | colon adenocarcinoma | Male | >=65 | I/II | Unknown | Unknown | SD | |
| TFR2 | SNV | Missense_Mutation | novel | c.512N>A | p.Gly171Glu | p.G171E | Q9UP52 | protein_coding | tolerated(1) | benign(0.009) | TCGA-AA-A00N-01 | Colorectum | colon adenocarcinoma | Male | >=65 | I/II | Unknown | Unknown | PD |
| TFR2 | SNV | Missense_Mutation | c.2245C>T | p.Arg749Trp | p.R749W | Q9UP52 | protein_coding | deleterious(0) | possibly_damaging(0.825) | TCGA-AA-A02Y-01 | Colorectum | colon adenocarcinoma | Male | >=65 | I/II | Unknown | Unknown | SD | |
| TFR2 | SNV | Missense_Mutation | c.1724N>T | p.Thr575Met | p.T575M | Q9UP52 | protein_coding | deleterious(0.03) | probably_damaging(0.998) | TCGA-AD-5900-01 | Colorectum | colon adenocarcinoma | Male | >=65 | I/II | Unknown | Unknown | SD | |
| TFR2 | SNV | Missense_Mutation | novel | c.881N>A | p.Gly294Glu | p.G294E | Q9UP52 | protein_coding | deleterious(0) | probably_damaging(1) | TCGA-AZ-4315-01 | Colorectum | colon adenocarcinoma | Male | <65 | I/II | Unknown | Unknown | SD |
| Page: 1 2 3 4 5 6 |
Top |
Related drugs of malignant transformation related genes |
| Identification of chemicals and drugs interact with genes involved in malignant transfromation |
| (DGIdb 4.0) |
| Entrez ID | Symbol | Category | Interaction Types | Drug Claim Name | Drug Name | PMIDs |
| Page: 1 |

Copyright 2023-Present -The University of Texas Health Science Center at Houston |