
|
|||||
|
 | |
| |
| |
| |
| |
| |
|
Gene: TFPT |
Gene summary for TFPT |
| Gene information | Species | Human | Gene symbol | TFPT | Gene ID | 29844 |
| Gene name | TCF3 fusion partner | |
| Gene Alias | FB1 | |
| Cytomap | 19q13.42 | |
| Gene Type | protein-coding | GO ID | GO:0006139 | UniProtAcc | P0C1Z6 |
Top |
Malignant transformation analysis |
| Identification of the aberrant gene expression in precancerous and cancerous lesions by comparing the gene expression of stem-like cells in diseased tissues with normal stem cells |
| Entrez ID | Symbol | Replicates | Species | Organ | Tissue | Adj P-value | Log2FC | Malignancy |
| 29844 | TFPT | LZE4T | Human | Esophagus | ESCC | 7.24e-08 | 1.99e-01 | 0.0811 |
| 29844 | TFPT | LZE7T | Human | Esophagus | ESCC | 3.67e-06 | 3.84e-01 | 0.0667 |
| 29844 | TFPT | LZE24T | Human | Esophagus | ESCC | 4.15e-08 | 1.50e-01 | 0.0596 |
| 29844 | TFPT | LZE6T | Human | Esophagus | ESCC | 6.15e-03 | 2.49e-01 | 0.0845 |
| 29844 | TFPT | P1T-E | Human | Esophagus | ESCC | 2.18e-02 | 3.20e-01 | 0.0875 |
| 29844 | TFPT | P2T-E | Human | Esophagus | ESCC | 1.38e-18 | 9.79e-02 | 0.1177 |
| 29844 | TFPT | P4T-E | Human | Esophagus | ESCC | 4.27e-28 | 6.38e-01 | 0.1323 |
| 29844 | TFPT | P5T-E | Human | Esophagus | ESCC | 2.33e-08 | 4.15e-02 | 0.1327 |
| 29844 | TFPT | P8T-E | Human | Esophagus | ESCC | 8.88e-75 | 1.12e+00 | 0.0889 |
| 29844 | TFPT | P10T-E | Human | Esophagus | ESCC | 8.44e-45 | 6.73e-01 | 0.116 |
| 29844 | TFPT | P11T-E | Human | Esophagus | ESCC | 3.78e-03 | 1.75e-01 | 0.1426 |
| 29844 | TFPT | P12T-E | Human | Esophagus | ESCC | 1.25e-11 | 1.63e-01 | 0.1122 |
| 29844 | TFPT | P15T-E | Human | Esophagus | ESCC | 1.51e-11 | 2.27e-01 | 0.1149 |
| 29844 | TFPT | P16T-E | Human | Esophagus | ESCC | 3.96e-14 | 1.65e-01 | 0.1153 |
| 29844 | TFPT | P17T-E | Human | Esophagus | ESCC | 2.09e-03 | 1.92e-01 | 0.1278 |
| 29844 | TFPT | P20T-E | Human | Esophagus | ESCC | 9.04e-07 | 1.82e-01 | 0.1124 |
| 29844 | TFPT | P21T-E | Human | Esophagus | ESCC | 1.40e-08 | 1.04e-01 | 0.1617 |
| 29844 | TFPT | P22T-E | Human | Esophagus | ESCC | 4.73e-17 | 2.18e-01 | 0.1236 |
| 29844 | TFPT | P23T-E | Human | Esophagus | ESCC | 4.27e-06 | 8.66e-02 | 0.108 |
| 29844 | TFPT | P24T-E | Human | Esophagus | ESCC | 1.21e-10 | 9.40e-02 | 0.1287 |
| Page: 1 2 3 4 5 |
| Tissue | Expression Dynamics | Abbreviation |
| Esophagus |  | ESCC: Esophageal squamous cell carcinoma |
| HGIN: High-grade intraepithelial neoplasias | ||
| LGIN: Low-grade intraepithelial neoplasias | ||
| Oral Cavity | 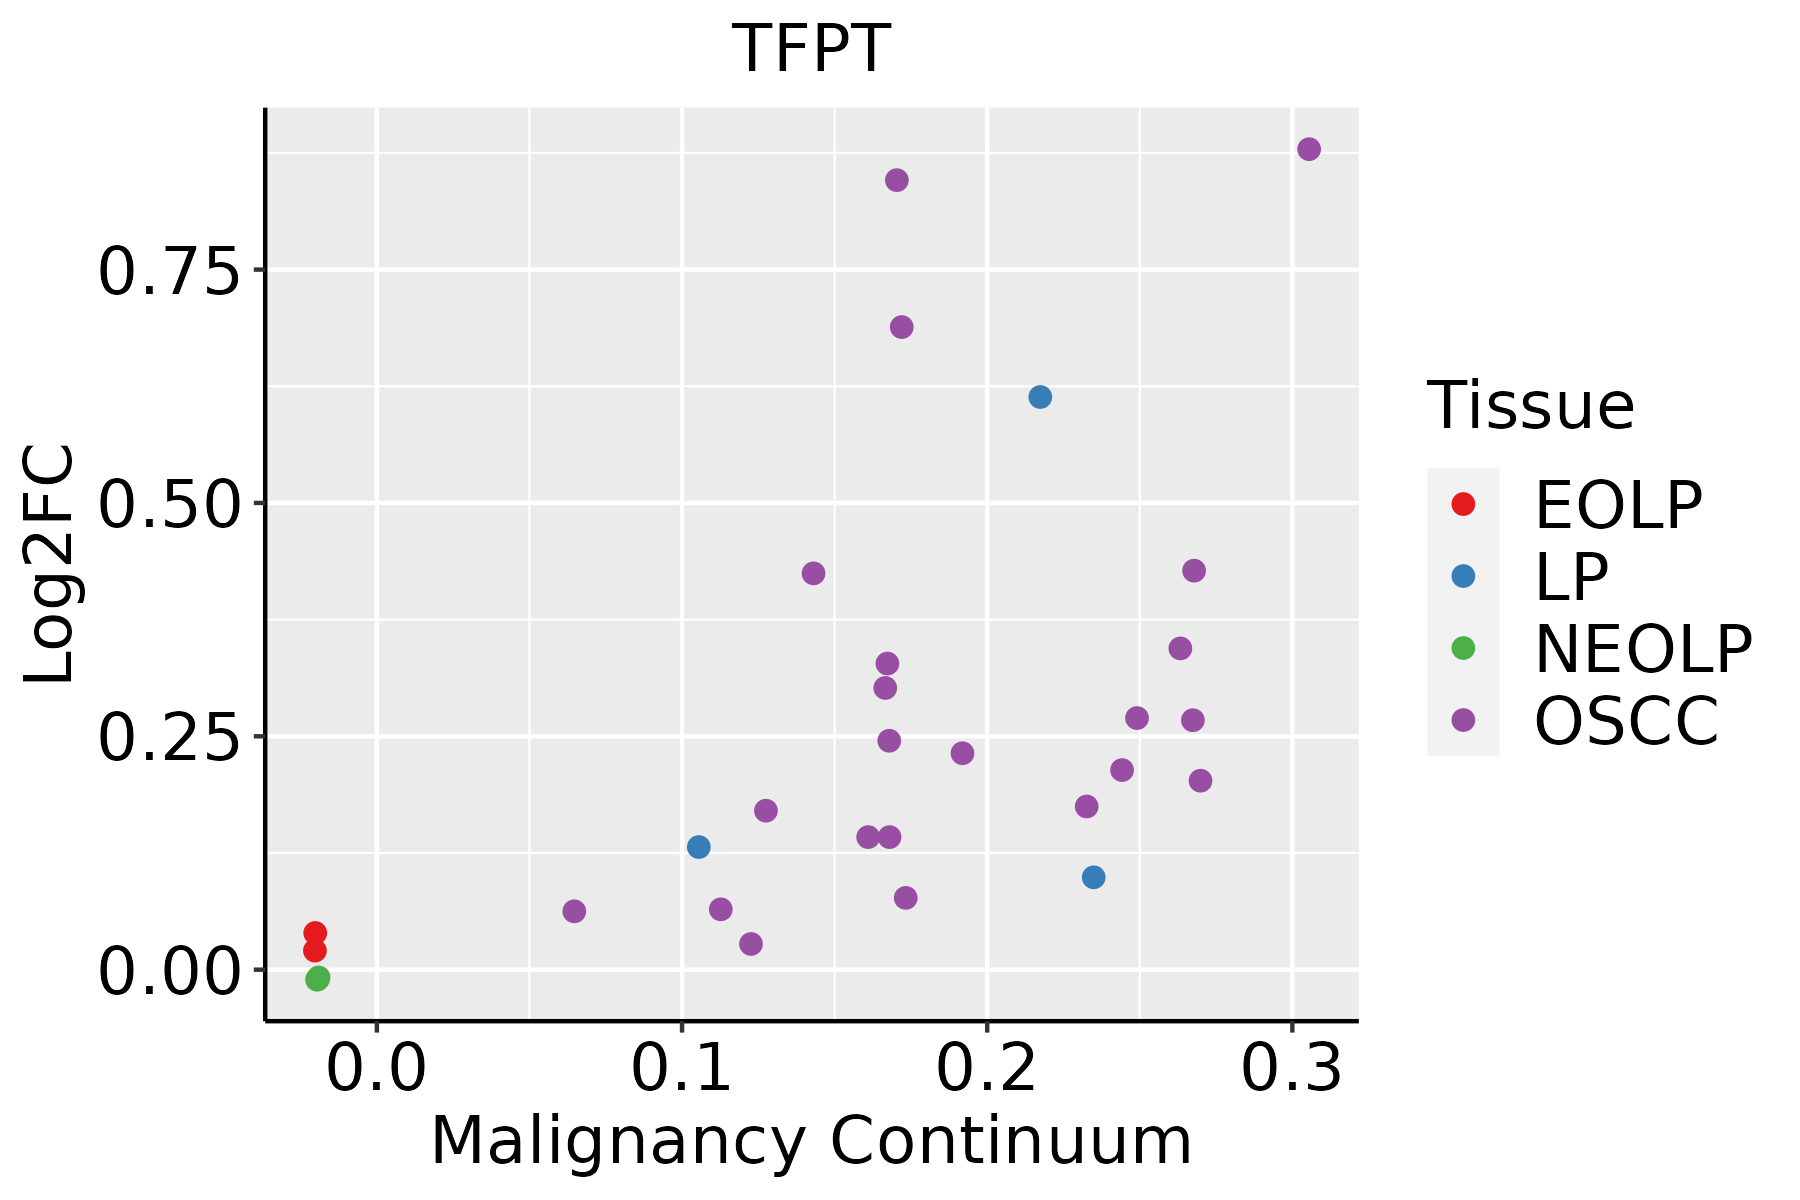 | EOLP: Erosive Oral lichen planus |
| LP: leukoplakia | ||
| NEOLP: Non-erosive oral lichen planus | ||
| OSCC: Oral squamous cell carcinoma | ||
| Prostate |  | BPH: Benign Prostatic Hyperplasia |
| Thyroid | 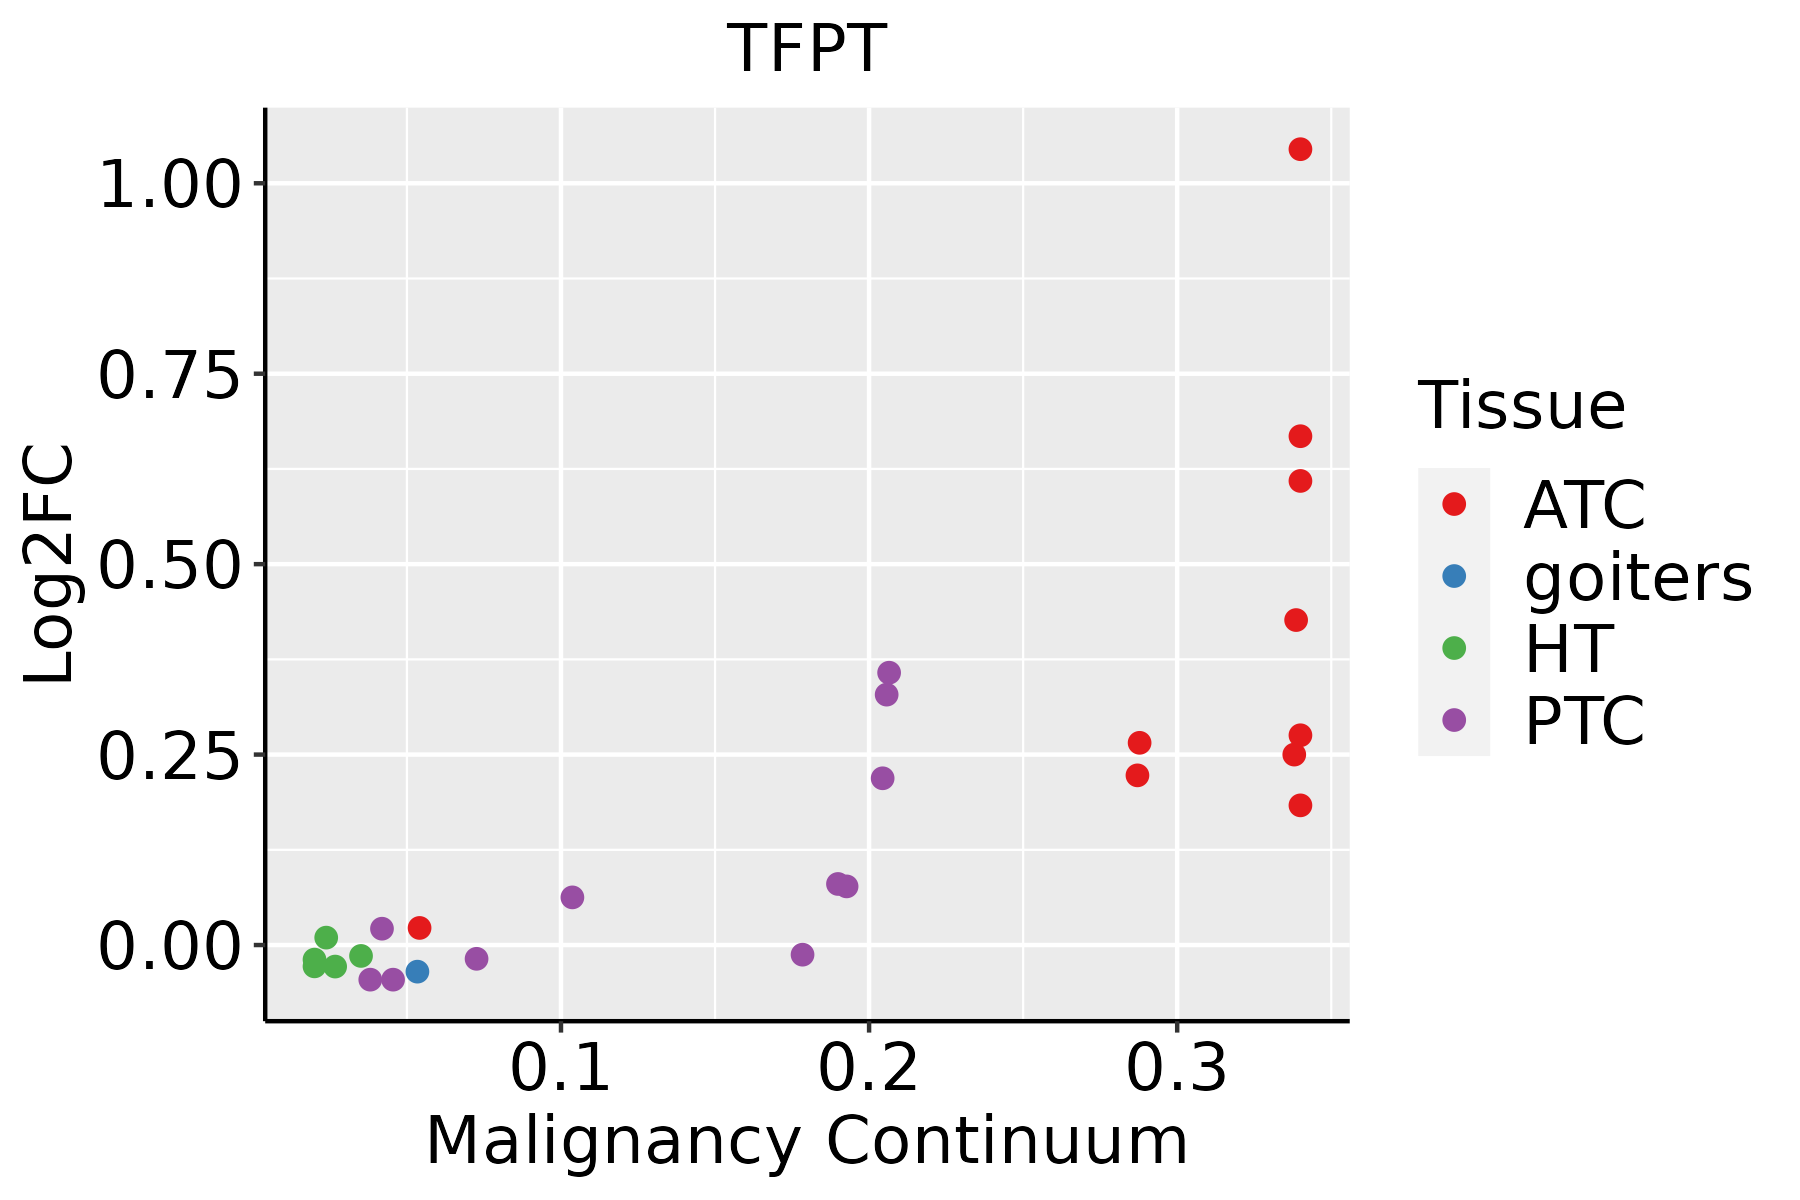 | ATC: Anaplastic thyroid cancer |
| HT: Hashimoto's thyroiditis | ||
| PTC: Papillary thyroid cancer |
| ∗log2FC in expression of this searched gene in stem-like cells from each diseased tissue sample relative to stem-like cells in normal samples in each tissue plotted against the malignancy continuum. Samples are colored based on if they are from different disease stage. |
Top |
Malignant transformation related pathway analysis |
| Find out the enriched GO biological processes and KEGG pathways involved in transition from healthy to precancer to cancer |
| Tissue | Disease Stage | Enriched GO biological Processes |
| Colorectum | AD |  |
| Colorectum | SER |  |
| Colorectum | MSS |  |
| Colorectum | MSI-H |  |
| Colorectum | FAP |  |
| ∗Top 15 enriched GO BP terms are showed in the bar plot of each disease state in each tissue. Each row represents a significant GO biological process which is colored according to the -log10(p.adjust). |
| Page: 1 2 3 4 5 6 7 8 9 |
| GO ID | Tissue | Disease Stage | Description | Gene Ratio | Bg Ratio | pvalue | p.adjust | Count |
| GO:00063101 | Esophagus | ESCC | DNA recombination | 168/8552 | 305/18723 | 5.58e-04 | 3.05e-03 | 168 |
| GO:0006310 | Oral cavity | OSCC | DNA recombination | 147/7305 | 305/18723 | 6.33e-04 | 3.56e-03 | 147 |
| Page: 1 |
| Pathway ID | Tissue | Disease Stage | Description | Gene Ratio | Bg Ratio | pvalue | p.adjust | qvalue | Count |
| Page: 1 |
Top |
Cell-cell communication analysis |
| Identification of potential cell-cell interactions between two cell types and their ligand-receptor pairs for different disease states |
| Ligand | Receptor | LRpair | Pathway | Tissue | Disease Stage |
| Page: 1 |
Top |
Single-cell gene regulatory network inference analysis |
| Find out the significant the regulons (TFs) and the target genes of each regulon across cell types for different disease states |
| TF | Cell Type | Tissue | Disease Stage | Target Gene | RSS | Regulon Activity |
| ∗The dot plots of a searched regulon are shown for all cell subpopulations in each disease state of each tissue based on the regulon specific score inferred using pySCENIC and by calculating the average expression. |
| Page: 1 |
Top |
Somatic mutation of malignant transformation related genes |
| Annotation of somatic variants for genes involved in malignant transformation |
| Hugo Symbol | Variant Class | Variant Classification | dbSNP RS | HGVSc | HGVSp | HGVSp Short | SWISSPROT | BIOTYPE | SIFT | PolyPhen | Tumor Sample Barcode | Tissue | Histology | Sex | Age | Stage | Therapy Types | Drugs | Outcome |
| TFPT | SNV | Missense_Mutation | c.755N>G | p.Ser252Cys | p.S252C | P0C1Z6 | protein_coding | deleterious_low_confidence(0.03) | benign(0.173) | TCGA-AN-A0XW-01 | Breast | breast invasive carcinoma | Female | <65 | III/IV | Unknown | Unknown | SD | |
| TFPT | SNV | Missense_Mutation | c.755C>G | p.Ser252Cys | p.S252C | P0C1Z6 | protein_coding | deleterious_low_confidence(0.03) | benign(0.173) | TCGA-BH-A0W7-01 | Breast | breast invasive carcinoma | Female | <65 | I/II | Chemotherapy | taxotere | CR | |
| TFPT | SNV | Missense_Mutation | rs200361982 | c.331C>T | p.Arg111Trp | p.R111W | P0C1Z6 | protein_coding | deleterious(0.01) | possibly_damaging(0.629) | TCGA-JW-A5VL-01 | Cervix | cervical & endocervical cancer | Female | <65 | I/II | Unknown | Unknown | SD |
| TFPT | SNV | Missense_Mutation | novel | c.227A>G | p.Glu76Gly | p.E76G | P0C1Z6 | protein_coding | deleterious(0.01) | probably_damaging(0.976) | TCGA-G4-6588-01 | Colorectum | colon adenocarcinoma | Female | <65 | I/II | Unknown | Unknown | SD |
| TFPT | SNV | Missense_Mutation | novel | c.277N>A | p.Glu93Lys | p.E93K | P0C1Z6 | protein_coding | deleterious(0.04) | benign(0.046) | TCGA-EI-6917-01 | Colorectum | rectum adenocarcinoma | Male | <65 | III/IV | Chemotherapy | 5fluorouracil+oxaciplatina+l-folinian | SD |
| TFPT | SNV | Missense_Mutation | novel | c.625G>A | p.Glu209Lys | p.E209K | P0C1Z6 | protein_coding | tolerated(0.09) | probably_damaging(0.99) | TCGA-A5-A0G2-01 | Endometrium | uterine corpus endometrioid carcinoma | Female | <65 | III/IV | Unknown | Unknown | SD |
| TFPT | SNV | Missense_Mutation | novel | c.323G>T | p.Arg108Met | p.R108M | P0C1Z6 | protein_coding | deleterious(0) | possibly_damaging(0.518) | TCGA-A5-A0G2-01 | Endometrium | uterine corpus endometrioid carcinoma | Female | <65 | III/IV | Unknown | Unknown | SD |
| TFPT | SNV | Missense_Mutation | novel | c.715G>A | p.Asp239Asn | p.D239N | P0C1Z6 | protein_coding | tolerated_low_confidence(0.06) | benign(0.007) | TCGA-AJ-A2QM-01 | Endometrium | uterine corpus endometrioid carcinoma | Female | >=65 | I/II | Chemotherapy | carboplatin | CR |
| TFPT | SNV | Missense_Mutation | c.423N>T | p.Glu141Asp | p.E141D | P0C1Z6 | protein_coding | deleterious(0.02) | probably_damaging(0.996) | TCGA-AP-A059-01 | Endometrium | uterine corpus endometrioid carcinoma | Female | >=65 | I/II | Unknown | Unknown | SD | |
| TFPT | SNV | Missense_Mutation | c.54N>A | p.Phe18Leu | p.F18L | P0C1Z6 | protein_coding | deleterious(0) | probably_damaging(0.946) | TCGA-AX-A2HC-01 | Endometrium | uterine corpus endometrioid carcinoma | Female | <65 | III/IV | Chemotherapy | paclitaxel | PD |
| Page: 1 2 3 |
Top |
Related drugs of malignant transformation related genes |
| Identification of chemicals and drugs interact with genes involved in malignant transfromation |
| (DGIdb 4.0) |
| Entrez ID | Symbol | Category | Interaction Types | Drug Claim Name | Drug Name | PMIDs |
| Page: 1 |

Copyright 2023-Present -The University of Texas Health Science Center at Houston |