
|
|||||
|
 | |
| |
| |
| |
| |
| |
|
Gene: TFPI2 |
Gene summary for TFPI2 |
| Gene information | Species | Human | Gene symbol | TFPI2 | Gene ID | 7980 |
| Gene name | tissue factor pathway inhibitor 2 | |
| Gene Alias | PP5 | |
| Cytomap | 7q21.3 | |
| Gene Type | protein-coding | GO ID | GO:0006508 | UniProtAcc | P48307 |
Top |
Malignant transformation analysis |
| Identification of the aberrant gene expression in precancerous and cancerous lesions by comparing the gene expression of stem-like cells in diseased tissues with normal stem cells |
| Entrez ID | Symbol | Replicates | Species | Organ | Tissue | Adj P-value | Log2FC | Malignancy |
| 7980 | TFPI2 | AEH-subject1 | Human | Endometrium | AEH | 3.42e-03 | 3.32e-01 | -0.3059 |
| 7980 | TFPI2 | AEH-subject5 | Human | Endometrium | AEH | 5.65e-06 | 4.83e-01 | -0.2953 |
| 7980 | TFPI2 | EEC-subject2 | Human | Endometrium | EEC | 4.43e-06 | -1.59e-01 | -0.2607 |
| 7980 | TFPI2 | EEC-subject3 | Human | Endometrium | EEC | 3.57e-08 | -1.65e-01 | -0.2525 |
| 7980 | TFPI2 | GSM5276934 | Human | Endometrium | EEC | 8.04e-09 | 4.99e-01 | -0.0913 |
| 7980 | TFPI2 | GSM5276935 | Human | Endometrium | EEC | 2.96e-18 | 6.29e-01 | -0.123 |
| 7980 | TFPI2 | GSM6177620_NYU_UCEC1_lib1_lib1 | Human | Endometrium | EEC | 1.12e-04 | -2.20e-01 | -0.1869 |
| 7980 | TFPI2 | GSM6177620_NYU_UCEC1_lib2_lib2 | Human | Endometrium | EEC | 3.61e-04 | -1.67e-01 | -0.1875 |
| 7980 | TFPI2 | GSM6177620_NYU_UCEC1_lib3_lib3 | Human | Endometrium | EEC | 2.16e-08 | -2.36e-01 | -0.1883 |
| 7980 | TFPI2 | GSM6177621_NYU_UCEC2_lib1_lib1 | Human | Endometrium | EEC | 3.00e-05 | 2.19e-01 | -0.1934 |
| 7980 | TFPI2 | GSM6177622_NYU_UCEC3_lib1_lib1 | Human | Endometrium | EEC | 3.09e-14 | -1.36e-01 | -0.1917 |
| 7980 | TFPI2 | GSM6177622_NYU_UCEC3_lib2_lib2 | Human | Endometrium | EEC | 2.54e-08 | -1.44e-01 | -0.1916 |
| 7980 | TFPI2 | GSM6177623_NYU_UCEC3_Vis | Human | Endometrium | EEC | 2.32e-06 | -1.59e-01 | -0.1269 |
| 7980 | TFPI2 | LZE6T | Human | Esophagus | ESCC | 3.38e-04 | 1.08e+00 | 0.0845 |
| 7980 | TFPI2 | P11T-E | Human | Esophagus | ESCC | 4.67e-13 | 2.32e+00 | 0.1426 |
| 7980 | TFPI2 | P24T-E | Human | Esophagus | ESCC | 5.30e-08 | 3.80e-01 | 0.1287 |
| 7980 | TFPI2 | P32T-E | Human | Esophagus | ESCC | 3.56e-13 | 7.58e-01 | 0.1666 |
| 7980 | TFPI2 | P37T-E | Human | Esophagus | ESCC | 2.58e-25 | 1.33e+00 | 0.1371 |
| 7980 | TFPI2 | P52T-E | Human | Esophagus | ESCC | 1.63e-09 | 5.55e-01 | 0.1555 |
| 7980 | TFPI2 | P75T-E | Human | Esophagus | ESCC | 3.60e-10 | 7.34e-01 | 0.1125 |
| Page: 1 2 3 |
| Tissue | Expression Dynamics | Abbreviation |
| Endometrium |  | AEH: Atypical endometrial hyperplasia |
| EEC: Endometrioid Cancer | ||
| Esophagus | 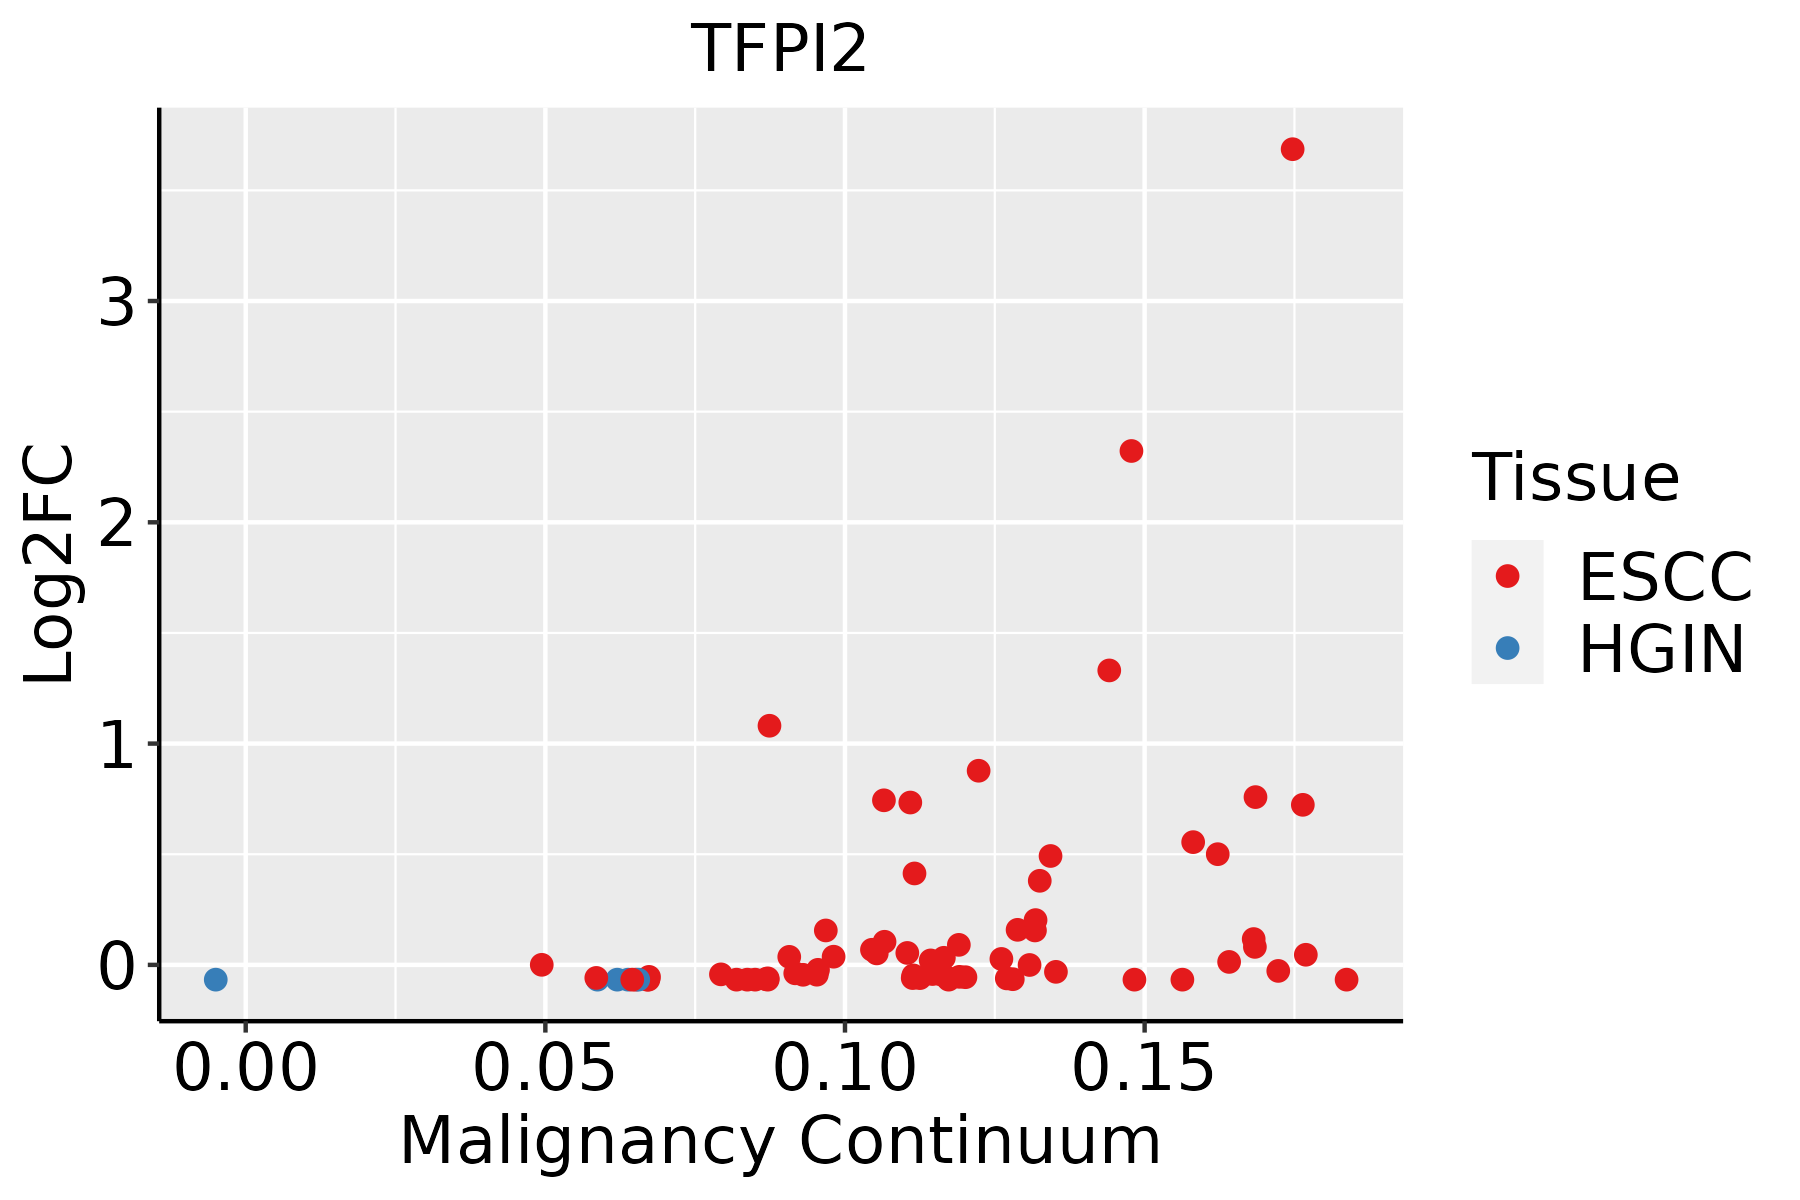 | ESCC: Esophageal squamous cell carcinoma |
| HGIN: High-grade intraepithelial neoplasias | ||
| LGIN: Low-grade intraepithelial neoplasias | ||
| Oral Cavity | 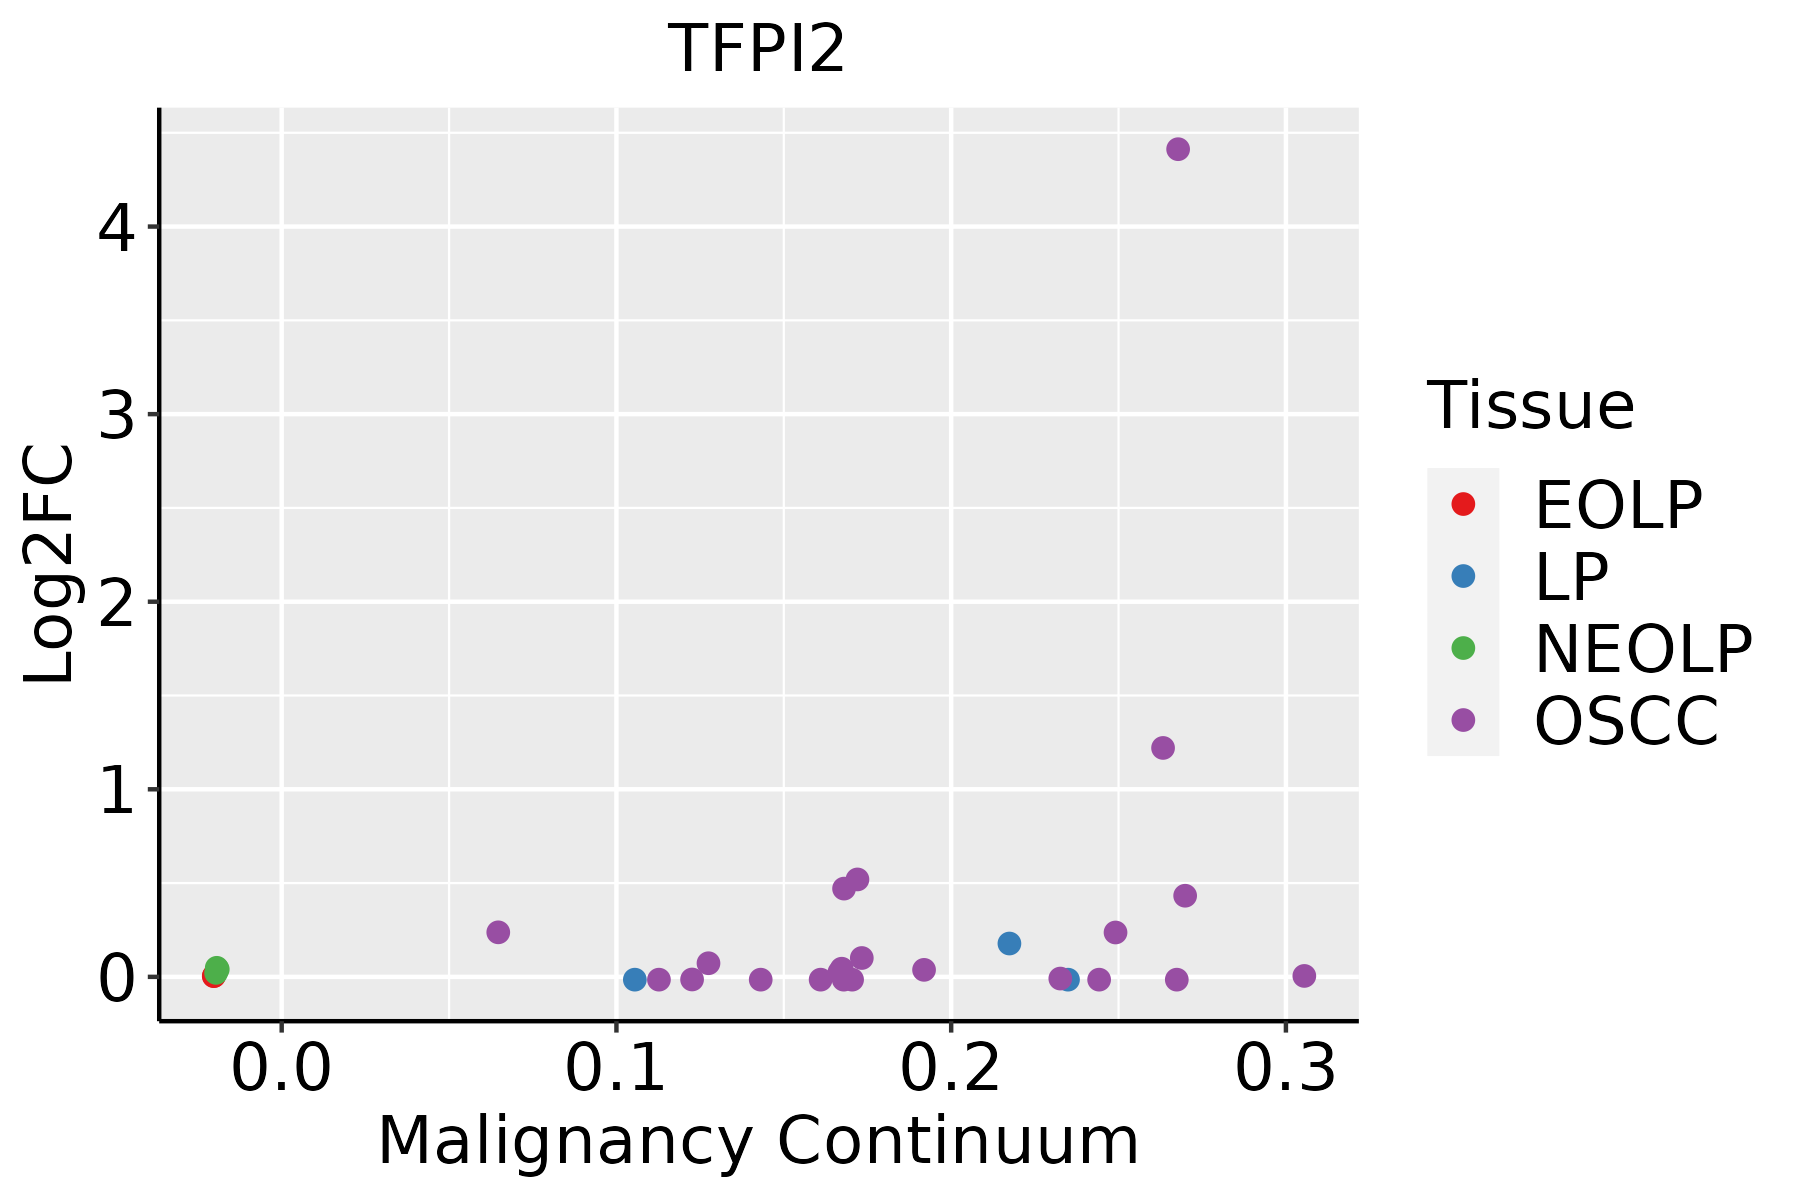 | EOLP: Erosive Oral lichen planus |
| LP: leukoplakia | ||
| NEOLP: Non-erosive oral lichen planus | ||
| OSCC: Oral squamous cell carcinoma | ||
| Prostate | 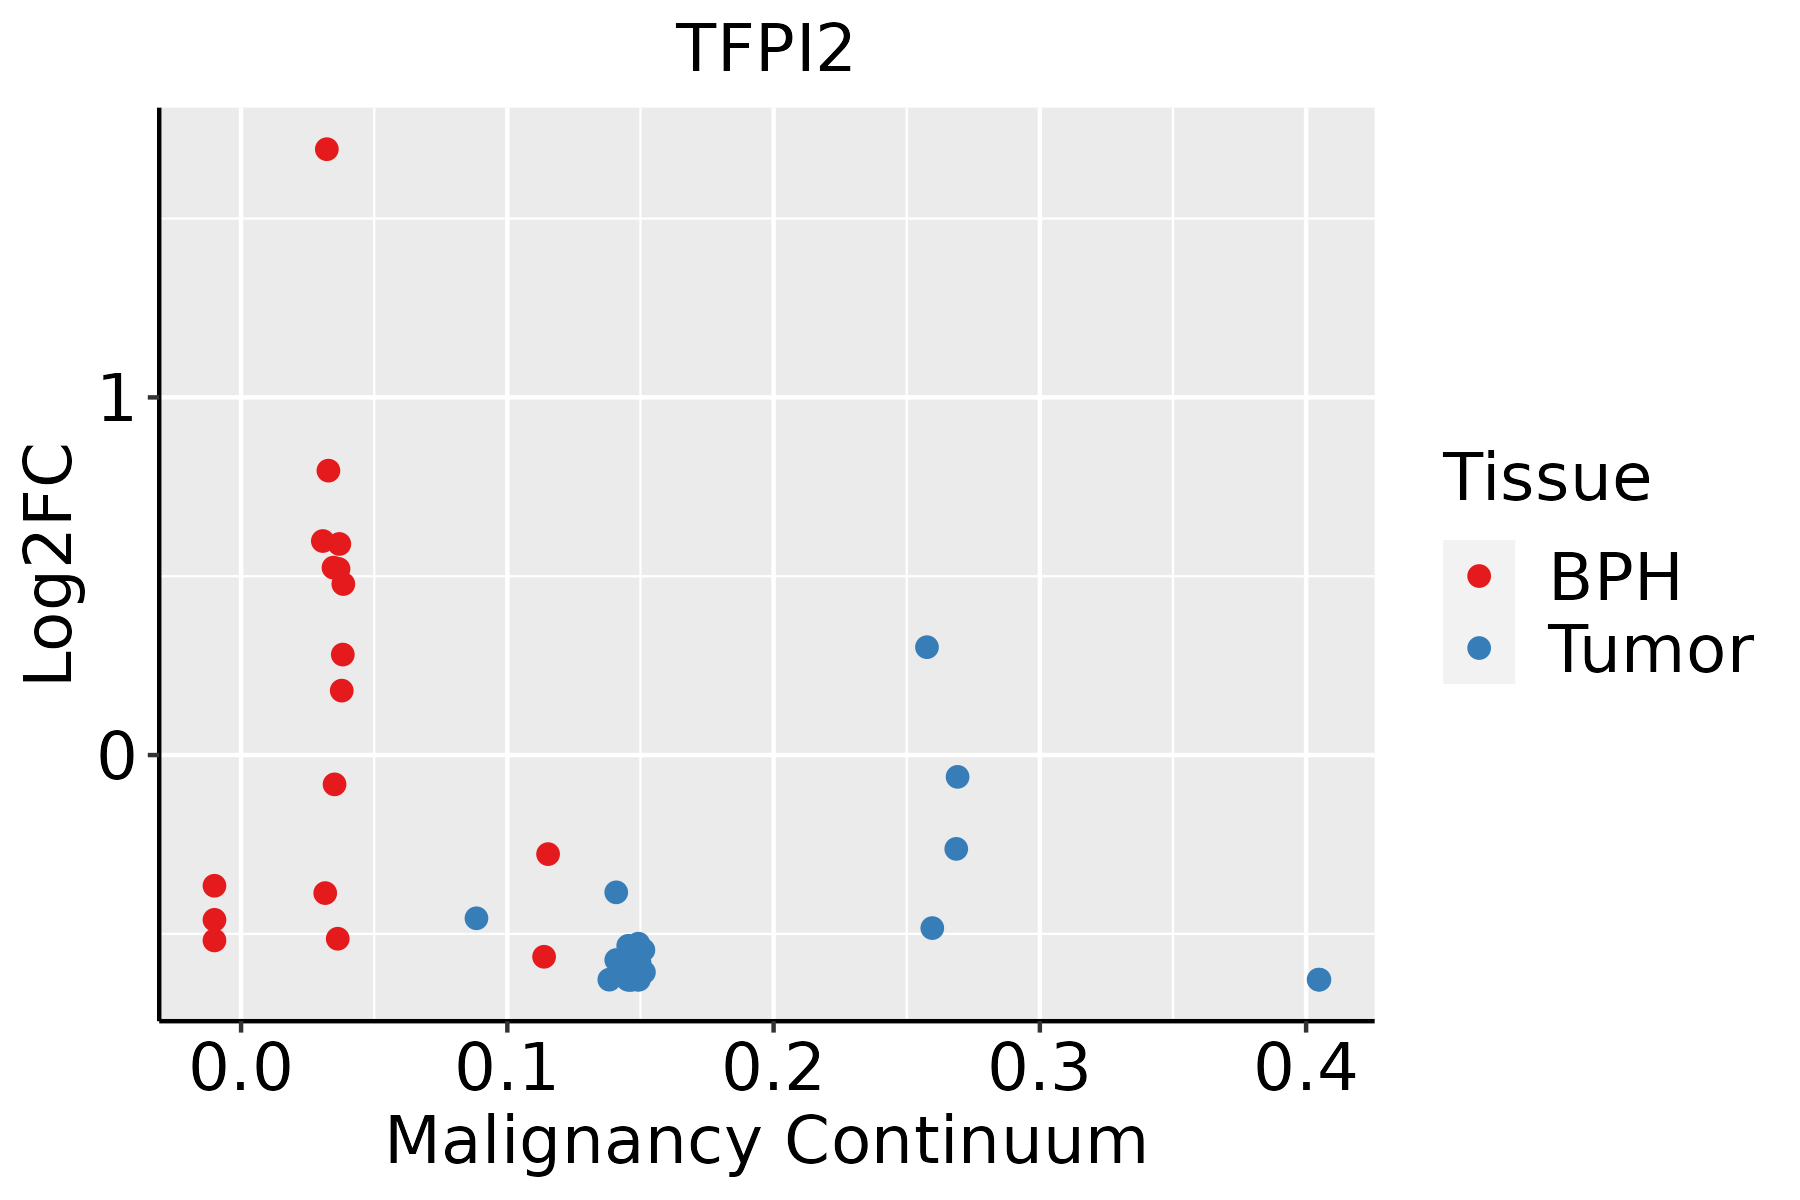 | BPH: Benign Prostatic Hyperplasia |
| Skin | 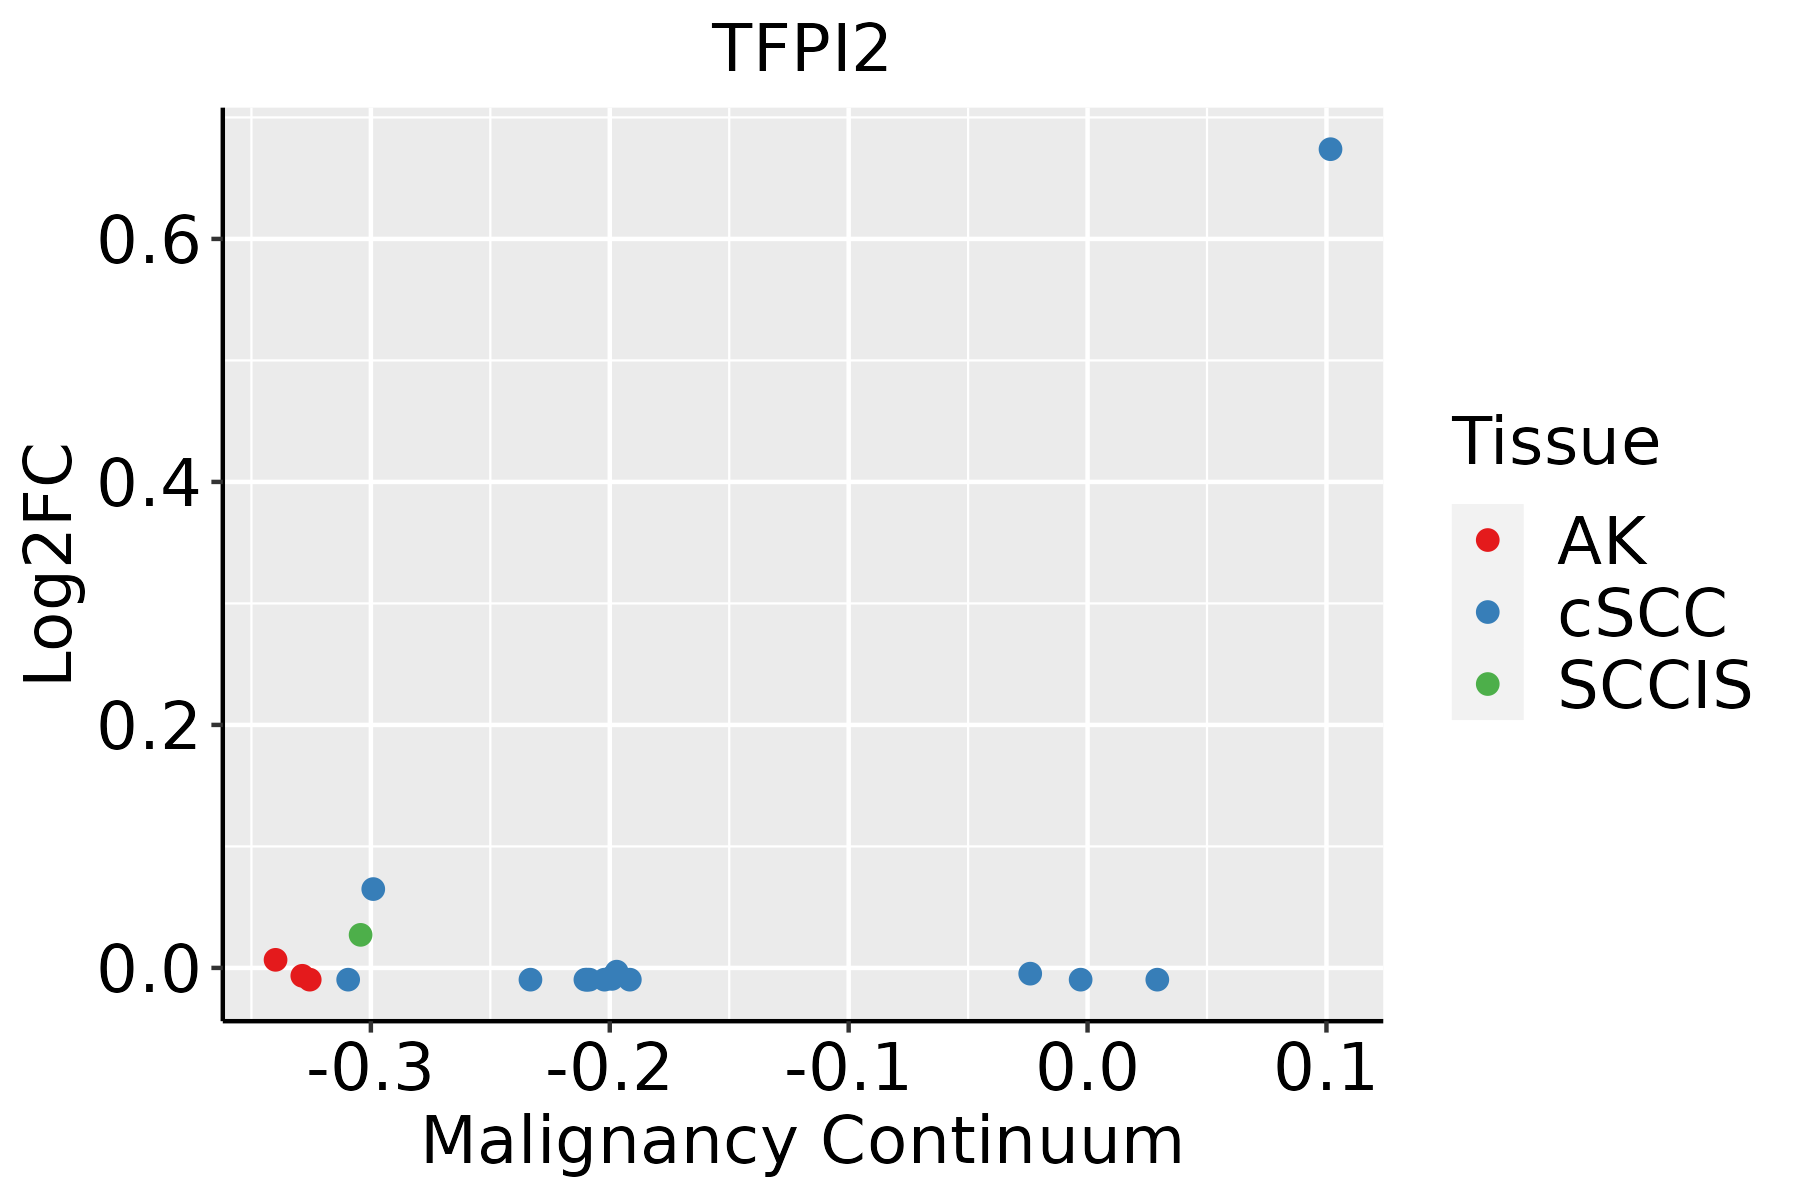 | AK: Actinic keratosis |
| cSCC: Cutaneous squamous cell carcinoma | ||
| SCCIS:squamous cell carcinoma in situ | ||
| Thyroid | 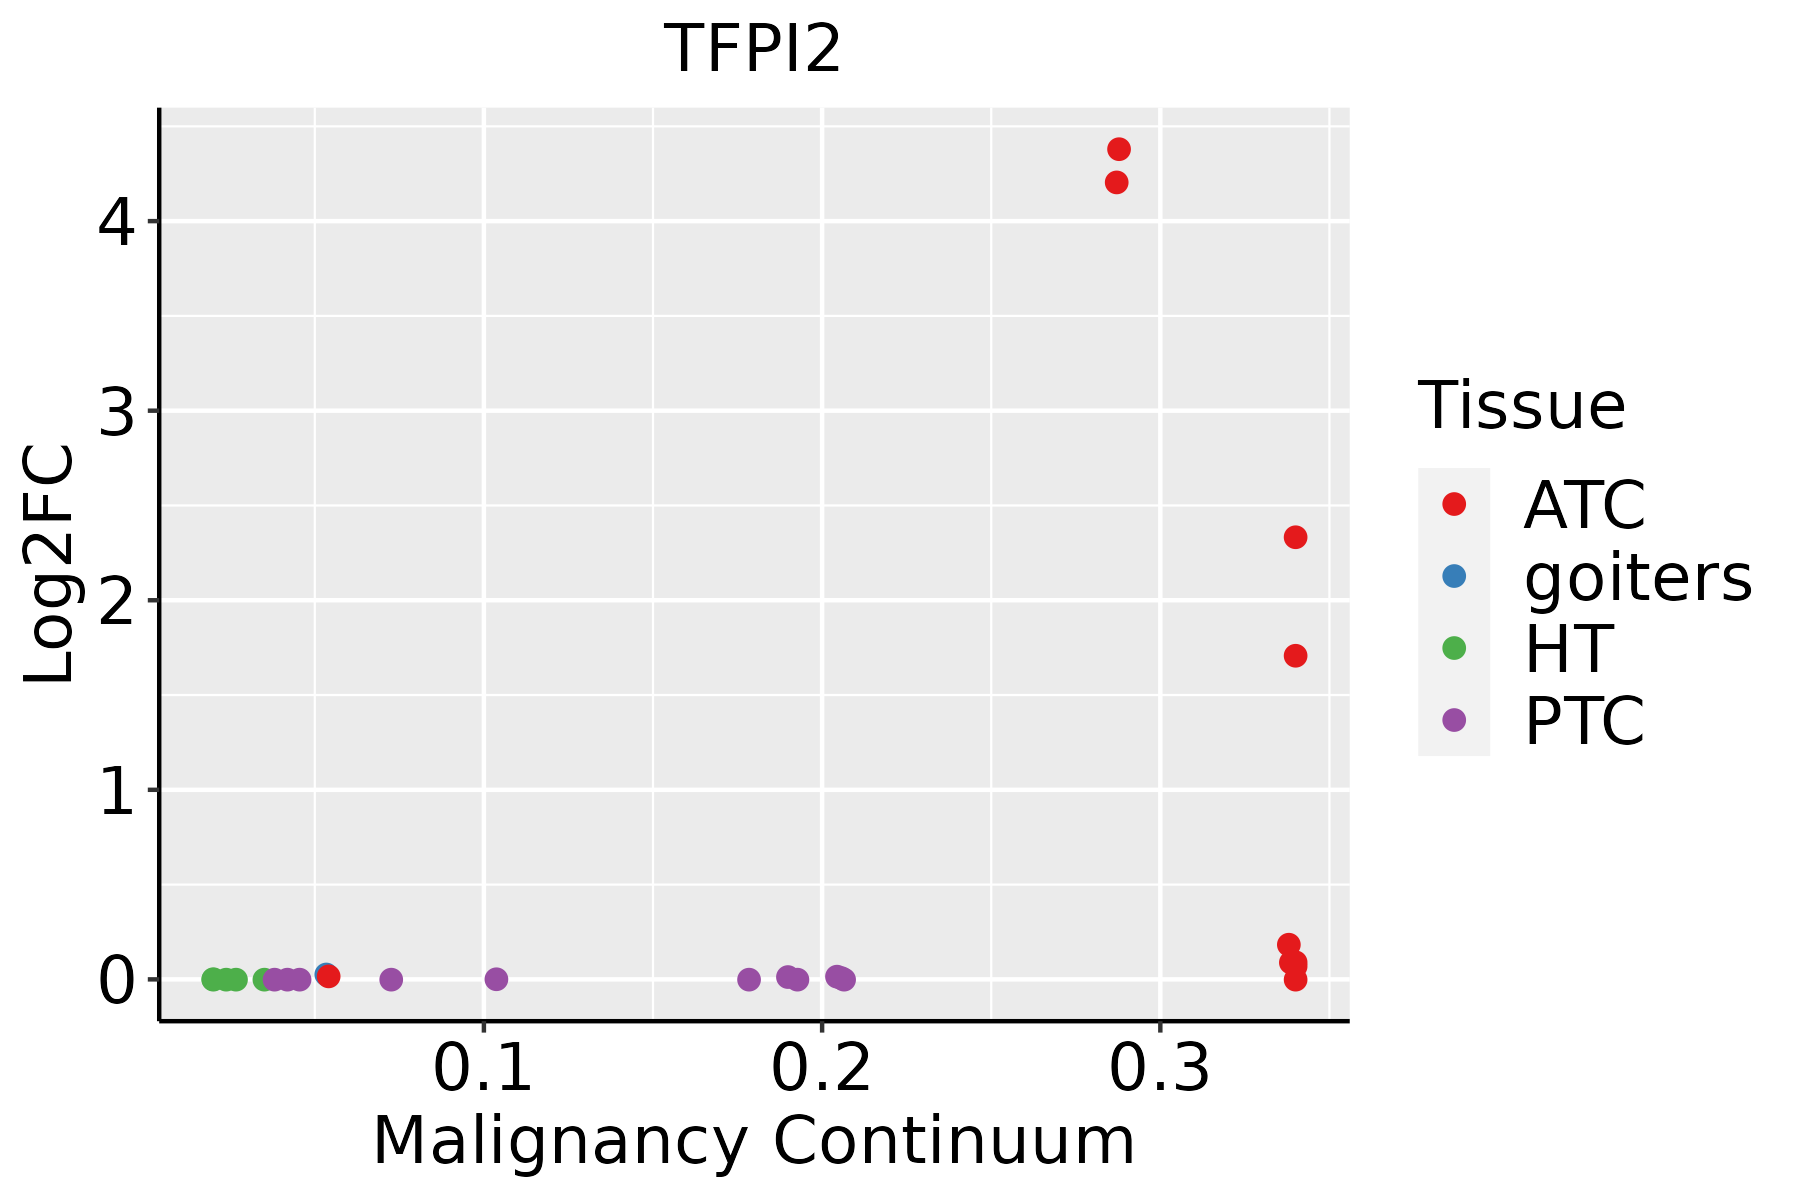 | ATC: Anaplastic thyroid cancer |
| HT: Hashimoto's thyroiditis | ||
| PTC: Papillary thyroid cancer |
| ∗log2FC in expression of this searched gene in stem-like cells from each diseased tissue sample relative to stem-like cells in normal samples in each tissue plotted against the malignancy continuum. Samples are colored based on if they are from different disease stage. |
Top |
Malignant transformation related pathway analysis |
| Find out the enriched GO biological processes and KEGG pathways involved in transition from healthy to precancer to cancer |
| Tissue | Disease Stage | Enriched GO biological Processes |
| Colorectum | AD |  |
| Colorectum | SER |  |
| Colorectum | MSS |  |
| Colorectum | MSI-H |  |
| Colorectum | FAP |  |
| ∗Top 15 enriched GO BP terms are showed in the bar plot of each disease state in each tissue. Each row represents a significant GO biological process which is colored according to the -log10(p.adjust). |
| Page: 1 2 3 4 5 6 7 8 9 |
| GO ID | Tissue | Disease Stage | Description | Gene Ratio | Bg Ratio | pvalue | p.adjust | Count |
| GO:004206016 | Endometrium | AEH | wound healing | 91/2100 | 422/18723 | 4.85e-10 | 4.61e-08 | 91 |
| GO:005254716 | Endometrium | AEH | regulation of peptidase activity | 85/2100 | 461/18723 | 2.47e-06 | 7.11e-05 | 85 |
| GO:005254816 | Endometrium | AEH | regulation of endopeptidase activity | 76/2100 | 432/18723 | 4.42e-05 | 7.43e-04 | 76 |
| GO:004586116 | Endometrium | AEH | negative regulation of proteolysis | 63/2100 | 351/18723 | 1.07e-04 | 1.53e-03 | 63 |
| GO:00075967 | Endometrium | AEH | blood coagulation | 43/2100 | 217/18723 | 1.42e-04 | 1.89e-03 | 43 |
| GO:00075997 | Endometrium | AEH | hemostasis | 43/2100 | 222/18723 | 2.39e-04 | 2.86e-03 | 43 |
| GO:00508177 | Endometrium | AEH | coagulation | 43/2100 | 222/18723 | 2.39e-04 | 2.86e-03 | 43 |
| GO:005134610 | Endometrium | AEH | negative regulation of hydrolase activity | 65/2100 | 379/18723 | 3.18e-04 | 3.57e-03 | 65 |
| GO:005087815 | Endometrium | AEH | regulation of body fluid levels | 64/2100 | 379/18723 | 5.40e-04 | 5.44e-03 | 64 |
| GO:001046610 | Endometrium | AEH | negative regulation of peptidase activity | 43/2100 | 262/18723 | 6.78e-03 | 3.95e-02 | 43 |
| GO:004206017 | Endometrium | EEC | wound healing | 92/2168 | 422/18723 | 1.12e-09 | 9.58e-08 | 92 |
| GO:005254717 | Endometrium | EEC | regulation of peptidase activity | 91/2168 | 461/18723 | 2.00e-07 | 8.93e-06 | 91 |
| GO:004586117 | Endometrium | EEC | negative regulation of proteolysis | 72/2168 | 351/18723 | 8.46e-07 | 2.98e-05 | 72 |
| GO:005254817 | Endometrium | EEC | regulation of endopeptidase activity | 82/2168 | 432/18723 | 3.96e-06 | 1.04e-04 | 82 |
| GO:005134615 | Endometrium | EEC | negative regulation of hydrolase activity | 72/2168 | 379/18723 | 1.46e-05 | 2.87e-04 | 72 |
| GO:000759613 | Endometrium | EEC | blood coagulation | 44/2168 | 217/18723 | 1.42e-04 | 1.84e-03 | 44 |
| GO:000759913 | Endometrium | EEC | hemostasis | 44/2168 | 222/18723 | 2.43e-04 | 2.85e-03 | 44 |
| GO:005081713 | Endometrium | EEC | coagulation | 44/2168 | 222/18723 | 2.43e-04 | 2.85e-03 | 44 |
| GO:001046615 | Endometrium | EEC | negative regulation of peptidase activity | 49/2168 | 262/18723 | 4.64e-04 | 4.79e-03 | 49 |
| GO:001095114 | Endometrium | EEC | negative regulation of endopeptidase activity | 47/2168 | 252/18723 | 6.37e-04 | 6.25e-03 | 47 |
| Page: 1 2 3 4 5 |
| Pathway ID | Tissue | Disease Stage | Description | Gene Ratio | Bg Ratio | pvalue | p.adjust | qvalue | Count |
| Page: 1 |
Top |
Cell-cell communication analysis |
| Identification of potential cell-cell interactions between two cell types and their ligand-receptor pairs for different disease states |
| Ligand | Receptor | LRpair | Pathway | Tissue | Disease Stage |
| Page: 1 |
Top |
Single-cell gene regulatory network inference analysis |
| Find out the significant the regulons (TFs) and the target genes of each regulon across cell types for different disease states |
| TF | Cell Type | Tissue | Disease Stage | Target Gene | RSS | Regulon Activity |
| ∗The dot plots of a searched regulon are shown for all cell subpopulations in each disease state of each tissue based on the regulon specific score inferred using pySCENIC and by calculating the average expression. |
| Page: 1 |
Top |
Somatic mutation of malignant transformation related genes |
| Annotation of somatic variants for genes involved in malignant transformation |
| Hugo Symbol | Variant Class | Variant Classification | dbSNP RS | HGVSc | HGVSp | HGVSp Short | SWISSPROT | BIOTYPE | SIFT | PolyPhen | Tumor Sample Barcode | Tissue | Histology | Sex | Age | Stage | Therapy Types | Drugs | Outcome |
| TFPI2 | SNV | Missense_Mutation | c.184C>T | p.Arg62Cys | p.R62C | P48307 | protein_coding | deleterious(0) | possibly_damaging(0.761) | TCGA-A8-A06X-01 | Breast | breast invasive carcinoma | Female | >=65 | I/II | Unknown | Unknown | SD | |
| TFPI2 | SNV | Missense_Mutation | c.571N>G | p.Cys191Gly | p.C191G | P48307 | protein_coding | deleterious(0) | probably_damaging(0.999) | TCGA-AN-A0FX-01 | Breast | breast invasive carcinoma | Female | <65 | I/II | Unknown | Unknown | SD | |
| TFPI2 | SNV | Missense_Mutation | rs768678727 | c.382N>A | p.Gly128Ser | p.G128S | P48307 | protein_coding | deleterious(0.02) | possibly_damaging(0.723) | TCGA-AO-A128-01 | Breast | breast invasive carcinoma | Female | <65 | I/II | Chemotherapy | doxorubicin | SD |
| TFPI2 | insertion | In_Frame_Ins | novel | c.525_526insACC | p.Tyr175_Phe176insThr | p.Y175_F176insT | P48307 | protein_coding | TCGA-A7-A26I-01 | Breast | breast invasive carcinoma | Female | >=65 | I/II | Chemotherapy | cytoxan | SD | ||
| TFPI2 | insertion | Nonsense_Mutation | novel | c.524_525insATAATATTT | p.Tyr175delinsTer | p.Y175delins* | P48307 | protein_coding | TCGA-A7-A26I-01 | Breast | breast invasive carcinoma | Female | >=65 | I/II | Chemotherapy | cytoxan | SD | ||
| TFPI2 | insertion | Frame_Shift_Ins | novel | c.130_131insTGAACTTGAAAGAT | p.Pro44LeufsTer51 | p.P44Lfs*51 | P48307 | protein_coding | TCGA-AO-A0JB-01 | Breast | breast invasive carcinoma | Female | <65 | III/IV | Chemotherapy | cyclophosphamide | SD | ||
| TFPI2 | deletion | Frame_Shift_Del | c.387delG | p.Cys130ValfsTer42 | p.C130Vfs*42 | P48307 | protein_coding | TCGA-BH-A0B1-01 | Breast | breast invasive carcinoma | Female | >=65 | I/II | Chemotherapy | adriamycin | SD | |||
| TFPI2 | SNV | Missense_Mutation | rs573434214 | c.353G>A | p.Ser118Asn | p.S118N | P48307 | protein_coding | tolerated(0.12) | benign(0.066) | TCGA-2W-A8YY-01 | Cervix | cervical & endocervical cancer | Female | <65 | I/II | Chemotherapy | cisplatin | CR |
| TFPI2 | SNV | Missense_Mutation | rs770380317 | c.664C>T | p.Arg222Cys | p.R222C | P48307 | protein_coding | tolerated(0.14) | benign(0.266) | TCGA-DS-A1OB-01 | Cervix | cervical & endocervical cancer | Female | <65 | I/II | Chemotherapy | carboplatin | PD |
| TFPI2 | SNV | Missense_Mutation | rs753875527 | c.208N>A | p.Glu70Lys | p.E70K | P48307 | protein_coding | tolerated(0.75) | benign(0.009) | TCGA-IR-A3LI-01 | Cervix | cervical & endocervical cancer | Female | <65 | I/II | Chemotherapy | cisplatin | CR |
| Page: 1 2 3 4 5 |
Top |
Related drugs of malignant transformation related genes |
| Identification of chemicals and drugs interact with genes involved in malignant transfromation |
| (DGIdb 4.0) |
| Entrez ID | Symbol | Category | Interaction Types | Drug Claim Name | Drug Name | PMIDs |
| 7980 | TFPI2 | PROTEASE INHIBITOR, DRUGGABLE GENOME | HEPARIN | HEPARIN | 2416032 | |
| 7980 | TFPI2 | PROTEASE INHIBITOR, DRUGGABLE GENOME | PROTEASE INHIBITORS | 3276312 |
| Page: 1 |

Copyright 2023-Present -The University of Texas Health Science Center at Houston |