
|
|||||
|
 | |
| |
| |
| |
| |
| |
|
Gene: TFIP11 |
Gene summary for TFIP11 |
| Gene information | Species | Human | Gene symbol | TFIP11 | Gene ID | 24144 |
| Gene name | tuftelin interacting protein 11 | |
| Gene Alias | NTR1 | |
| Cytomap | 22q12.1 | |
| Gene Type | protein-coding | GO ID | GO:0000375 | UniProtAcc | A0A024R1I7 |
Top |
Malignant transformation analysis |
| Identification of the aberrant gene expression in precancerous and cancerous lesions by comparing the gene expression of stem-like cells in diseased tissues with normal stem cells |
| Entrez ID | Symbol | Replicates | Species | Organ | Tissue | Adj P-value | Log2FC | Malignancy |
| 24144 | TFIP11 | LZE4T | Human | Esophagus | ESCC | 3.12e-05 | 2.42e-01 | 0.0811 |
| 24144 | TFIP11 | LZE7T | Human | Esophagus | ESCC | 3.08e-07 | 2.44e-01 | 0.0667 |
| 24144 | TFIP11 | LZE8T | Human | Esophagus | ESCC | 3.24e-02 | 6.48e-02 | 0.067 |
| 24144 | TFIP11 | LZE20T | Human | Esophagus | ESCC | 1.98e-03 | 1.84e-01 | 0.0662 |
| 24144 | TFIP11 | LZE24T | Human | Esophagus | ESCC | 8.39e-09 | 2.86e-01 | 0.0596 |
| 24144 | TFIP11 | LZE21T | Human | Esophagus | ESCC | 8.45e-03 | 1.97e-01 | 0.0655 |
| 24144 | TFIP11 | P1T-E | Human | Esophagus | ESCC | 3.81e-06 | 3.42e-01 | 0.0875 |
| 24144 | TFIP11 | P2T-E | Human | Esophagus | ESCC | 9.56e-24 | 2.47e-01 | 0.1177 |
| 24144 | TFIP11 | P4T-E | Human | Esophagus | ESCC | 2.38e-23 | 2.77e-01 | 0.1323 |
| 24144 | TFIP11 | P5T-E | Human | Esophagus | ESCC | 4.37e-12 | 8.98e-02 | 0.1327 |
| 24144 | TFIP11 | P8T-E | Human | Esophagus | ESCC | 6.48e-16 | 1.71e-01 | 0.0889 |
| 24144 | TFIP11 | P9T-E | Human | Esophagus | ESCC | 3.28e-07 | 1.58e-01 | 0.1131 |
| 24144 | TFIP11 | P10T-E | Human | Esophagus | ESCC | 1.49e-15 | 1.99e-01 | 0.116 |
| 24144 | TFIP11 | P11T-E | Human | Esophagus | ESCC | 2.12e-09 | 3.71e-01 | 0.1426 |
| 24144 | TFIP11 | P12T-E | Human | Esophagus | ESCC | 6.94e-22 | 3.31e-01 | 0.1122 |
| 24144 | TFIP11 | P15T-E | Human | Esophagus | ESCC | 3.52e-15 | 3.10e-01 | 0.1149 |
| 24144 | TFIP11 | P16T-E | Human | Esophagus | ESCC | 1.63e-22 | 2.52e-01 | 0.1153 |
| 24144 | TFIP11 | P17T-E | Human | Esophagus | ESCC | 1.43e-03 | 3.02e-01 | 0.1278 |
| 24144 | TFIP11 | P20T-E | Human | Esophagus | ESCC | 8.84e-13 | 2.11e-01 | 0.1124 |
| 24144 | TFIP11 | P21T-E | Human | Esophagus | ESCC | 3.68e-09 | 7.72e-02 | 0.1617 |
| Page: 1 2 3 4 5 |
| Tissue | Expression Dynamics | Abbreviation |
| Esophagus |  | ESCC: Esophageal squamous cell carcinoma |
| HGIN: High-grade intraepithelial neoplasias | ||
| LGIN: Low-grade intraepithelial neoplasias | ||
| Liver | 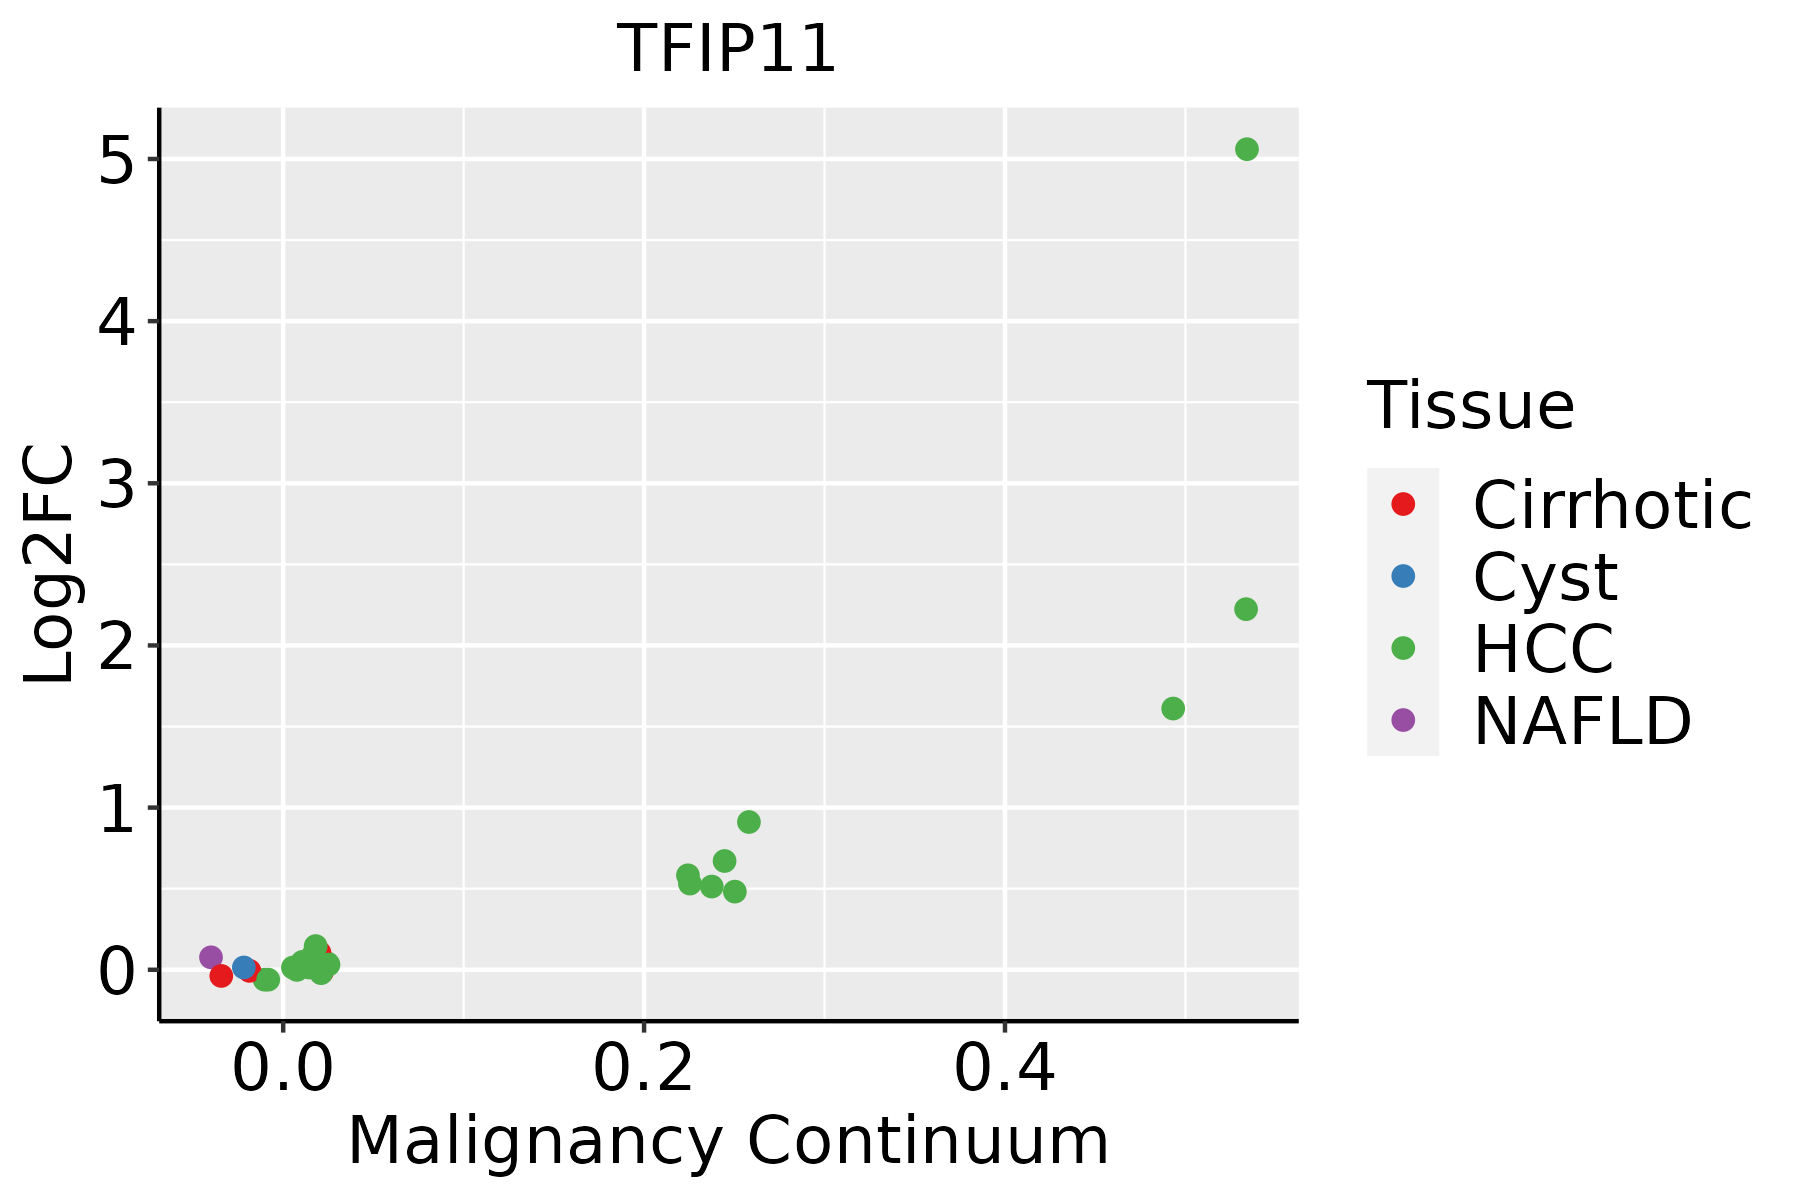 | HCC: Hepatocellular carcinoma |
| NAFLD: Non-alcoholic fatty liver disease | ||
| Oral Cavity | 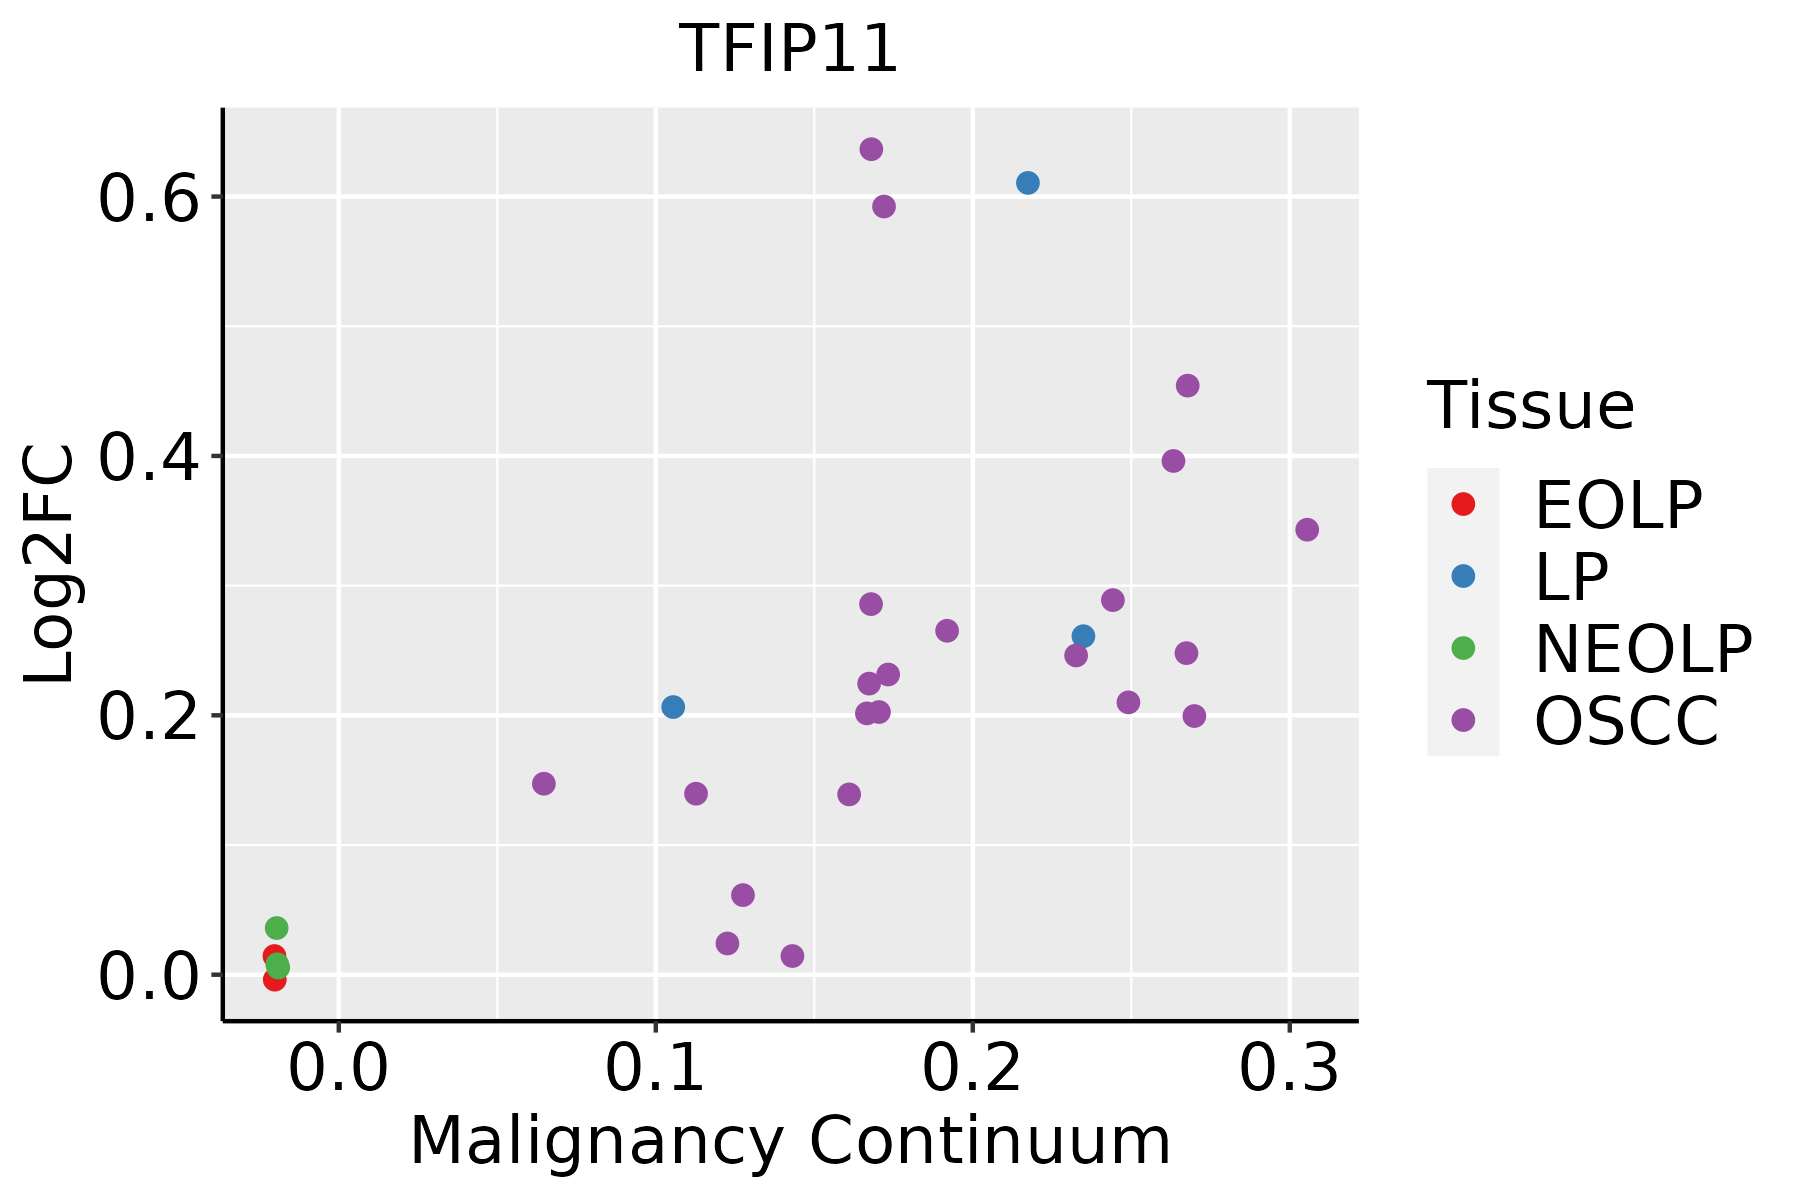 | EOLP: Erosive Oral lichen planus |
| LP: leukoplakia | ||
| NEOLP: Non-erosive oral lichen planus | ||
| OSCC: Oral squamous cell carcinoma |
| ∗log2FC in expression of this searched gene in stem-like cells from each diseased tissue sample relative to stem-like cells in normal samples in each tissue plotted against the malignancy continuum. Samples are colored based on if they are from different disease stage. |
Top |
Malignant transformation related pathway analysis |
| Find out the enriched GO biological processes and KEGG pathways involved in transition from healthy to precancer to cancer |
| Tissue | Disease Stage | Enriched GO biological Processes |
| Colorectum | AD |  |
| Colorectum | SER |  |
| Colorectum | MSS |  |
| Colorectum | MSI-H |  |
| Colorectum | FAP |  |
| ∗Top 15 enriched GO BP terms are showed in the bar plot of each disease state in each tissue. Each row represents a significant GO biological process which is colored according to the -log10(p.adjust). |
| Page: 1 2 3 4 5 6 7 8 9 |
| GO ID | Tissue | Disease Stage | Description | Gene Ratio | Bg Ratio | pvalue | p.adjust | Count |
| GO:0008380111 | Esophagus | ESCC | RNA splicing | 336/8552 | 434/18723 | 1.74e-42 | 3.67e-39 | 336 |
| GO:0000375111 | Esophagus | ESCC | RNA splicing, via transesterification reactions | 248/8552 | 324/18723 | 3.05e-30 | 1.49e-27 | 248 |
| GO:0000377111 | Esophagus | ESCC | RNA splicing, via transesterification reactions with bulged adenosine as nucleophile | 244/8552 | 320/18723 | 2.52e-29 | 1.07e-26 | 244 |
| GO:0000398111 | Esophagus | ESCC | mRNA splicing, via spliceosome | 244/8552 | 320/18723 | 2.52e-29 | 1.07e-26 | 244 |
| GO:0022411111 | Esophagus | ESCC | cellular component disassembly | 305/8552 | 443/18723 | 1.94e-23 | 4.57e-21 | 305 |
| GO:0051098111 | Esophagus | ESCC | regulation of binding | 251/8552 | 363/18723 | 6.73e-20 | 8.46e-18 | 251 |
| GO:0071826111 | Esophagus | ESCC | ribonucleoprotein complex subunit organization | 166/8552 | 227/18723 | 2.94e-17 | 2.42e-15 | 166 |
| GO:0043254111 | Esophagus | ESCC | regulation of protein-containing complex assembly | 278/8552 | 428/18723 | 3.81e-16 | 2.77e-14 | 278 |
| GO:005105215 | Esophagus | ESCC | regulation of DNA metabolic process | 232/8552 | 359/18723 | 2.40e-13 | 1.13e-11 | 232 |
| GO:000072319 | Esophagus | ESCC | telomere maintenance | 99/8552 | 131/18723 | 2.68e-12 | 1.08e-10 | 99 |
| GO:003298416 | Esophagus | ESCC | protein-containing complex disassembly | 151/8552 | 224/18723 | 3.45e-11 | 1.15e-09 | 151 |
| GO:004339320 | Esophagus | ESCC | regulation of protein binding | 135/8552 | 196/18723 | 3.69e-11 | 1.22e-09 | 135 |
| GO:2001020110 | Esophagus | ESCC | regulation of response to DNA damage stimulus | 145/8552 | 219/18723 | 5.97e-10 | 1.50e-08 | 145 |
| GO:0051100111 | Esophagus | ESCC | negative regulation of binding | 109/8552 | 162/18723 | 2.10e-08 | 4.03e-07 | 109 |
| GO:00063024 | Esophagus | ESCC | double-strand break repair | 152/8552 | 251/18723 | 1.33e-06 | 1.62e-05 | 152 |
| GO:003209116 | Esophagus | ESCC | negative regulation of protein binding | 65/8552 | 94/18723 | 3.46e-06 | 3.82e-05 | 65 |
| GO:003220014 | Esophagus | ESCC | telomere organization | 99/8552 | 159/18723 | 1.77e-05 | 1.57e-04 | 99 |
| GO:00062826 | Esophagus | ESCC | regulation of DNA repair | 82/8552 | 130/18723 | 4.65e-05 | 3.66e-04 | 82 |
| GO:200102112 | Esophagus | ESCC | negative regulation of response to DNA damage stimulus | 54/8552 | 81/18723 | 1.09e-04 | 7.64e-04 | 54 |
| GO:0031333110 | Esophagus | ESCC | negative regulation of protein-containing complex assembly | 86/8552 | 141/18723 | 1.74e-04 | 1.14e-03 | 86 |
| Page: 1 2 3 4 5 |
| Pathway ID | Tissue | Disease Stage | Description | Gene Ratio | Bg Ratio | pvalue | p.adjust | qvalue | Count |
| Page: 1 |
Top |
Cell-cell communication analysis |
| Identification of potential cell-cell interactions between two cell types and their ligand-receptor pairs for different disease states |
| Ligand | Receptor | LRpair | Pathway | Tissue | Disease Stage |
| Page: 1 |
Top |
Single-cell gene regulatory network inference analysis |
| Find out the significant the regulons (TFs) and the target genes of each regulon across cell types for different disease states |
| TF | Cell Type | Tissue | Disease Stage | Target Gene | RSS | Regulon Activity |
| ∗The dot plots of a searched regulon are shown for all cell subpopulations in each disease state of each tissue based on the regulon specific score inferred using pySCENIC and by calculating the average expression. |
| Page: 1 |
Top |
Somatic mutation of malignant transformation related genes |
| Annotation of somatic variants for genes involved in malignant transformation |
| Hugo Symbol | Variant Class | Variant Classification | dbSNP RS | HGVSc | HGVSp | HGVSp Short | SWISSPROT | BIOTYPE | SIFT | PolyPhen | Tumor Sample Barcode | Tissue | Histology | Sex | Age | Stage | Therapy Types | Drugs | Outcome |
| TFIP11 | SNV | Missense_Mutation | c.1015G>A | p.Asp339Asn | p.D339N | Q9UBB9 | protein_coding | tolerated(0.08) | benign(0.08) | TCGA-A2-A0D3-01 | Breast | breast invasive carcinoma | Female | <65 | I/II | Chemotherapy | carboplatin | SD | |
| TFIP11 | SNV | Missense_Mutation | c.1918G>A | p.Asp640Asn | p.D640N | Q9UBB9 | protein_coding | tolerated(0.13) | benign(0.305) | TCGA-A8-A07B-01 | Breast | breast invasive carcinoma | Female | >=65 | I/II | Unknown | Unknown | SD | |
| TFIP11 | SNV | Missense_Mutation | rs753047577 | c.1960N>G | p.Leu654Val | p.L654V | Q9UBB9 | protein_coding | deleterious(0) | probably_damaging(0.998) | TCGA-AC-A23H-01 | Breast | breast invasive carcinoma | Female | >=65 | I/II | Unknown | Unknown | PD |
| TFIP11 | SNV | Missense_Mutation | rs147540948 | c.727N>A | p.Val243Met | p.V243M | Q9UBB9 | protein_coding | deleterious(0.03) | possibly_damaging(0.781) | TCGA-AC-A62X-01 | Breast | breast invasive carcinoma | Female | >=65 | I/II | Unknown | Unknown | SD |
| TFIP11 | insertion | Frame_Shift_Ins | novel | c.2159-1_2159insCAAAGGGCCAGGCATGGTGGCTCACACCTGTA | p.Gly720AlafsTer63 | p.G720Afs*63 | Q9UBB9 | protein_coding | TCGA-AN-A03X-01 | Breast | breast invasive carcinoma | Female | >=65 | I/II | Unknown | Unknown | SD | ||
| TFIP11 | SNV | Missense_Mutation | novel | c.716N>T | p.Ser239Phe | p.S239F | Q9UBB9 | protein_coding | tolerated(0.7) | benign(0.003) | TCGA-VS-A8EB-01 | Cervix | cervical & endocervical cancer | Female | <65 | III/IV | Unknown | Unknown | PD |
| TFIP11 | SNV | Missense_Mutation | c.1844N>G | p.Lys615Arg | p.K615R | Q9UBB9 | protein_coding | deleterious(0) | probably_damaging(0.982) | TCGA-AA-3977-01 | Colorectum | colon adenocarcinoma | Male | >=65 | I/II | Unknown | Unknown | SD | |
| TFIP11 | SNV | Missense_Mutation | rs759307498 | c.301N>A | p.Glu101Lys | p.E101K | Q9UBB9 | protein_coding | tolerated(0.16) | benign(0.04) | TCGA-AA-A00N-01 | Colorectum | colon adenocarcinoma | Male | >=65 | I/II | Unknown | Unknown | PD |
| TFIP11 | SNV | Missense_Mutation | rs541912807 | c.1469N>A | p.Arg490Gln | p.R490Q | Q9UBB9 | protein_coding | deleterious(0.04) | probably_damaging(0.99) | TCGA-AZ-4315-01 | Colorectum | colon adenocarcinoma | Male | <65 | I/II | Unknown | Unknown | SD |
| TFIP11 | SNV | Missense_Mutation | rs752321351 | c.590N>A | p.Arg197His | p.R197H | Q9UBB9 | protein_coding | deleterious(0.01) | possibly_damaging(0.635) | TCGA-AZ-4315-01 | Colorectum | colon adenocarcinoma | Male | <65 | I/II | Unknown | Unknown | SD |
| Page: 1 2 3 4 5 6 7 8 9 |
Top |
Related drugs of malignant transformation related genes |
| Identification of chemicals and drugs interact with genes involved in malignant transfromation |
| (DGIdb 4.0) |
| Entrez ID | Symbol | Category | Interaction Types | Drug Claim Name | Drug Name | PMIDs |
| Page: 1 |

Copyright 2023-Present -The University of Texas Health Science Center at Houston |