
|
|||||
|
 | |
| |
| |
| |
| |
| |
|
Gene: TFF3 |
Gene summary for TFF3 |
| Gene information | Species | Human | Gene symbol | TFF3 | Gene ID | 7033 |
| Gene name | trefoil factor 3 | |
| Gene Alias | ITF | |
| Cytomap | 21q22.3 | |
| Gene Type | protein-coding | GO ID | GO:0001894 | UniProtAcc | A0A0A6YYJ4 |
Top |
Malignant transformation analysis |
| Identification of the aberrant gene expression in precancerous and cancerous lesions by comparing the gene expression of stem-like cells in diseased tissues with normal stem cells |
| Entrez ID | Symbol | Replicates | Species | Organ | Tissue | Adj P-value | Log2FC | Malignancy |
| 7033 | TFF3 | GSM4909281 | Human | Breast | IDC | 6.58e-19 | -5.32e-01 | 0.21 |
| 7033 | TFF3 | GSM4909282 | Human | Breast | IDC | 2.03e-13 | -5.10e-01 | -0.0288 |
| 7033 | TFF3 | GSM4909285 | Human | Breast | IDC | 3.48e-16 | -5.29e-01 | 0.21 |
| 7033 | TFF3 | GSM4909286 | Human | Breast | IDC | 1.78e-16 | -5.29e-01 | 0.1081 |
| 7033 | TFF3 | GSM4909287 | Human | Breast | IDC | 5.47e-11 | -5.11e-01 | 0.2057 |
| 7033 | TFF3 | GSM4909288 | Human | Breast | IDC | 9.46e-03 | -5.32e-01 | 0.0988 |
| 7033 | TFF3 | GSM4909293 | Human | Breast | IDC | 2.59e-10 | 3.19e-01 | 0.1581 |
| 7033 | TFF3 | GSM4909294 | Human | Breast | IDC | 6.81e-65 | 1.32e+00 | 0.2022 |
| 7033 | TFF3 | GSM4909295 | Human | Breast | IDC | 5.31e-03 | -5.04e-01 | 0.0898 |
| 7033 | TFF3 | GSM4909297 | Human | Breast | IDC | 1.44e-36 | 1.07e+00 | 0.1517 |
| 7033 | TFF3 | GSM4909298 | Human | Breast | IDC | 7.13e-28 | 7.39e-01 | 0.1551 |
| 7033 | TFF3 | GSM4909301 | Human | Breast | IDC | 5.59e-40 | 9.83e-01 | 0.1577 |
| 7033 | TFF3 | GSM4909303 | Human | Breast | IDC | 6.55e-08 | 8.10e-01 | 0.0438 |
| 7033 | TFF3 | GSM4909304 | Human | Breast | IDC | 3.43e-54 | 1.11e+00 | 0.1636 |
| 7033 | TFF3 | GSM4909306 | Human | Breast | IDC | 8.72e-10 | 4.77e-01 | 0.1564 |
| 7033 | TFF3 | GSM4909307 | Human | Breast | IDC | 5.81e-27 | 8.34e-01 | 0.1569 |
| 7033 | TFF3 | GSM4909308 | Human | Breast | IDC | 2.06e-100 | 1.47e+00 | 0.158 |
| 7033 | TFF3 | GSM4909311 | Human | Breast | IDC | 1.03e-16 | 5.95e-01 | 0.1534 |
| 7033 | TFF3 | GSM4909312 | Human | Breast | IDC | 1.80e-86 | 1.42e+00 | 0.1552 |
| 7033 | TFF3 | GSM4909317 | Human | Breast | IDC | 1.31e-22 | 8.41e-01 | 0.1355 |
| Page: 1 2 3 4 5 6 7 8 9 10 11 |
| Tissue | Expression Dynamics | Abbreviation |
| Breast | 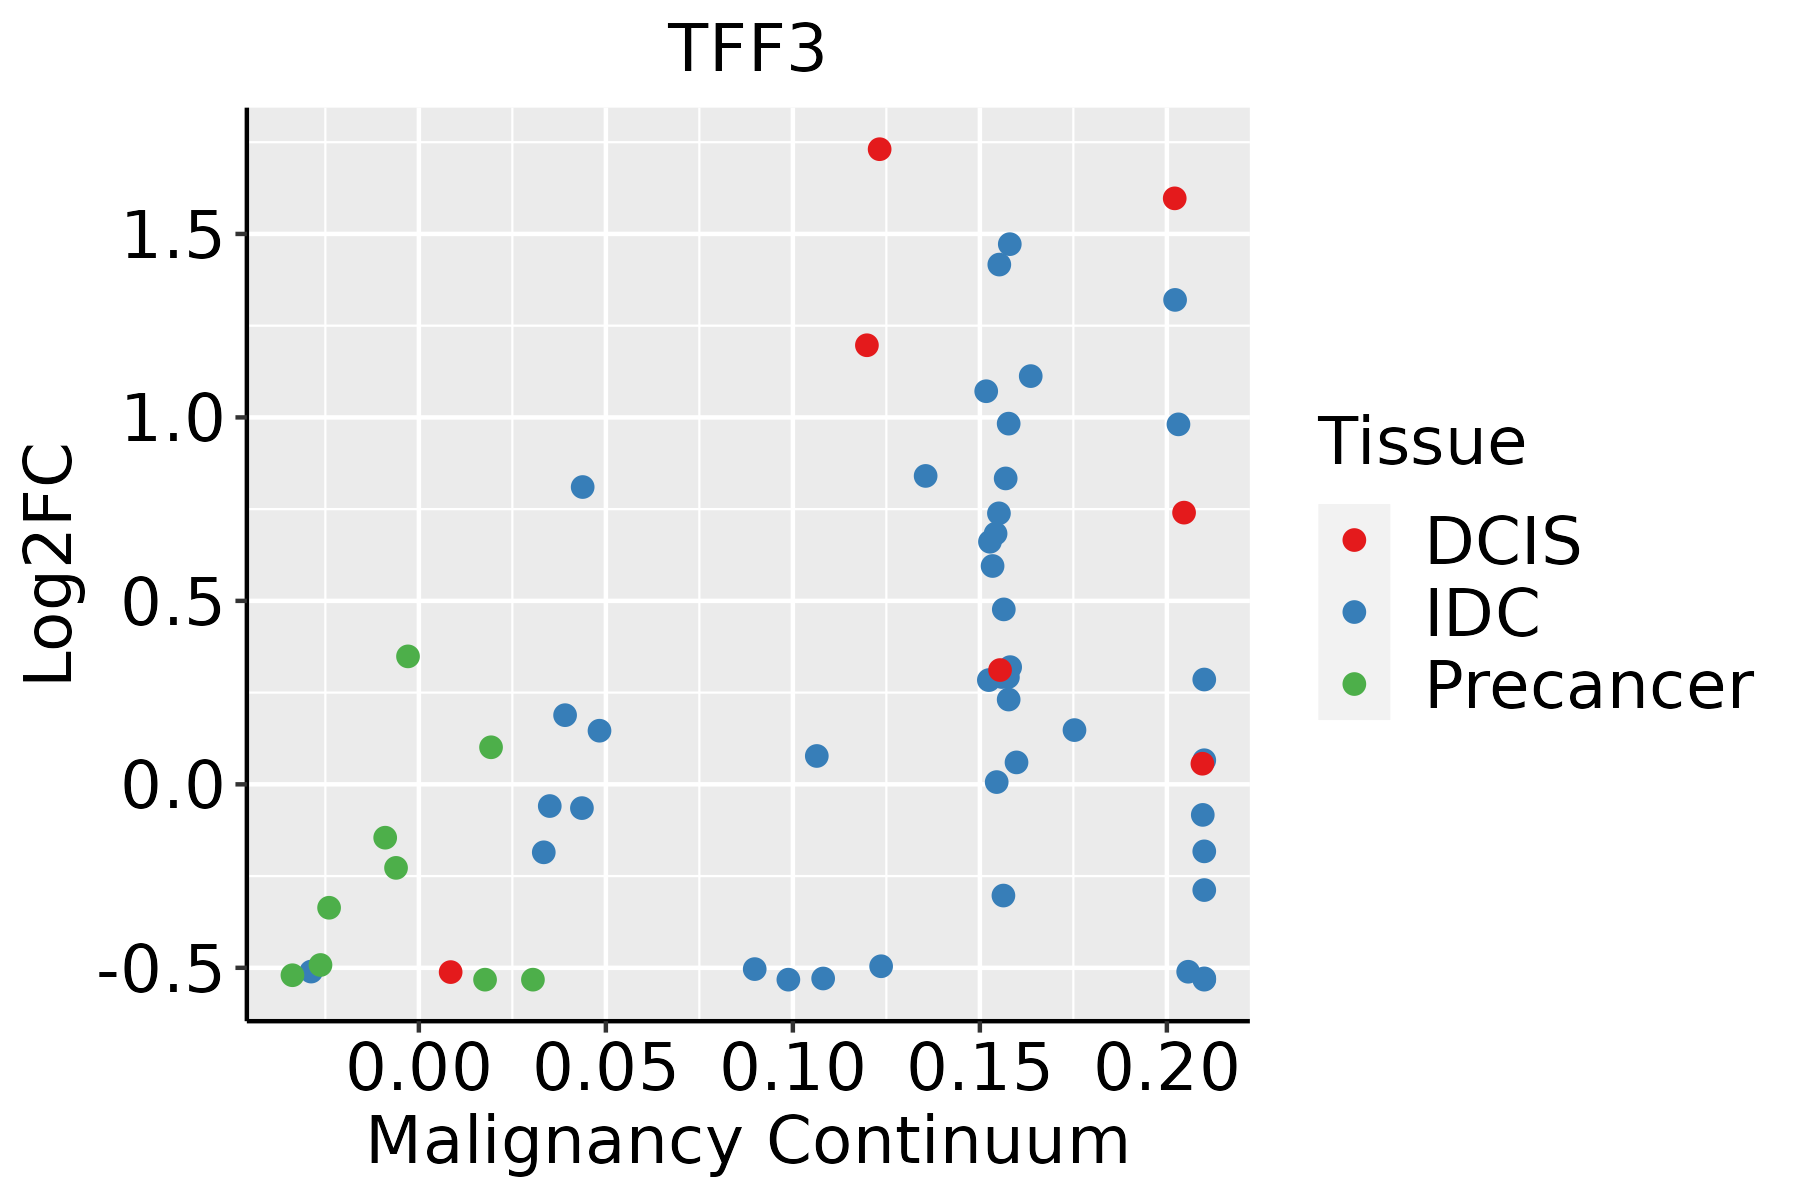 | IDC: Invasive ductal carcinoma |
| DCIS: Ductal carcinoma in situ | ||
| Precancer(BRCA1-mut): Precancerous lesion from BRCA1 mutation carriers | ||
| Cervix | 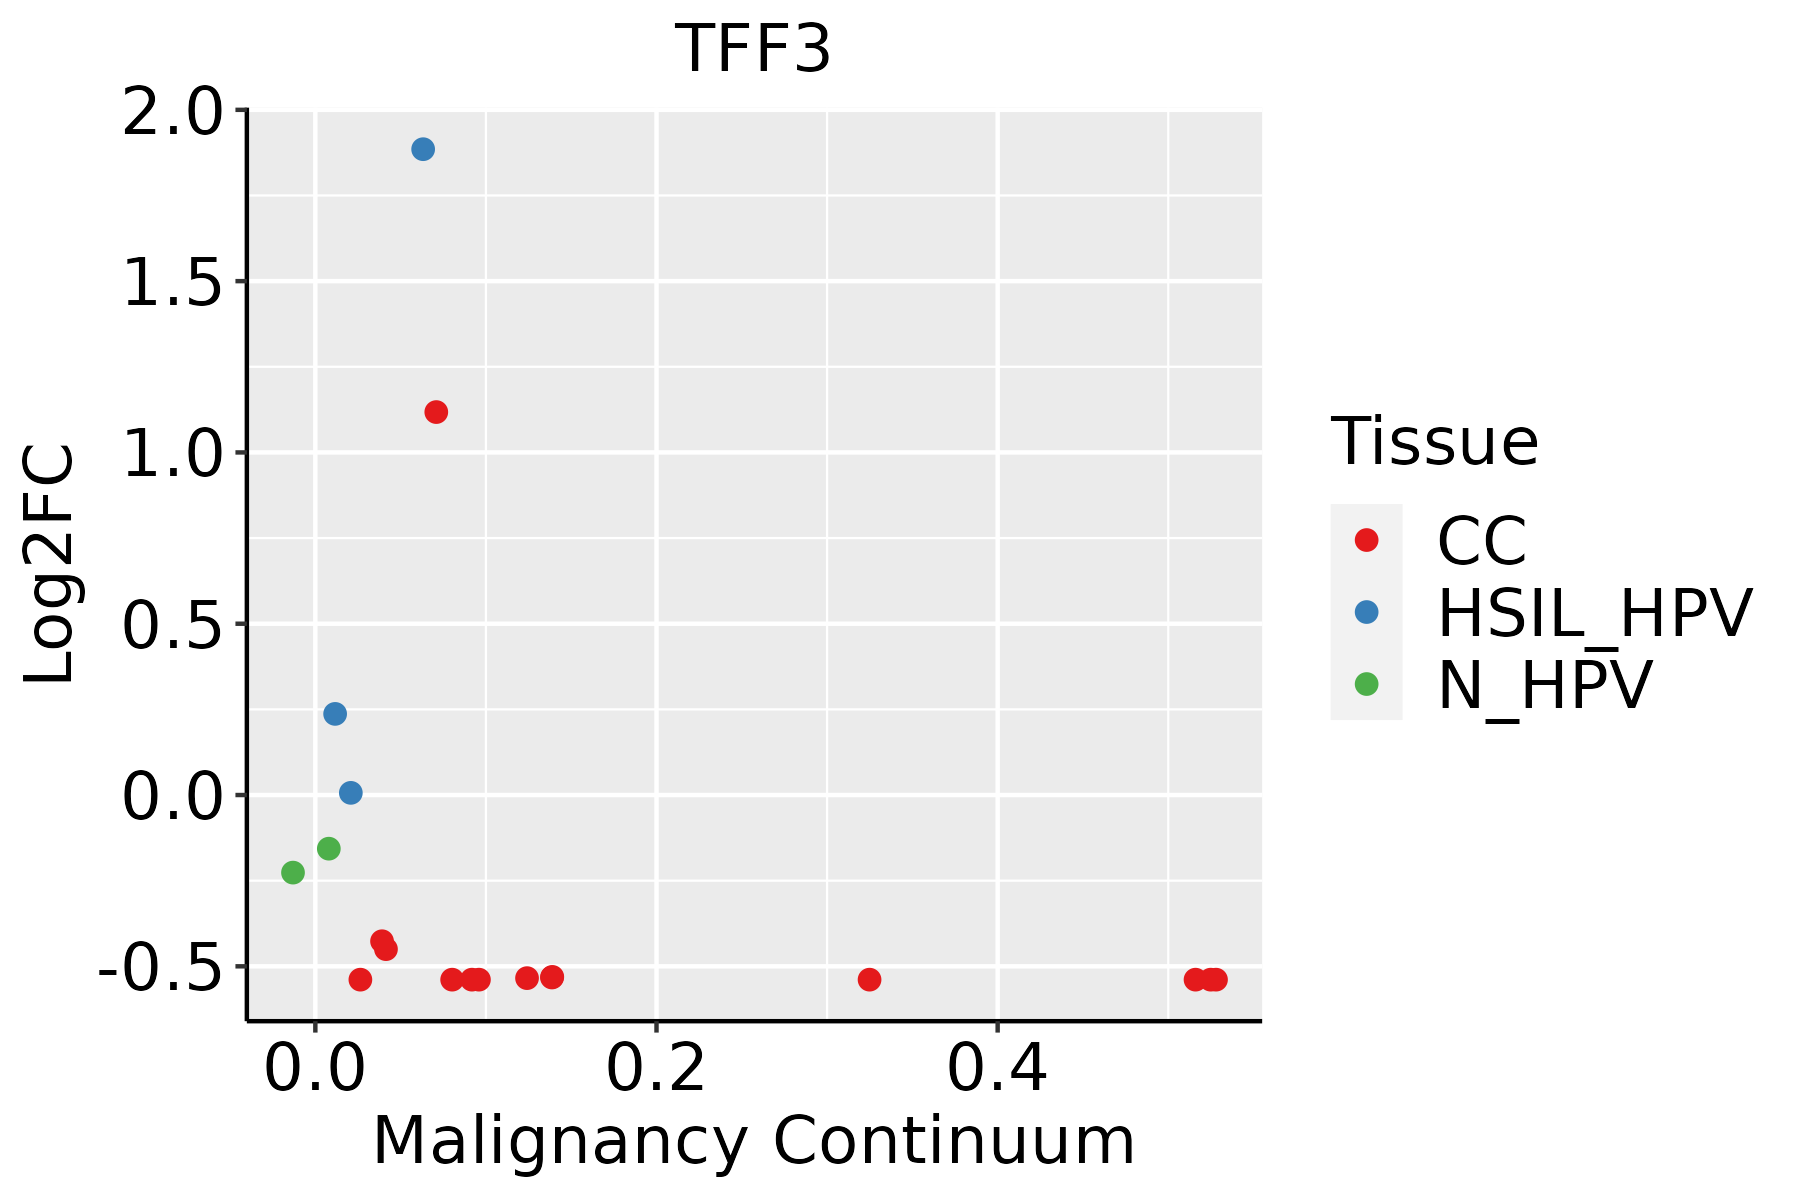 | CC: Cervix cancer |
| HSIL_HPV: HPV-infected high-grade squamous intraepithelial lesions | ||
| N_HPV: HPV-infected normal cervix | ||
| Colorectum (GSE201348) |  | FAP: Familial adenomatous polyposis |
| CRC: Colorectal cancer | ||
| Colorectum (HTA11) |  | AD: Adenomas |
| SER: Sessile serrated lesions | ||
| MSI-H: Microsatellite-high colorectal cancer | ||
| MSS: Microsatellite stable colorectal cancer | ||
| Endometrium |  | AEH: Atypical endometrial hyperplasia |
| EEC: Endometrioid Cancer | ||
| Esophagus | 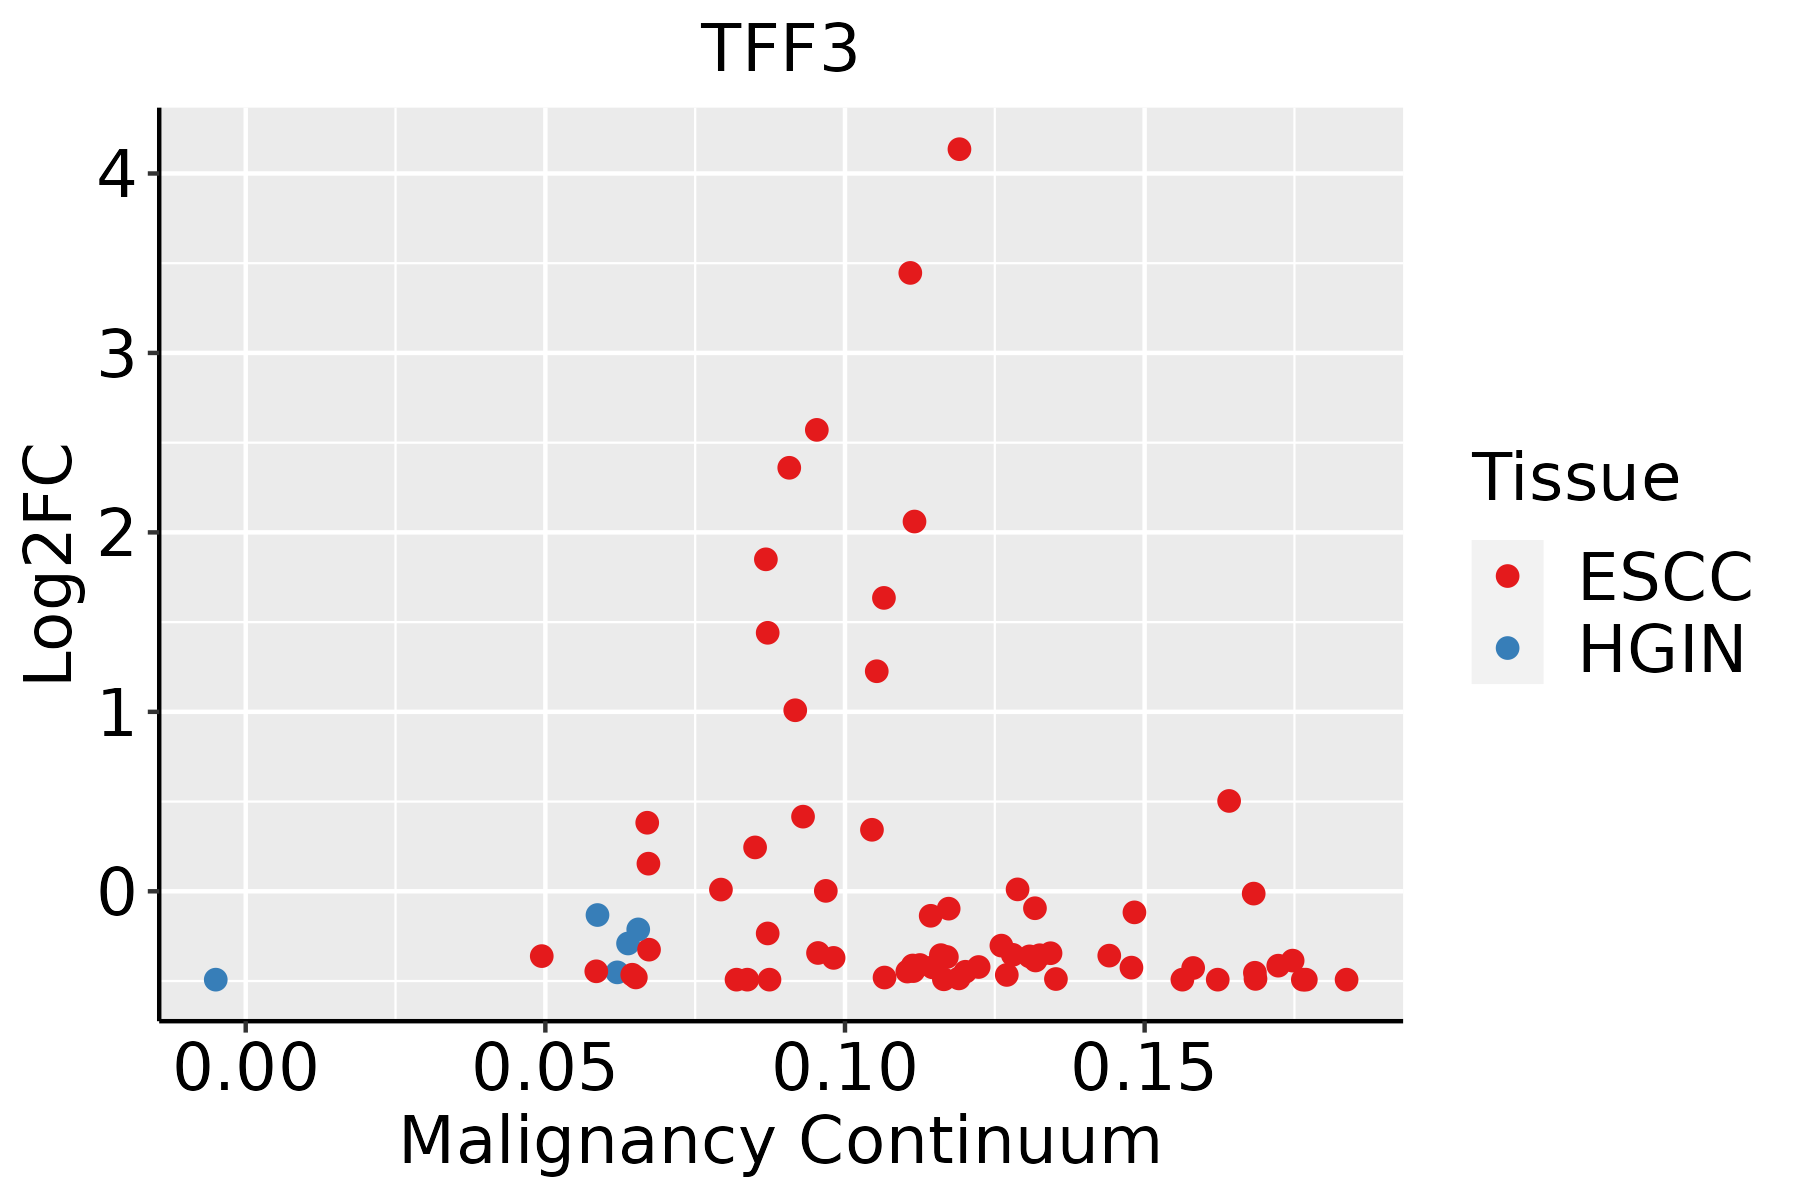 | ESCC: Esophageal squamous cell carcinoma |
| HGIN: High-grade intraepithelial neoplasias | ||
| LGIN: Low-grade intraepithelial neoplasias | ||
| GC | 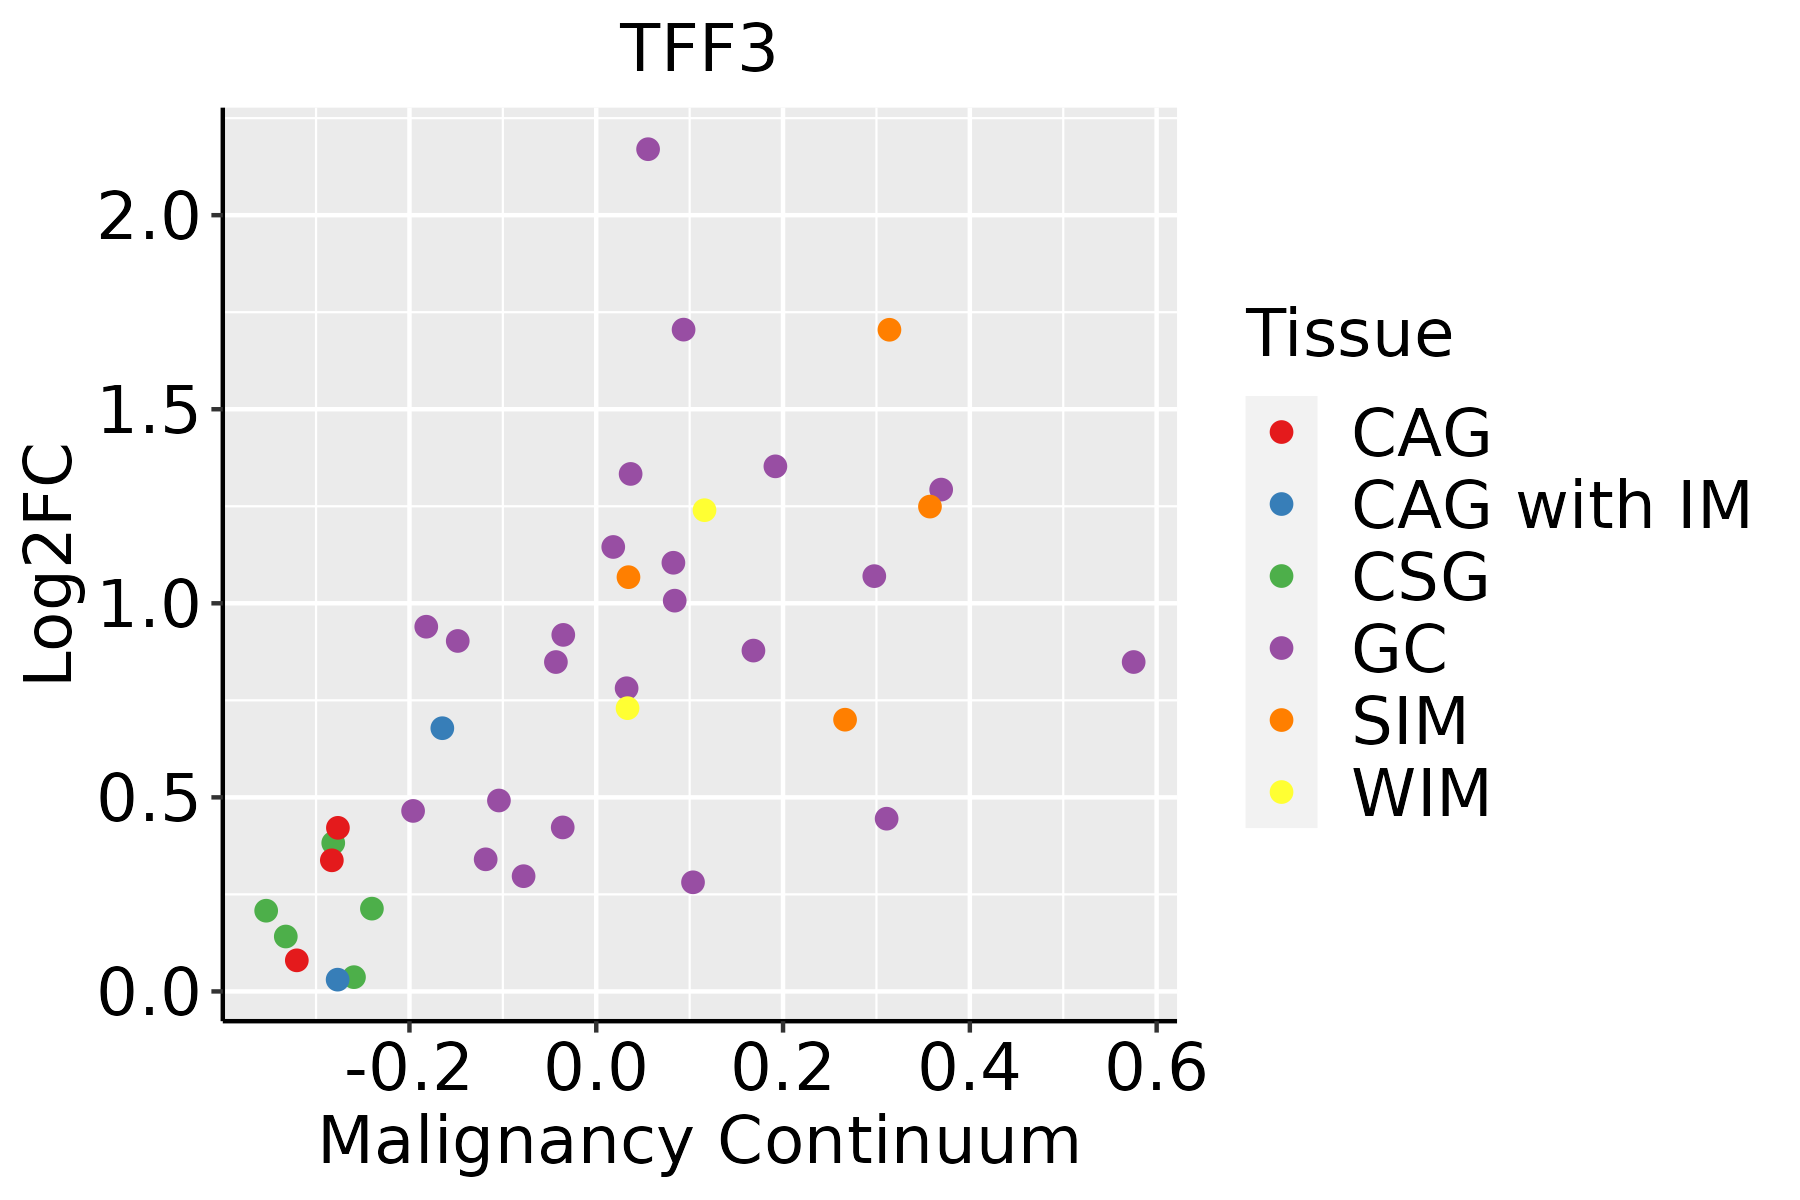 | CAG: Chronic atrophic gastritis |
| CAG with IM: Chronic atrophic gastritis with intestinal metaplasia | ||
| CSG: Chronic superficial gastritis | ||
| GC: Gastric cancer | ||
| SIM: Severe intestinal metaplasia | ||
| WIM: Wild intestinal metaplasia | ||
| Liver | 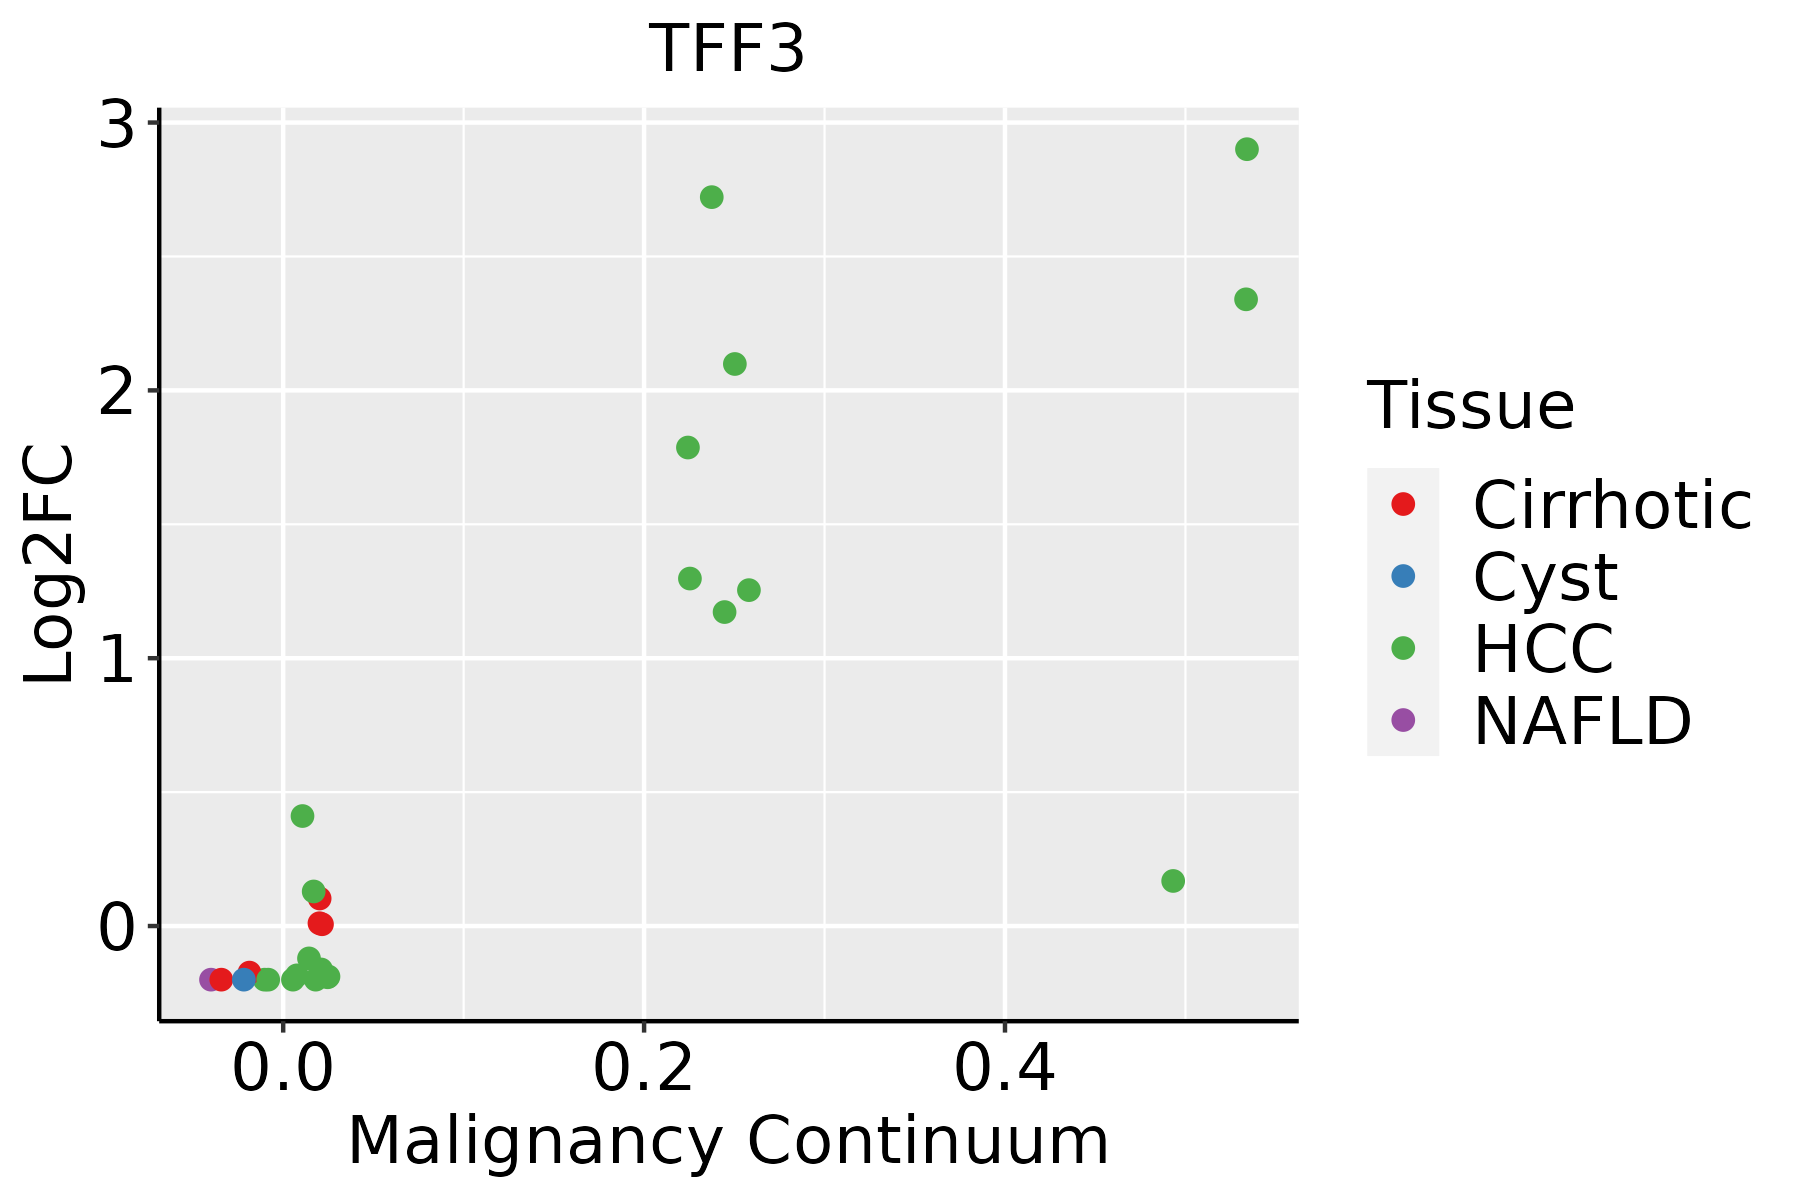 | HCC: Hepatocellular carcinoma |
| NAFLD: Non-alcoholic fatty liver disease | ||
| Oral Cavity | 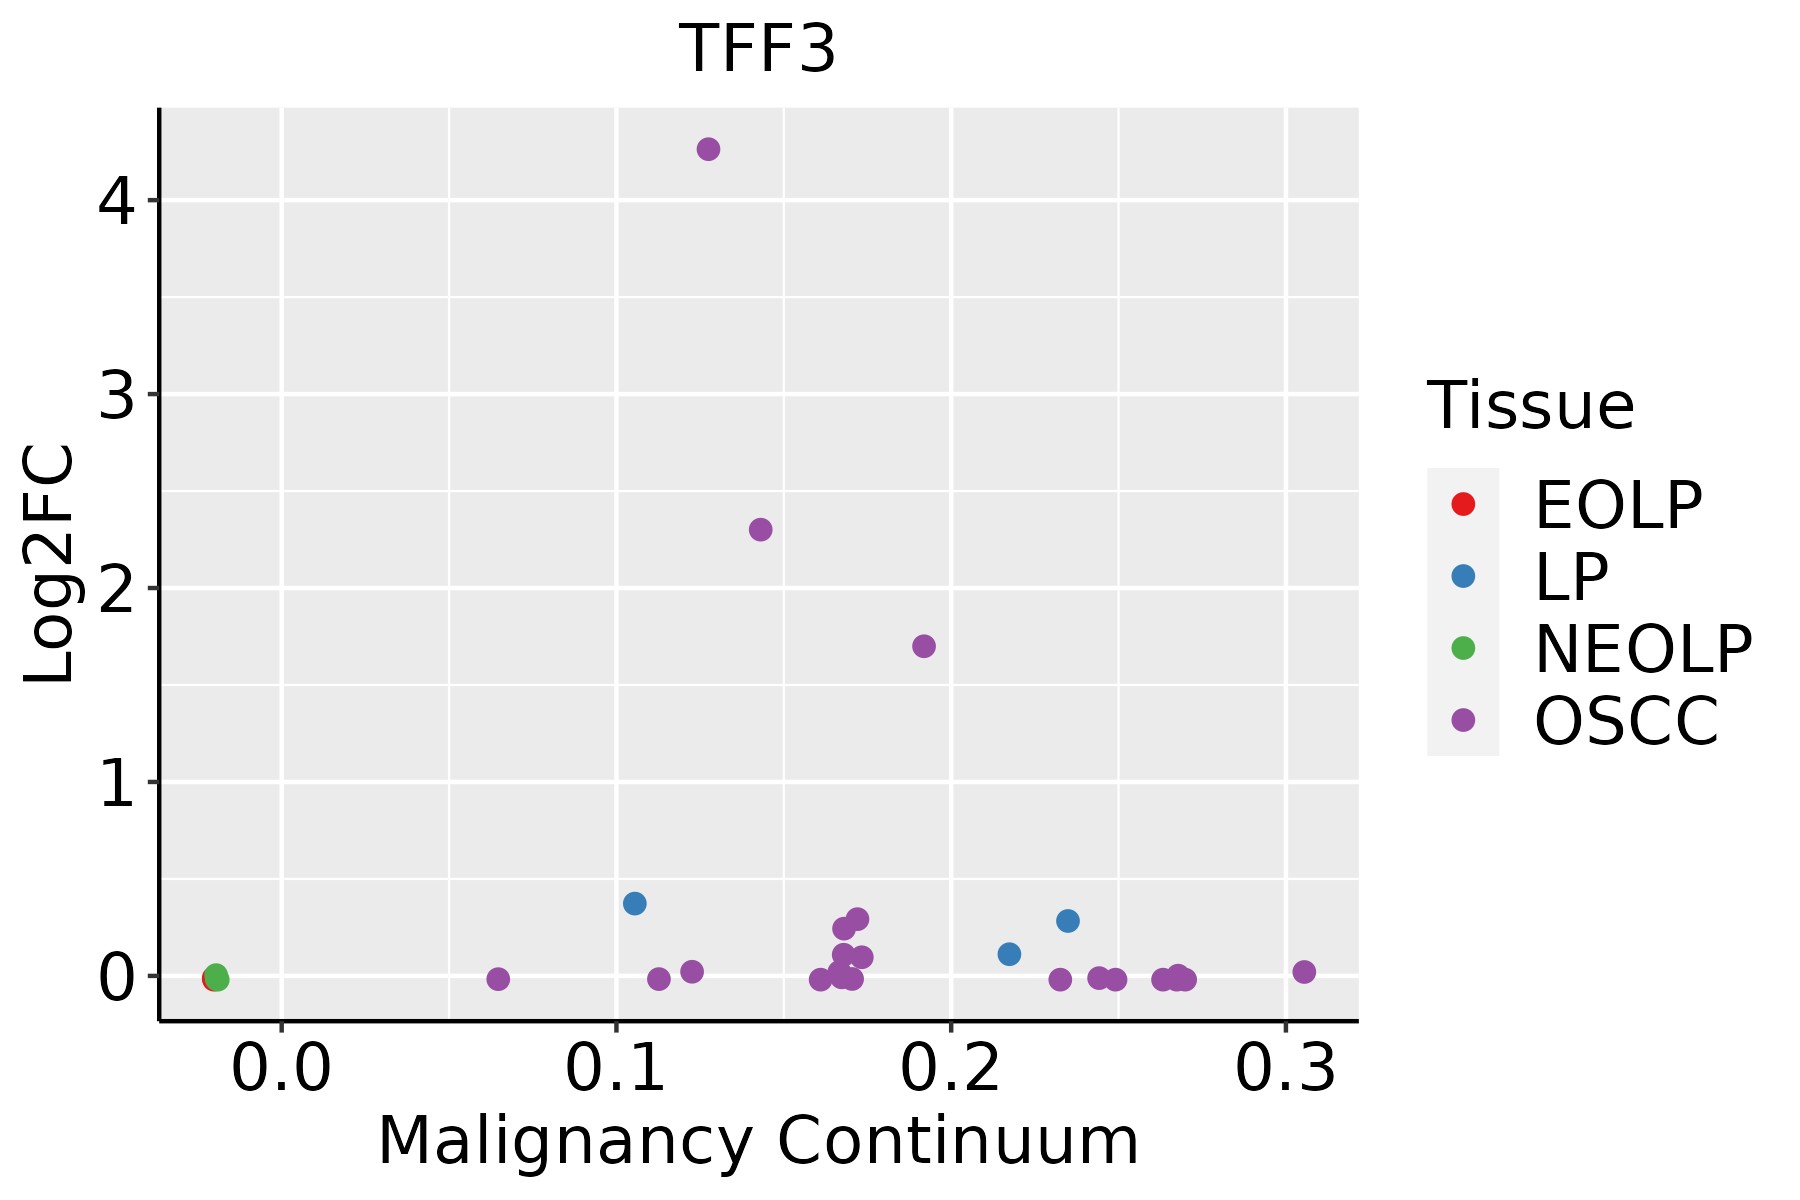 | EOLP: Erosive Oral lichen planus |
| LP: leukoplakia | ||
| NEOLP: Non-erosive oral lichen planus | ||
| OSCC: Oral squamous cell carcinoma | ||
| Prostate |  | BPH: Benign Prostatic Hyperplasia |
| Thyroid | 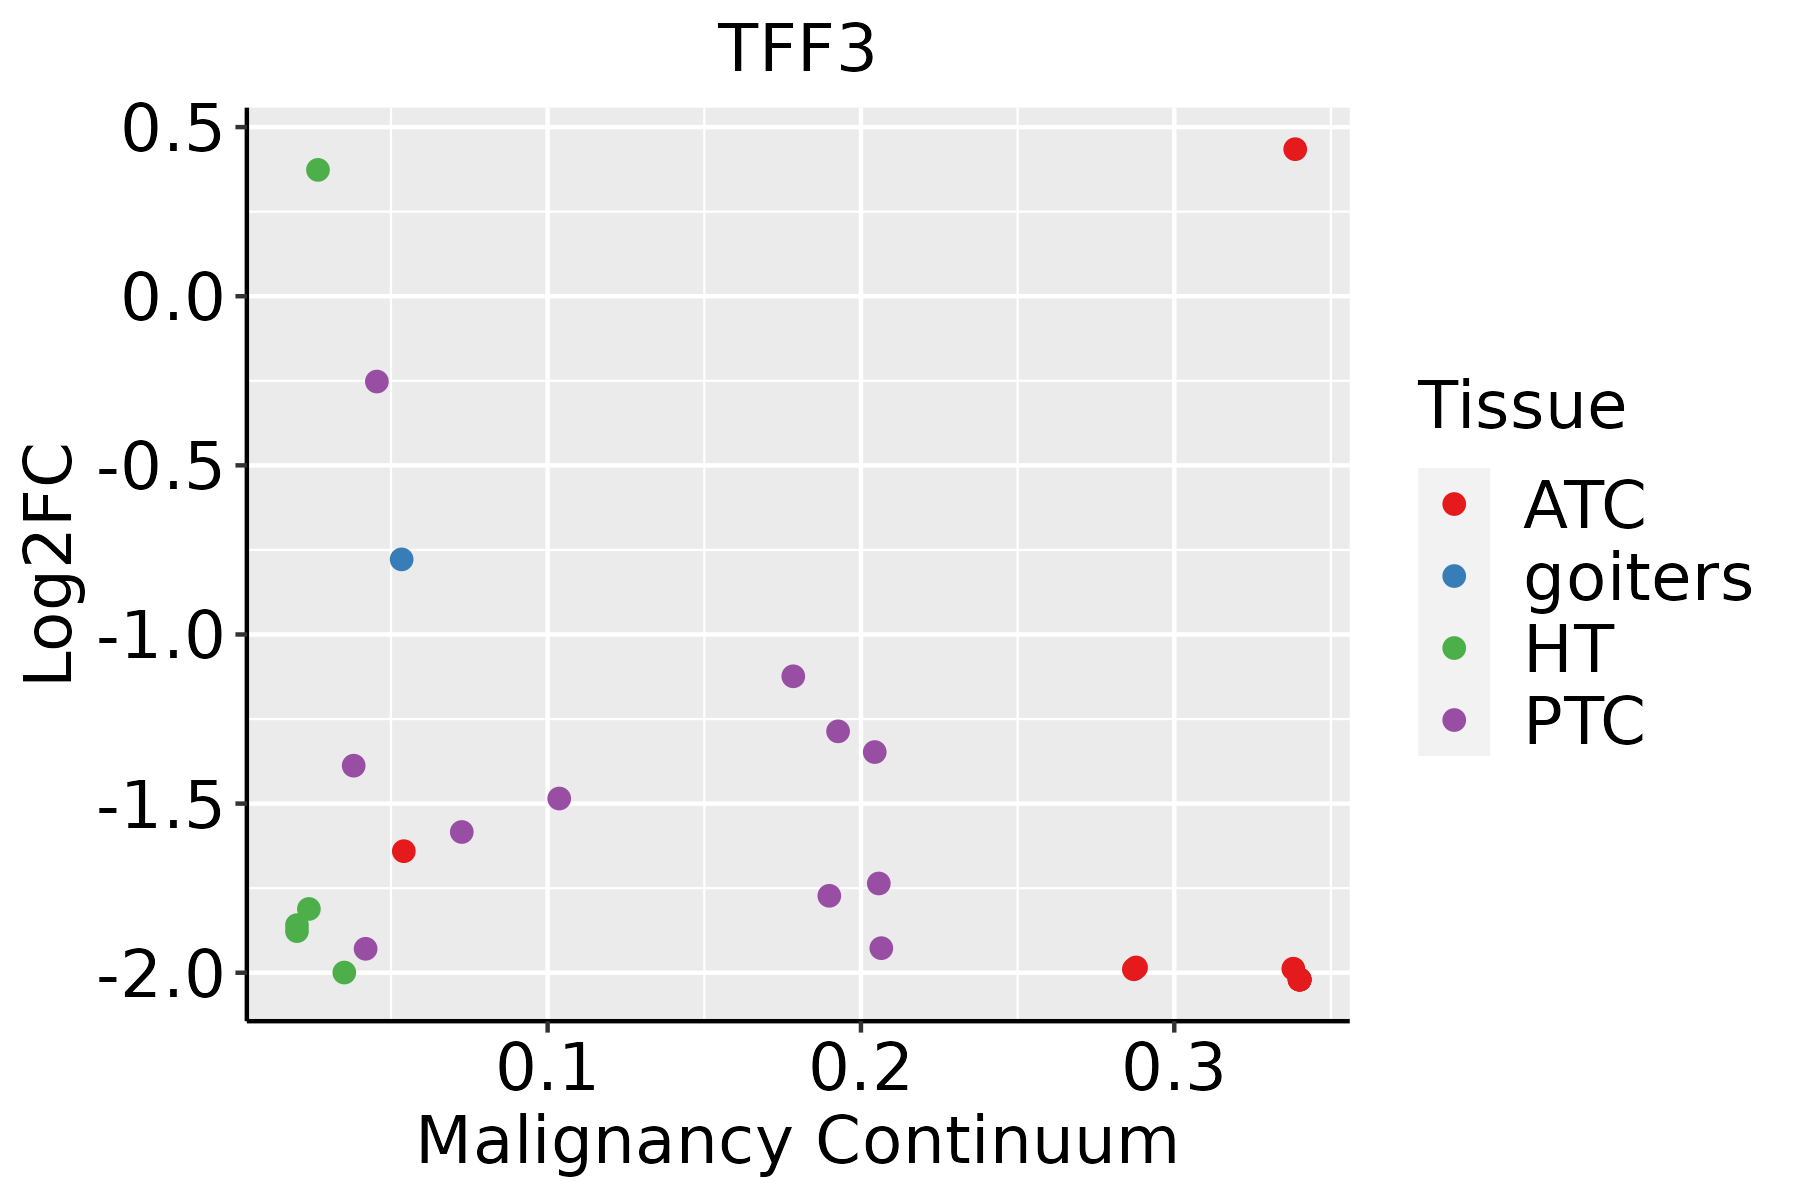 | ATC: Anaplastic thyroid cancer |
| HT: Hashimoto's thyroiditis | ||
| PTC: Papillary thyroid cancer |
| ∗log2FC in expression of this searched gene in stem-like cells from each diseased tissue sample relative to stem-like cells in normal samples in each tissue plotted against the malignancy continuum. Samples are colored based on if they are from different disease stage. |
Top |
Malignant transformation related pathway analysis |
| Find out the enriched GO biological processes and KEGG pathways involved in transition from healthy to precancer to cancer |
| Tissue | Disease Stage | Enriched GO biological Processes |
| Colorectum | AD |  |
| Colorectum | SER |  |
| Colorectum | MSS |  |
| Colorectum | MSI-H |  |
| Colorectum | FAP |  |
| ∗Top 15 enriched GO BP terms are showed in the bar plot of each disease state in each tissue. Each row represents a significant GO biological process which is colored according to the -log10(p.adjust). |
| Page: 1 2 3 4 5 6 7 8 9 |
| GO ID | Tissue | Disease Stage | Description | Gene Ratio | Bg Ratio | pvalue | p.adjust | Count |
| GO:00060066 | Breast | Precancer | glucose metabolic process | 23/1080 | 196/18723 | 9.54e-04 | 1.07e-02 | 23 |
| GO:00059966 | Breast | Precancer | monosaccharide metabolic process | 27/1080 | 257/18723 | 1.94e-03 | 1.88e-02 | 27 |
| GO:00193186 | Breast | Precancer | hexose metabolic process | 25/1080 | 237/18723 | 2.64e-03 | 2.36e-02 | 25 |
| GO:00620126 | Breast | Precancer | regulation of small molecule metabolic process | 32/1080 | 334/18723 | 3.45e-03 | 2.87e-02 | 32 |
| GO:00018948 | Breast | Precancer | tissue homeostasis | 27/1080 | 268/18723 | 3.49e-03 | 2.90e-02 | 27 |
| GO:000189413 | Breast | IDC | tissue homeostasis | 34/1434 | 268/18723 | 2.54e-03 | 2.28e-02 | 34 |
| GO:000189423 | Breast | DCIS | tissue homeostasis | 33/1390 | 268/18723 | 2.88e-03 | 2.48e-02 | 33 |
| GO:000600612 | Breast | DCIS | glucose metabolic process | 25/1390 | 196/18723 | 5.59e-03 | 4.06e-02 | 25 |
| GO:006201213 | Breast | DCIS | regulation of small molecule metabolic process | 38/1390 | 334/18723 | 5.69e-03 | 4.10e-02 | 38 |
| GO:00018949 | Cervix | CC | tissue homeostasis | 57/2311 | 268/18723 | 2.43e-05 | 4.21e-04 | 57 |
| GO:00602498 | Cervix | CC | anatomical structure homeostasis | 63/2311 | 314/18723 | 6.03e-05 | 8.68e-04 | 63 |
| GO:000189414 | Cervix | HSIL_HPV | tissue homeostasis | 25/737 | 268/18723 | 6.17e-05 | 1.46e-03 | 25 |
| GO:006024913 | Cervix | HSIL_HPV | anatomical structure homeostasis | 25/737 | 314/18723 | 7.04e-04 | 9.40e-03 | 25 |
| GO:0019318 | Colorectum | AD | hexose metabolic process | 77/3918 | 237/18723 | 1.96e-05 | 4.01e-04 | 77 |
| GO:0044262 | Colorectum | AD | cellular carbohydrate metabolic process | 87/3918 | 283/18723 | 6.00e-05 | 1.01e-03 | 87 |
| GO:0005996 | Colorectum | AD | monosaccharide metabolic process | 80/3918 | 257/18723 | 7.31e-05 | 1.17e-03 | 80 |
| GO:0060249 | Colorectum | AD | anatomical structure homeostasis | 94/3918 | 314/18723 | 9.37e-05 | 1.42e-03 | 94 |
| GO:0001894 | Colorectum | AD | tissue homeostasis | 81/3918 | 268/18723 | 1.96e-04 | 2.62e-03 | 81 |
| GO:0006006 | Colorectum | AD | glucose metabolic process | 62/3918 | 196/18723 | 2.76e-04 | 3.39e-03 | 62 |
| GO:0006109 | Colorectum | AD | regulation of carbohydrate metabolic process | 55/3918 | 178/18723 | 1.10e-03 | 1.01e-02 | 55 |
| Page: 1 2 3 4 5 6 7 8 |
| Pathway ID | Tissue | Disease Stage | Description | Gene Ratio | Bg Ratio | pvalue | p.adjust | qvalue | Count |
| Page: 1 |
Top |
Cell-cell communication analysis |
| Identification of potential cell-cell interactions between two cell types and their ligand-receptor pairs for different disease states |
| Ligand | Receptor | LRpair | Pathway | Tissue | Disease Stage |
| Page: 1 |
Top |
Single-cell gene regulatory network inference analysis |
| Find out the significant the regulons (TFs) and the target genes of each regulon across cell types for different disease states |
| TF | Cell Type | Tissue | Disease Stage | Target Gene | RSS | Regulon Activity |
| TFF3 | MLUM | Breast | DCIS | TFF1,SCGB1D2,C1QC, etc. | 6.43e-01 |  |
| TFF3 | BMEM | Breast | ADJ | TFF1,PIP,KRT18, etc. | 2.82e-01 |  |
| TFF3 | NK | Breast | DCIS | TFF1,PIP,KRT18, etc. | 1.23e-01 | |
| TFF3 | BMEM | Breast | Healthy | TFF1,PIP,KRT18, etc. | 1.11e-01 |  |
| TFF3 | NK | Breast | Healthy | TFF1,PIP,KRT18, etc. | 1.33e-01 | |
| TFF3 | NK | Breast | IDC | TFF1,PIP,KRT18, etc. | 1.13e-01 |  |
| TFF3 | BMEM | Breast | IDC | TFF1,PIP,KRT18, etc. | 1.07e-01 | |
| TFF3 | BMEM | Breast | Precancer | TFF1,PIP,KRT18, etc. | 1.33e-01 |  |
| TFF3 | FIB | Breast | ADJ | TFF1,CCL21,NPC2, etc. | 6.09e-02 | |
| TFF3 | FIB | Breast | DCIS | TFF1,CCL21,NPC2, etc. | 7.49e-01 | |
| ∗The dot plots of a searched regulon are shown for all cell subpopulations in each disease state of each tissue based on the regulon specific score inferred using pySCENIC and by calculating the average expression. |
| Page: 1 2 3 4 |
Top |
Somatic mutation of malignant transformation related genes |
| Annotation of somatic variants for genes involved in malignant transformation |
| Hugo Symbol | Variant Class | Variant Classification | dbSNP RS | HGVSc | HGVSp | HGVSp Short | SWISSPROT | BIOTYPE | SIFT | PolyPhen | Tumor Sample Barcode | Tissue | Histology | Sex | Age | Stage | Therapy Types | Drugs | Outcome |
| TFF3 | SNV | Missense_Mutation | novel | c.192N>T | p.Lys64Asn | p.K64N | protein_coding | tolerated(0.05) | benign(0.037) | TCGA-AP-A059-01 | Endometrium | uterine corpus endometrioid carcinoma | Female | >=65 | I/II | Unknown | Unknown | SD | |
| TFF3 | SNV | Missense_Mutation | novel | c.145C>T | p.Pro49Ser | p.P49S | protein_coding | tolerated(0.14) | possibly_damaging(0.828) | TCGA-B5-A3FC-01 | Endometrium | uterine corpus endometrioid carcinoma | Female | <65 | I/II | Unknown | Unknown | SD | |
| TFF3 | SNV | Missense_Mutation | novel | c.50N>T | p.Ala17Val | p.A17V | protein_coding | tolerated(0.5) | benign(0.051) | TCGA-66-2780-01 | Lung | lung squamous cell carcinoma | Male | >=65 | I/II | Unknown | Unknown | SD | |
| TFF3 | SNV | Missense_Mutation | rs780786070 | c.268N>A | p.Ala90Thr | p.A90T | protein_coding | tolerated(0.73) | benign(0.001) | TCGA-CD-8529-01 | Stomach | stomach adenocarcinoma | Male | >=65 | III/IV | Chemotherapy | epirubicin | CR | |
| TFF3 | insertion | Frame_Shift_Ins | novel | c.189_190insC | p.Lys64GlnfsTer11 | p.K64Qfs*11 | protein_coding | TCGA-HU-A4GT-01 | Stomach | stomach adenocarcinoma | Female | >=65 | I/II | Chemotherapy | copolang | SD |
| Page: 1 |
Top |
Related drugs of malignant transformation related genes |
| Identification of chemicals and drugs interact with genes involved in malignant transfromation |
| (DGIdb 4.0) |
| Entrez ID | Symbol | Category | Interaction Types | Drug Claim Name | Drug Name | PMIDs |
| 7033 | TFF3 | DRUGGABLE GENOME | TAMOXIFEN | TAMOXIFEN | 25900183 | |
| 7033 | TFF3 | DRUGGABLE GENOME | AMINOGLUTETHIMIDE | AMINOGLUTETHIMIDE | 25900183 |
| Page: 1 |

Copyright 2023-Present -The University of Texas Health Science Center at Houston |