
|
|||||
|
 | |
| |
| |
| |
| |
| |
|
Gene: TFF2 |
Gene summary for TFF2 |
| Gene information | Species | Human | Gene symbol | TFF2 | Gene ID | 7032 |
| Gene name | trefoil factor 2 | |
| Gene Alias | SML1 | |
| Cytomap | 21q22.3 | |
| Gene Type | protein-coding | GO ID | GO:0001696 | UniProtAcc | Q03403 |
Top |
Malignant transformation analysis |
| Identification of the aberrant gene expression in precancerous and cancerous lesions by comparing the gene expression of stem-like cells in diseased tissues with normal stem cells |
| Entrez ID | Symbol | Replicates | Species | Organ | Tissue | Adj P-value | Log2FC | Malignancy |
| 7032 | TFF2 | HCC2_Meng | Human | Liver | HCC | 1.09e-91 | 1.10e+00 | 0.0107 |
| 7032 | TFF2 | S014 | Human | Liver | HCC | 1.34e-38 | 1.68e+00 | 0.2254 |
| 7032 | TFF2 | S015 | Human | Liver | HCC | 3.06e-51 | 2.78e+00 | 0.2375 |
| 7032 | TFF2 | S016 | Human | Liver | HCC | 3.62e-53 | 2.30e+00 | 0.2243 |
| 7032 | TFF2 | HTA12-3-16 | Human | Pancreas | PDAC | 1.74e-10 | 1.37e+00 | 0.1553 |
| 7032 | TFF2 | HTA12-9-1 | Human | Pancreas | PDAC | 3.70e-11 | 7.37e-01 | 0.1532 |
| 7032 | TFF2 | DS20191261Tumor | Human | Pancreas | PDAC | 2.75e-08 | 7.03e-01 | 0.1367 |
| 7032 | TFF2 | DS20191261TumorKeller | Human | Pancreas | PDAC | 1.52e-02 | 7.66e-01 | 0.1407 |
| 7032 | TFF2 | Pat01-B | Human | Stomach | GC | 1.13e-18 | -7.25e-01 | 0.5754 |
| 7032 | TFF2 | Pat02-B | Human | Stomach | GC | 1.30e-21 | -3.76e-02 | 0.0368 |
| 7032 | TFF2 | Pat04-B | Human | Stomach | GC | 8.43e-07 | 2.14e-01 | -0.1483 |
| 7032 | TFF2 | Pat06-B | Human | Stomach | GC | 1.73e-18 | 2.99e-02 | -0.1961 |
| 7032 | TFF2 | Pat07-B | Human | Stomach | GC | 6.77e-11 | -1.20e+00 | 0.0935 |
| 7032 | TFF2 | Pat08-B | Human | Stomach | GC | 1.96e-05 | -8.72e-01 | 0.0182 |
| 7032 | TFF2 | Pat09-B | Human | Stomach | GC | 3.02e-14 | -7.37e-01 | -0.0359 |
| 7032 | TFF2 | Pat11-B | Human | Stomach | GC | 6.56e-14 | 6.56e-01 | -0.182 |
| 7032 | TFF2 | Pat12-B | Human | Stomach | GC | 4.42e-26 | -7.71e-01 | 0.0325 |
| 7032 | TFF2 | Pat13-B | Human | Stomach | GC | 3.51e-09 | -3.47e-02 | 0.0555 |
| 7032 | TFF2 | Pat16-B | Human | Stomach | GC | 6.51e-45 | -1.35e+00 | 0.1918 |
| 7032 | TFF2 | Pat17-B | Human | Stomach | GC | 4.06e-12 | -5.70e-01 | 0.3109 |
| Page: 1 2 3 |
| Tissue | Expression Dynamics | Abbreviation |
| GC |  | CAG: Chronic atrophic gastritis |
| CAG with IM: Chronic atrophic gastritis with intestinal metaplasia | ||
| CSG: Chronic superficial gastritis | ||
| GC: Gastric cancer | ||
| SIM: Severe intestinal metaplasia | ||
| WIM: Wild intestinal metaplasia | ||
| Liver | 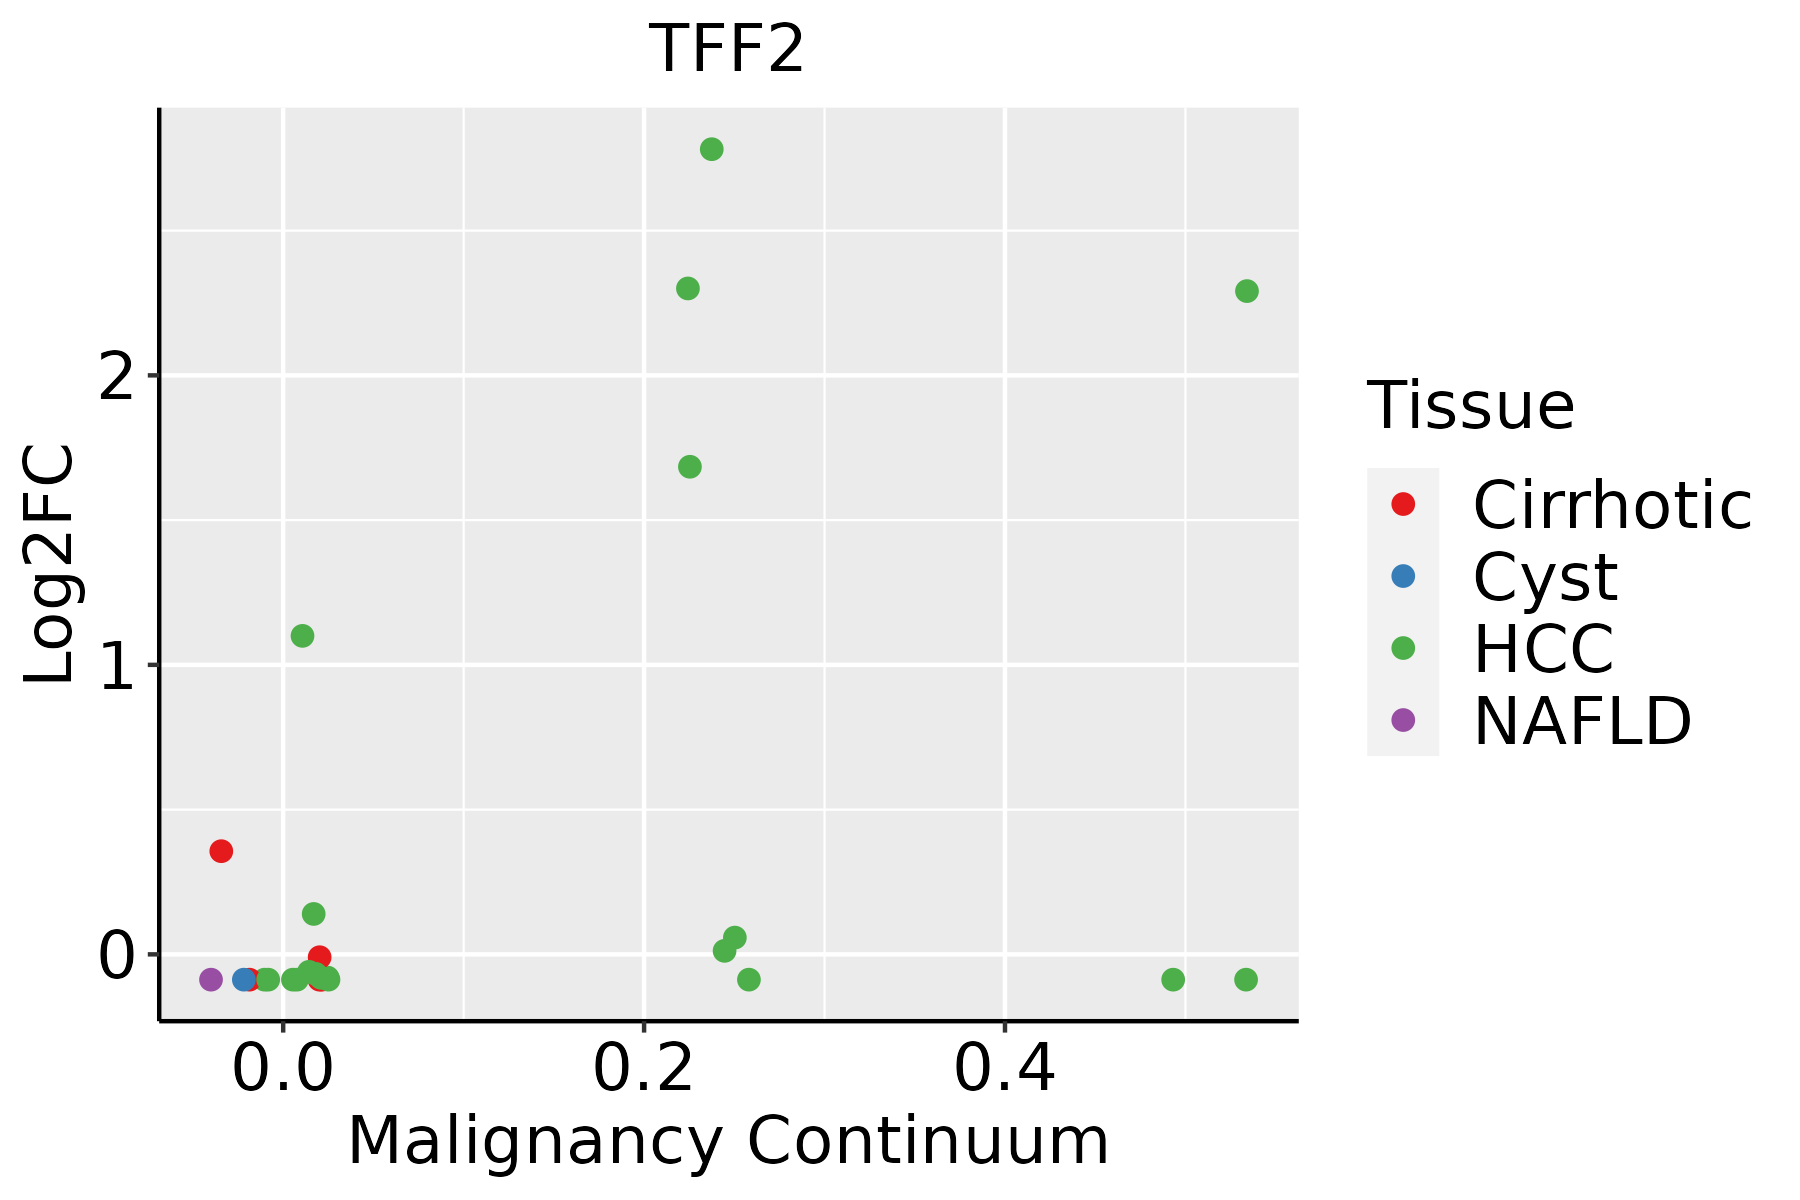 | HCC: Hepatocellular carcinoma |
| NAFLD: Non-alcoholic fatty liver disease |
| ∗log2FC in expression of this searched gene in stem-like cells from each diseased tissue sample relative to stem-like cells in normal samples in each tissue plotted against the malignancy continuum. Samples are colored based on if they are from different disease stage. |
Top |
Malignant transformation related pathway analysis |
| Find out the enriched GO biological processes and KEGG pathways involved in transition from healthy to precancer to cancer |
| Tissue | Disease Stage | Enriched GO biological Processes |
| Colorectum | AD |  |
| Colorectum | SER |  |
| Colorectum | MSS |  |
| Colorectum | MSI-H |  |
| Colorectum | FAP |  |
| ∗Top 15 enriched GO BP terms are showed in the bar plot of each disease state in each tissue. Each row represents a significant GO biological process which is colored according to the -log10(p.adjust). |
| Page: 1 2 3 4 5 6 7 8 9 |
| GO ID | Tissue | Disease Stage | Description | Gene Ratio | Bg Ratio | pvalue | p.adjust | Count |
| GO:0007586 | Stomach | GC | digestion | 38/1159 | 137/18723 | 1.80e-15 | 1.22e-12 | 38 |
| GO:00226006 | Stomach | GC | digestive system process | 30/1159 | 104/18723 | 5.40e-13 | 2.10e-10 | 30 |
| GO:00018946 | Stomach | GC | tissue homeostasis | 43/1159 | 268/18723 | 8.25e-09 | 8.22e-07 | 43 |
| GO:00602496 | Stomach | GC | anatomical structure homeostasis | 47/1159 | 314/18723 | 1.62e-08 | 1.40e-06 | 47 |
| GO:00302776 | Stomach | GC | maintenance of gastrointestinal epithelium | 9/1159 | 22/18723 | 3.09e-06 | 1.27e-04 | 9 |
| GO:00106696 | Stomach | GC | epithelial structure maintenance | 10/1159 | 30/18723 | 7.63e-06 | 2.77e-04 | 10 |
| GO:00075861 | Stomach | CAG with IM | digestion | 29/1050 | 137/18723 | 4.42e-10 | 6.93e-08 | 29 |
| GO:000189411 | Stomach | CAG with IM | tissue homeostasis | 42/1050 | 268/18723 | 1.40e-09 | 1.74e-07 | 42 |
| GO:006024911 | Stomach | CAG with IM | anatomical structure homeostasis | 46/1050 | 314/18723 | 2.18e-09 | 2.64e-07 | 46 |
| GO:002260011 | Stomach | CAG with IM | digestive system process | 22/1050 | 104/18723 | 5.62e-08 | 4.16e-06 | 22 |
| GO:003027711 | Stomach | CAG with IM | maintenance of gastrointestinal epithelium | 9/1050 | 22/18723 | 1.36e-06 | 6.46e-05 | 9 |
| GO:00106691 | Stomach | CAG with IM | epithelial structure maintenance | 10/1050 | 30/18723 | 3.16e-06 | 1.28e-04 | 10 |
| GO:000189421 | Stomach | CSG | tissue homeostasis | 40/1034 | 268/18723 | 9.33e-09 | 8.66e-07 | 40 |
| GO:006024921 | Stomach | CSG | anatomical structure homeostasis | 44/1034 | 314/18723 | 1.22e-08 | 1.06e-06 | 44 |
| GO:00075862 | Stomach | CSG | digestion | 25/1034 | 137/18723 | 1.15e-07 | 8.25e-06 | 25 |
| GO:003027721 | Stomach | CSG | maintenance of gastrointestinal epithelium | 8/1034 | 22/18723 | 1.34e-05 | 4.42e-04 | 8 |
| GO:002260021 | Stomach | CSG | digestive system process | 18/1034 | 104/18723 | 1.44e-05 | 4.63e-04 | 18 |
| GO:00106692 | Stomach | CSG | epithelial structure maintenance | 9/1034 | 30/18723 | 2.30e-05 | 6.73e-04 | 9 |
| GO:000189431 | Stomach | CAG | tissue homeostasis | 25/552 | 268/18723 | 4.14e-07 | 3.13e-05 | 25 |
| GO:00075863 | Stomach | CAG | digestion | 17/552 | 137/18723 | 6.00e-07 | 4.32e-05 | 17 |
| Page: 1 2 3 |
| Pathway ID | Tissue | Disease Stage | Description | Gene Ratio | Bg Ratio | pvalue | p.adjust | qvalue | Count |
| Page: 1 |
Top |
Cell-cell communication analysis |
| Identification of potential cell-cell interactions between two cell types and their ligand-receptor pairs for different disease states |
| Ligand | Receptor | LRpair | Pathway | Tissue | Disease Stage |
| Page: 1 |
Top |
Single-cell gene regulatory network inference analysis |
| Find out the significant the regulons (TFs) and the target genes of each regulon across cell types for different disease states |
| TF | Cell Type | Tissue | Disease Stage | Target Gene | RSS | Regulon Activity |
| ∗The dot plots of a searched regulon are shown for all cell subpopulations in each disease state of each tissue based on the regulon specific score inferred using pySCENIC and by calculating the average expression. |
| Page: 1 |
Top |
Somatic mutation of malignant transformation related genes |
| Annotation of somatic variants for genes involved in malignant transformation |
| Hugo Symbol | Variant Class | Variant Classification | dbSNP RS | HGVSc | HGVSp | HGVSp Short | SWISSPROT | BIOTYPE | SIFT | PolyPhen | Tumor Sample Barcode | Tissue | Histology | Sex | Age | Stage | Therapy Types | Drugs | Outcome |
| TFF2 | insertion | Frame_Shift_Ins | novel | c.313_314insGCGAAATATTTCATGTTCAGGATTTTCCG | p.Lys105SerfsTer81 | p.K105Sfs*81 | Q03403 | protein_coding | TCGA-AN-A03X-01 | Breast | breast invasive carcinoma | Female | >=65 | I/II | Unknown | Unknown | SD | ||
| TFF2 | SNV | Missense_Mutation | rs765949011 | c.40N>A | p.Val14Ile | p.V14I | Q03403 | protein_coding | tolerated(0.78) | benign(0) | TCGA-VS-A9UJ-01 | Cervix | cervical & endocervical cancer | Female | <65 | I/II | Unknown | Unknown | PD |
| TFF2 | SNV | Missense_Mutation | rs139956370 | c.62C>T | p.Ala21Val | p.A21V | Q03403 | protein_coding | tolerated(0.6) | benign(0.006) | TCGA-AZ-6601-01 | Colorectum | colon adenocarcinoma | Male | >=65 | I/II | Unknown | Unknown | PD |
| TFF2 | SNV | Missense_Mutation | c.263N>C | p.Arg88Pro | p.R88P | Q03403 | protein_coding | deleterious(0) | probably_damaging(1) | TCGA-CK-4951-01 | Colorectum | colon adenocarcinoma | Female | >=65 | I/II | Unknown | Unknown | PD | |
| TFF2 | SNV | Missense_Mutation | c.127N>A | p.Gly43Ser | p.G43S | Q03403 | protein_coding | deleterious(0) | probably_damaging(0.999) | TCGA-D1-A0ZN-01 | Endometrium | uterine corpus endometrioid carcinoma | Female | <65 | I/II | Unknown | Unknown | PD | |
| TFF2 | SNV | Missense_Mutation | c.298N>A | p.Glu100Lys | p.E100K | Q03403 | protein_coding | tolerated(0.14) | benign(0.422) | TCGA-44-7670-01 | Lung | lung adenocarcinoma | Female | <65 | I/II | Chemotherapy | docetaxel | SD | |
| TFF2 | SNV | Missense_Mutation | c.320G>T | p.Cys107Phe | p.C107F | Q03403 | protein_coding | deleterious(0) | probably_damaging(0.999) | TCGA-78-7220-01 | Lung | lung adenocarcinoma | Female | <65 | III/IV | Unknown | Unknown | PD | |
| TFF2 | SNV | Missense_Mutation | novel | c.22N>A | p.Leu8Ile | p.L8I | Q03403 | protein_coding | tolerated(0.13) | benign(0.14) | TCGA-86-6851-01 | Lung | lung adenocarcinoma | Female | >=65 | I/II | Unknown | Unknown | SD |
| TFF2 | SNV | Missense_Mutation | c.8G>T | p.Arg3Leu | p.R3L | Q03403 | protein_coding | tolerated(0.68) | benign(0) | TCGA-L9-A7SV-01 | Lung | lung adenocarcinoma | Male | >=65 | I/II | Chemotherapy | cisplatin | CR | |
| TFF2 | SNV | Missense_Mutation | novel | c.125G>A | p.Cys42Tyr | p.C42Y | Q03403 | protein_coding | deleterious(0) | probably_damaging(0.998) | TCGA-37-A5EL-01 | Lung | lung squamous cell carcinoma | Male | <65 | I/II | Chemotherapy | temodal | PD |
| Page: 1 2 |
Top |
Related drugs of malignant transformation related genes |
| Identification of chemicals and drugs interact with genes involved in malignant transfromation |
| (DGIdb 4.0) |
| Entrez ID | Symbol | Category | Interaction Types | Drug Claim Name | Drug Name | PMIDs |
| 7032 | TFF2 | DRUGGABLE GENOME | HORMONES | 16359755 | ||
| 7032 | TFF2 | DRUGGABLE GENOME | VT-111a | 21683260 | ||
| 7032 | TFF2 | DRUGGABLE GENOME | Nafamostat | NAFAMOSTAT | ||
| 7032 | TFF2 | DRUGGABLE GENOME | Sivelestat sodium hydrate | |||
| 7032 | TFF2 | DRUGGABLE GENOME | Aprotinin | APROTININ | ||
| 7032 | TFF2 | DRUGGABLE GENOME | Camostat | CAMOSTAT | ||
| 7032 | TFF2 | DRUGGABLE GENOME | Gabexate | GABEXATE | ||
| 7032 | TFF2 | DRUGGABLE GENOME | VT-111 |
| Page: 1 |

Copyright 2023-Present -The University of Texas Health Science Center at Houston |