
|
|||||
|
 | |
| |
| |
| |
| |
| |
|
Gene: TFF1 |
Gene summary for TFF1 |
| Gene information | Species | Human | Gene symbol | TFF1 | Gene ID | 7031 |
| Gene name | trefoil factor 1 | |
| Gene Alias | BCEI | |
| Cytomap | 21q22.3 | |
| Gene Type | protein-coding | GO ID | GO:0001894 | UniProtAcc | P04155 |
Top |
Malignant transformation analysis |
| Identification of the aberrant gene expression in precancerous and cancerous lesions by comparing the gene expression of stem-like cells in diseased tissues with normal stem cells |
| Entrez ID | Symbol | Replicates | Species | Organ | Tissue | Adj P-value | Log2FC | Malignancy |
| 7031 | TFF1 | GSM4909281 | Human | Breast | IDC | 1.72e-05 | -2.67e-01 | 0.21 |
| 7031 | TFF1 | GSM4909282 | Human | Breast | IDC | 7.79e-05 | -2.67e-01 | -0.0288 |
| 7031 | TFF1 | GSM4909285 | Human | Breast | IDC | 6.02e-05 | -2.63e-01 | 0.21 |
| 7031 | TFF1 | GSM4909286 | Human | Breast | IDC | 1.72e-05 | -2.67e-01 | 0.1081 |
| 7031 | TFF1 | GSM4909287 | Human | Breast | IDC | 2.79e-04 | -2.41e-01 | 0.2057 |
| 7031 | TFF1 | GSM4909295 | Human | Breast | IDC | 3.03e-02 | -2.67e-01 | 0.0898 |
| 7031 | TFF1 | GSM4909302 | Human | Breast | IDC | 1.04e-02 | -2.46e-01 | 0.1545 |
| 7031 | TFF1 | GSM4909303 | Human | Breast | IDC | 1.92e-05 | 7.67e-01 | 0.0438 |
| 7031 | TFF1 | GSM4909304 | Human | Breast | IDC | 8.38e-14 | 5.29e-01 | 0.1636 |
| 7031 | TFF1 | GSM4909307 | Human | Breast | IDC | 2.99e-14 | 6.03e-01 | 0.1569 |
| 7031 | TFF1 | GSM4909308 | Human | Breast | IDC | 3.75e-100 | 1.64e+00 | 0.158 |
| 7031 | TFF1 | GSM4909311 | Human | Breast | IDC | 1.47e-03 | 2.41e-01 | 0.1534 |
| 7031 | TFF1 | GSM4909312 | Human | Breast | IDC | 1.71e-16 | 7.50e-01 | 0.1552 |
| 7031 | TFF1 | GSM4909313 | Human | Breast | IDC | 7.86e-31 | 1.17e+00 | 0.0391 |
| 7031 | TFF1 | GSM4909317 | Human | Breast | IDC | 6.17e-36 | 1.13e+00 | 0.1355 |
| 7031 | TFF1 | GSM4909318 | Human | Breast | IDC | 3.23e-25 | 1.55e+00 | 0.2031 |
| 7031 | TFF1 | ctrl6 | Human | Breast | Precancer | 1.25e-08 | 7.77e-01 | -0.0061 |
| 7031 | TFF1 | brca10 | Human | Breast | Precancer | 1.08e-24 | 9.67e-01 | -0.0029 |
| 7031 | TFF1 | M1 | Human | Breast | IDC | 2.85e-06 | 4.54e-01 | 0.1577 |
| 7031 | TFF1 | NCCBC11 | Human | Breast | DCIS | 9.21e-57 | 1.99e+00 | 0.1232 |
| Page: 1 2 3 4 5 |
| Tissue | Expression Dynamics | Abbreviation |
| Breast | 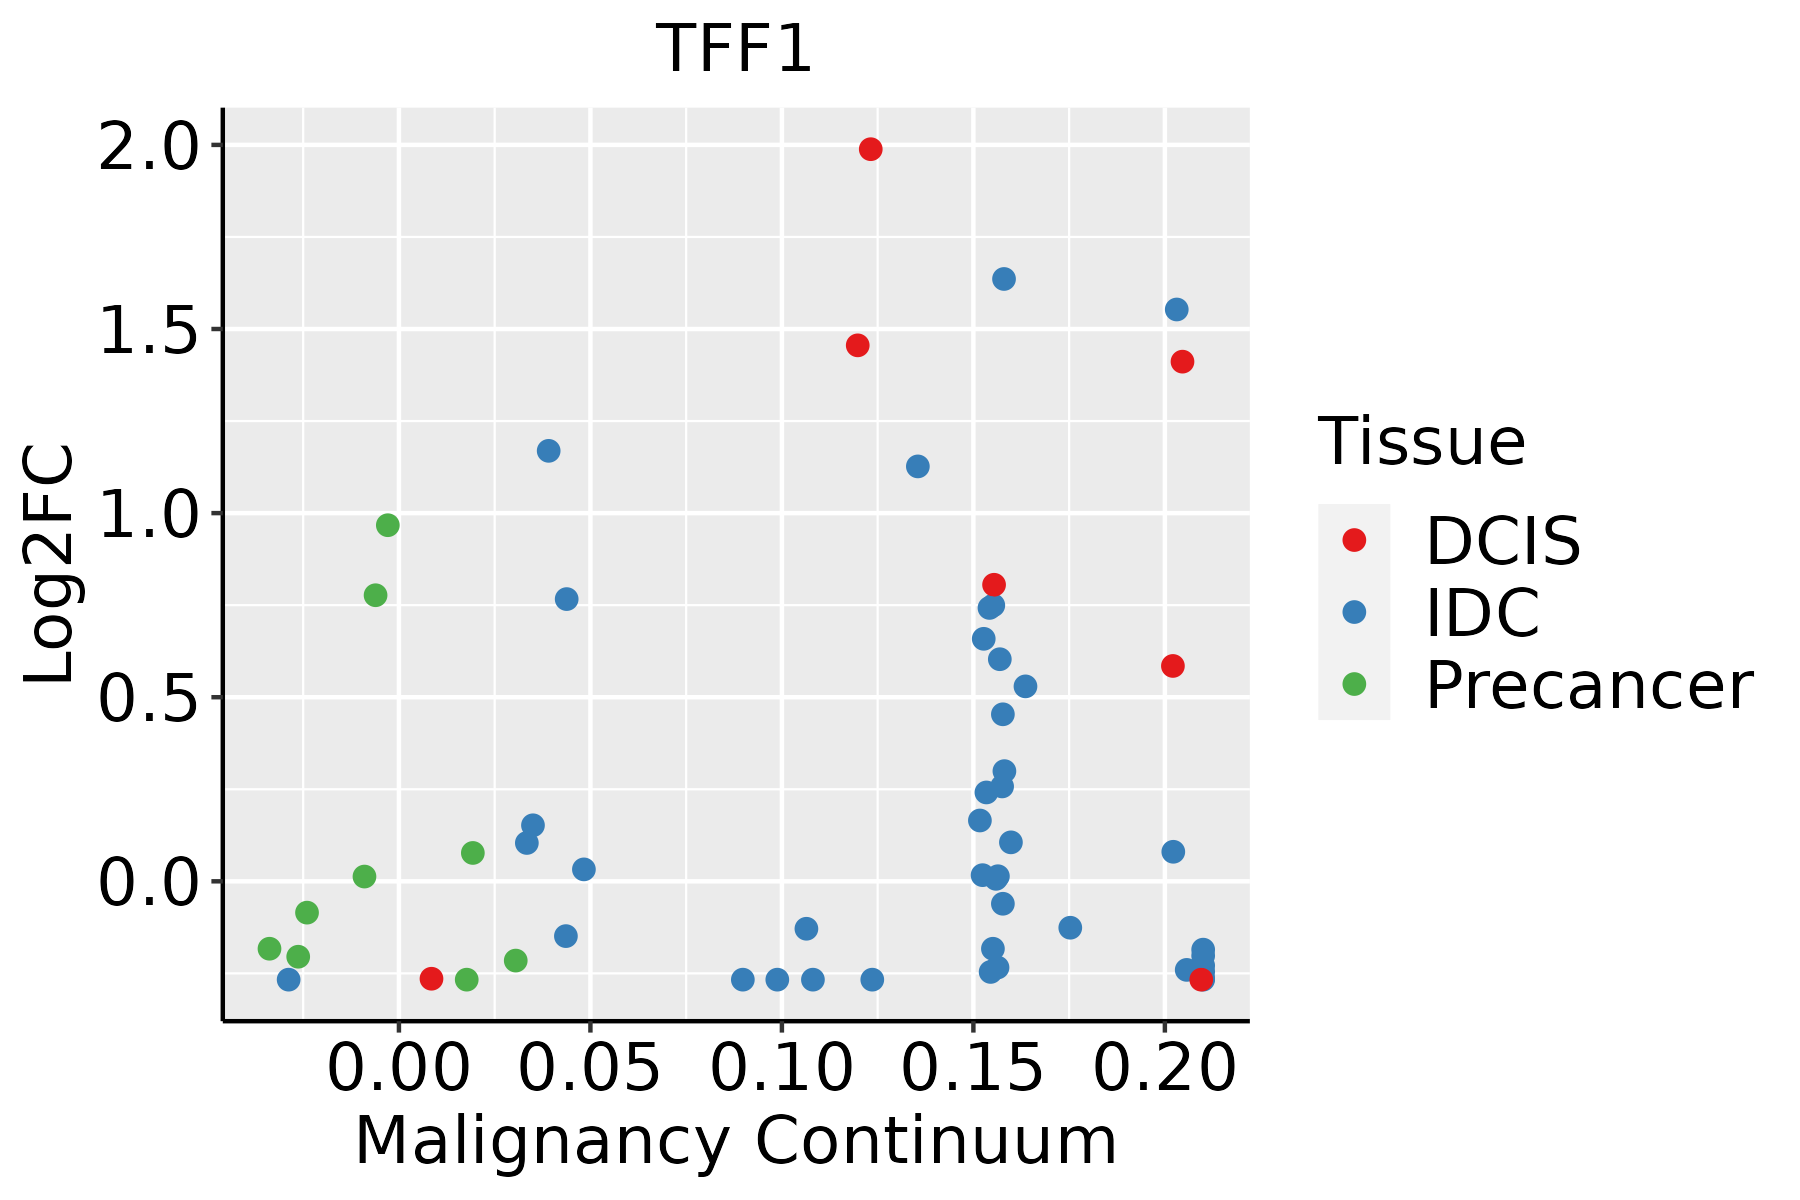 | IDC: Invasive ductal carcinoma |
| DCIS: Ductal carcinoma in situ | ||
| Precancer(BRCA1-mut): Precancerous lesion from BRCA1 mutation carriers | ||
| Colorectum (GSE201348) |  | FAP: Familial adenomatous polyposis |
| CRC: Colorectal cancer | ||
| Colorectum (HTA11) |  | AD: Adenomas |
| SER: Sessile serrated lesions | ||
| MSI-H: Microsatellite-high colorectal cancer | ||
| MSS: Microsatellite stable colorectal cancer | ||
| GC |  | CAG: Chronic atrophic gastritis |
| CAG with IM: Chronic atrophic gastritis with intestinal metaplasia | ||
| CSG: Chronic superficial gastritis | ||
| GC: Gastric cancer | ||
| SIM: Severe intestinal metaplasia | ||
| WIM: Wild intestinal metaplasia | ||
| Liver | 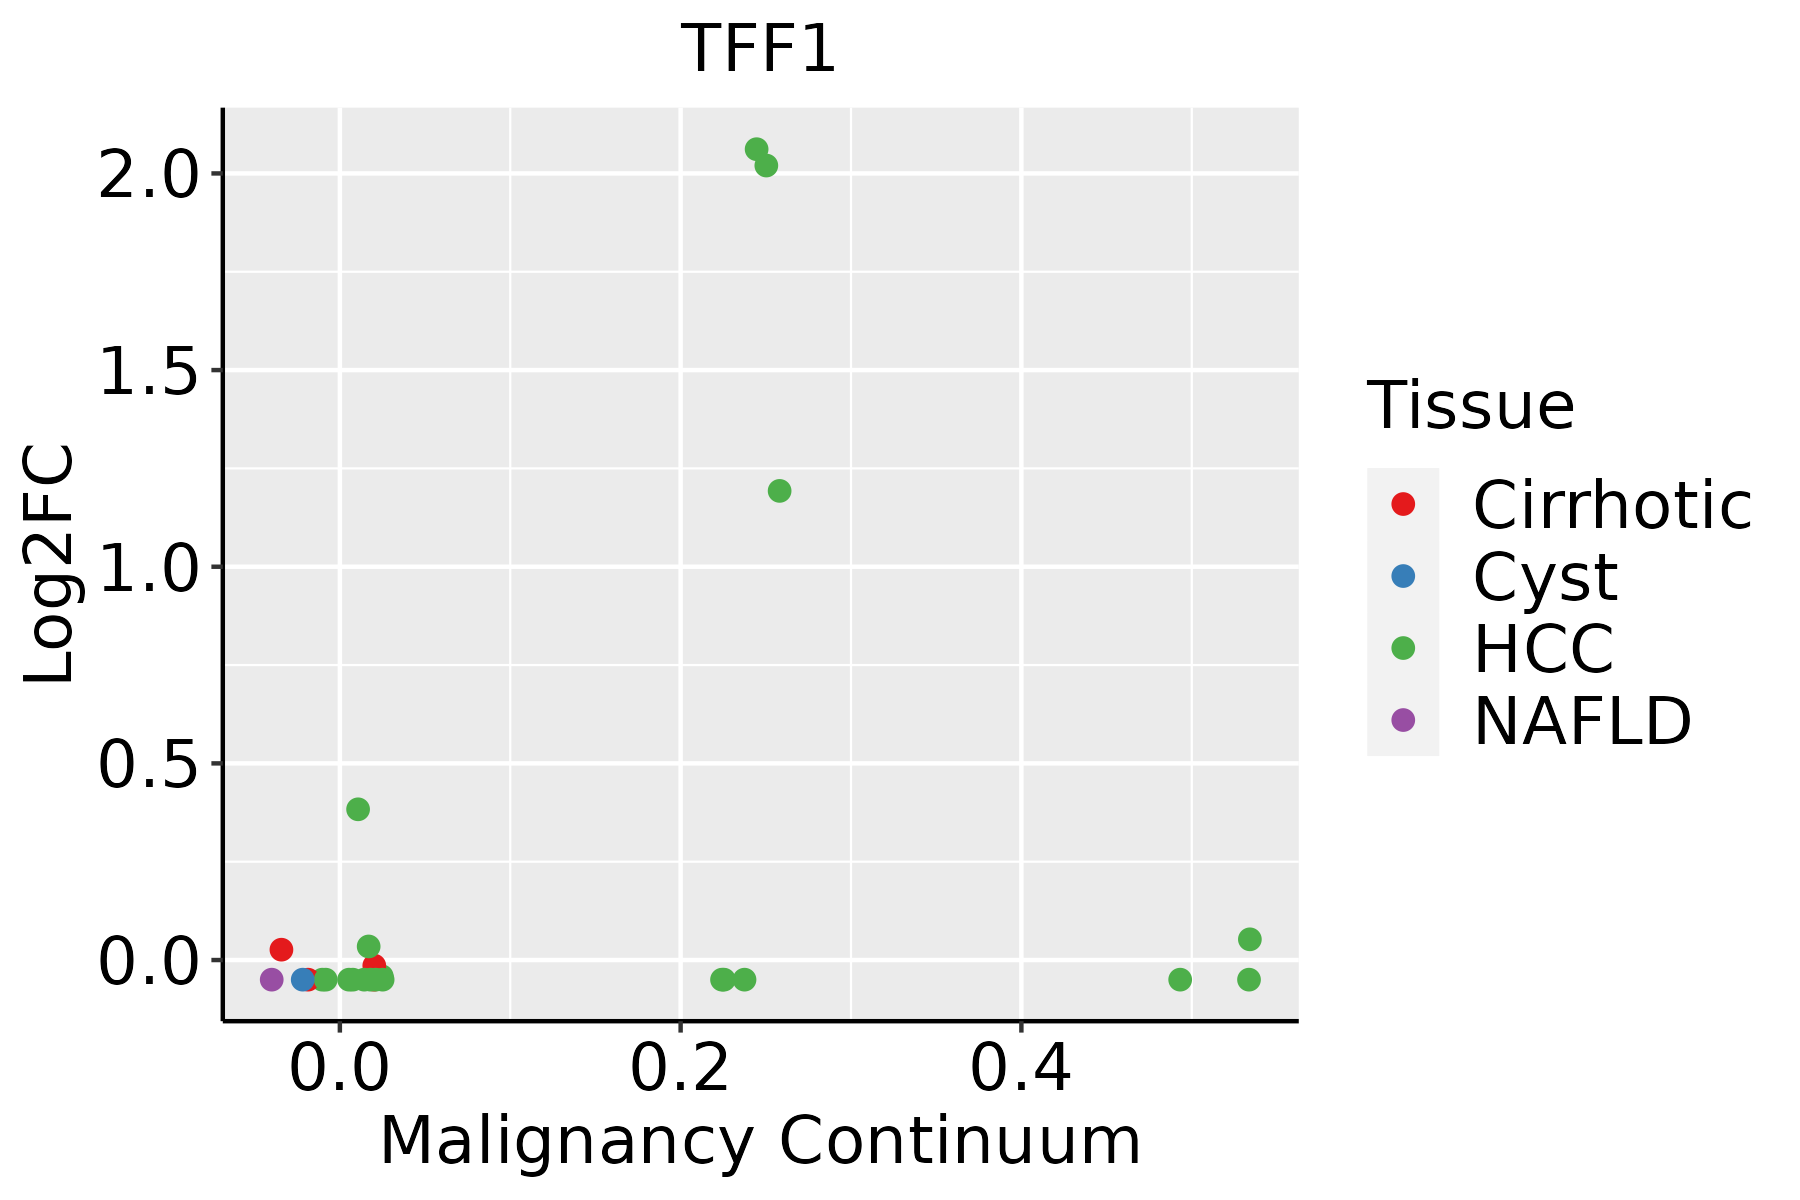 | HCC: Hepatocellular carcinoma |
| NAFLD: Non-alcoholic fatty liver disease | ||
| Prostate | 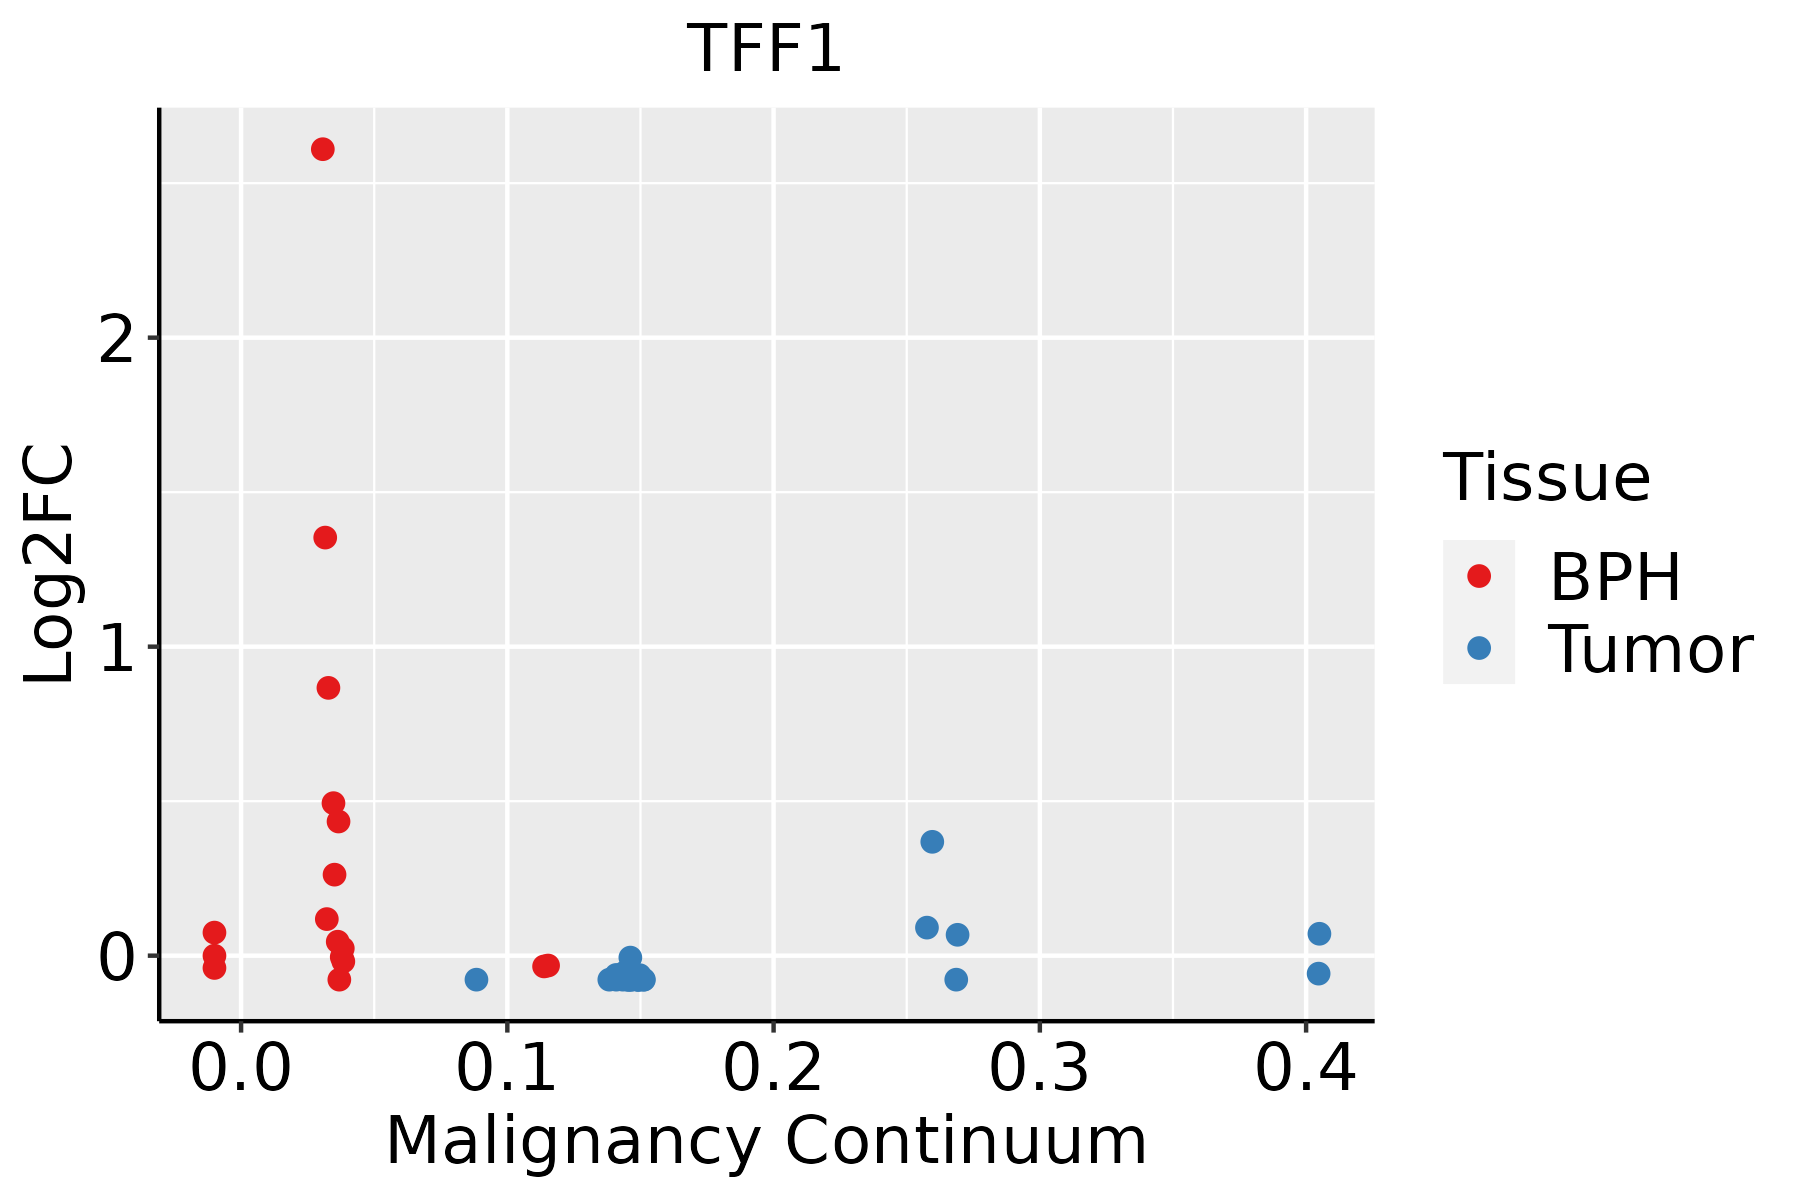 | BPH: Benign Prostatic Hyperplasia |
| ∗log2FC in expression of this searched gene in stem-like cells from each diseased tissue sample relative to stem-like cells in normal samples in each tissue plotted against the malignancy continuum. Samples are colored based on if they are from different disease stage. |
Top |
Malignant transformation related pathway analysis |
| Find out the enriched GO biological processes and KEGG pathways involved in transition from healthy to precancer to cancer |
| Tissue | Disease Stage | Enriched GO biological Processes |
| Colorectum | AD |  |
| Colorectum | SER |  |
| Colorectum | MSS |  |
| Colorectum | MSI-H |  |
| Colorectum | FAP |  |
| ∗Top 15 enriched GO BP terms are showed in the bar plot of each disease state in each tissue. Each row represents a significant GO biological process which is colored according to the -log10(p.adjust). |
| Page: 1 2 3 4 5 6 7 8 9 |
| GO ID | Tissue | Disease Stage | Description | Gene Ratio | Bg Ratio | pvalue | p.adjust | Count |
| GO:00100389 | Breast | Precancer | response to metal ion | 47/1080 | 373/18723 | 3.88e-07 | 1.79e-05 | 47 |
| GO:00018948 | Breast | Precancer | tissue homeostasis | 27/1080 | 268/18723 | 3.49e-03 | 2.90e-02 | 27 |
| GO:001003814 | Breast | IDC | response to metal ion | 65/1434 | 373/18723 | 2.95e-10 | 3.42e-08 | 65 |
| GO:00434348 | Breast | IDC | response to peptide hormone | 54/1434 | 414/18723 | 8.25e-05 | 1.61e-03 | 54 |
| GO:0010039 | Breast | IDC | response to iron ion | 8/1434 | 32/18723 | 2.32e-03 | 2.10e-02 | 8 |
| GO:000189413 | Breast | IDC | tissue homeostasis | 34/1434 | 268/18723 | 2.54e-03 | 2.28e-02 | 34 |
| GO:001003824 | Breast | DCIS | response to metal ion | 65/1390 | 373/18723 | 8.03e-11 | 9.88e-09 | 65 |
| GO:004343414 | Breast | DCIS | response to peptide hormone | 52/1390 | 414/18723 | 1.33e-04 | 2.28e-03 | 52 |
| GO:00100391 | Breast | DCIS | response to iron ion | 8/1390 | 32/18723 | 1.90e-03 | 1.81e-02 | 8 |
| GO:000189423 | Breast | DCIS | tissue homeostasis | 33/1390 | 268/18723 | 2.88e-03 | 2.48e-02 | 33 |
| GO:0043434 | Colorectum | AD | response to peptide hormone | 126/3918 | 414/18723 | 2.70e-06 | 7.86e-05 | 126 |
| GO:0060249 | Colorectum | AD | anatomical structure homeostasis | 94/3918 | 314/18723 | 9.37e-05 | 1.42e-03 | 94 |
| GO:0001894 | Colorectum | AD | tissue homeostasis | 81/3918 | 268/18723 | 1.96e-04 | 2.62e-03 | 81 |
| GO:0010038 | Colorectum | AD | response to metal ion | 106/3918 | 373/18723 | 3.22e-04 | 3.83e-03 | 106 |
| GO:0030277 | Colorectum | AD | maintenance of gastrointestinal epithelium | 10/3918 | 22/18723 | 8.52e-03 | 4.97e-02 | 10 |
| GO:00018941 | Colorectum | SER | tissue homeostasis | 66/2897 | 268/18723 | 5.87e-05 | 1.37e-03 | 66 |
| GO:00434341 | Colorectum | SER | response to peptide hormone | 93/2897 | 414/18723 | 9.61e-05 | 2.04e-03 | 93 |
| GO:00602491 | Colorectum | SER | anatomical structure homeostasis | 74/2897 | 314/18723 | 1.01e-04 | 2.13e-03 | 74 |
| GO:00100381 | Colorectum | SER | response to metal ion | 84/2897 | 373/18723 | 1.87e-04 | 3.44e-03 | 84 |
| GO:0022600 | Colorectum | SER | digestive system process | 29/2897 | 104/18723 | 8.57e-04 | 1.05e-02 | 29 |
| Page: 1 2 3 4 5 |
| Pathway ID | Tissue | Disease Stage | Description | Gene Ratio | Bg Ratio | pvalue | p.adjust | qvalue | Count |
| hsa0491518 | Breast | Precancer | Estrogen signaling pathway | 28/684 | 138/8465 | 4.10e-06 | 5.39e-05 | 4.13e-05 | 28 |
| hsa0491519 | Breast | Precancer | Estrogen signaling pathway | 28/684 | 138/8465 | 4.10e-06 | 5.39e-05 | 4.13e-05 | 28 |
| hsa0491523 | Breast | IDC | Estrogen signaling pathway | 35/867 | 138/8465 | 2.55e-07 | 5.18e-06 | 3.88e-06 | 35 |
| hsa0491533 | Breast | IDC | Estrogen signaling pathway | 35/867 | 138/8465 | 2.55e-07 | 5.18e-06 | 3.88e-06 | 35 |
| hsa0491542 | Breast | DCIS | Estrogen signaling pathway | 35/846 | 138/8465 | 1.40e-07 | 2.51e-06 | 1.85e-06 | 35 |
| hsa0491552 | Breast | DCIS | Estrogen signaling pathway | 35/846 | 138/8465 | 1.40e-07 | 2.51e-06 | 1.85e-06 | 35 |
| hsa04915 | Colorectum | SER | Estrogen signaling pathway | 38/1580 | 138/8465 | 6.51e-03 | 3.68e-02 | 2.67e-02 | 38 |
| hsa049151 | Colorectum | SER | Estrogen signaling pathway | 38/1580 | 138/8465 | 6.51e-03 | 3.68e-02 | 2.67e-02 | 38 |
| hsa049152 | Colorectum | MSS | Estrogen signaling pathway | 48/1875 | 138/8465 | 4.23e-04 | 3.08e-03 | 1.89e-03 | 48 |
| hsa049153 | Colorectum | MSS | Estrogen signaling pathway | 48/1875 | 138/8465 | 4.23e-04 | 3.08e-03 | 1.89e-03 | 48 |
| hsa0491527 | Prostate | BPH | Estrogen signaling pathway | 48/1718 | 138/8465 | 4.60e-05 | 3.16e-04 | 1.96e-04 | 48 |
| hsa04915112 | Prostate | BPH | Estrogen signaling pathway | 48/1718 | 138/8465 | 4.60e-05 | 3.16e-04 | 1.96e-04 | 48 |
| hsa0491528 | Prostate | Tumor | Estrogen signaling pathway | 48/1791 | 138/8465 | 1.36e-04 | 8.33e-04 | 5.17e-04 | 48 |
| hsa0491536 | Prostate | Tumor | Estrogen signaling pathway | 48/1791 | 138/8465 | 1.36e-04 | 8.33e-04 | 5.17e-04 | 48 |
| hsa0491512 | Stomach | GC | Estrogen signaling pathway | 23/708 | 138/8465 | 1.02e-03 | 7.44e-03 | 5.23e-03 | 23 |
| hsa0491513 | Stomach | GC | Estrogen signaling pathway | 23/708 | 138/8465 | 1.02e-03 | 7.44e-03 | 5.23e-03 | 23 |
| hsa049156 | Stomach | CAG | Estrogen signaling pathway | 16/368 | 138/8465 | 3.07e-04 | 3.31e-03 | 2.65e-03 | 16 |
| hsa049157 | Stomach | CAG | Estrogen signaling pathway | 16/368 | 138/8465 | 3.07e-04 | 3.31e-03 | 2.65e-03 | 16 |
| Page: 1 |
Top |
Cell-cell communication analysis |
| Identification of potential cell-cell interactions between two cell types and their ligand-receptor pairs for different disease states |
| Ligand | Receptor | LRpair | Pathway | Tissue | Disease Stage |
| Page: 1 |
Top |
Single-cell gene regulatory network inference analysis |
| Find out the significant the regulons (TFs) and the target genes of each regulon across cell types for different disease states |
| TF | Cell Type | Tissue | Disease Stage | Target Gene | RSS | Regulon Activity |
| ∗The dot plots of a searched regulon are shown for all cell subpopulations in each disease state of each tissue based on the regulon specific score inferred using pySCENIC and by calculating the average expression. |
| Page: 1 |
Top |
Somatic mutation of malignant transformation related genes |
| Annotation of somatic variants for genes involved in malignant transformation |
| Hugo Symbol | Variant Class | Variant Classification | dbSNP RS | HGVSc | HGVSp | HGVSp Short | SWISSPROT | BIOTYPE | SIFT | PolyPhen | Tumor Sample Barcode | Tissue | Histology | Sex | Age | Stage | Therapy Types | Drugs | Outcome |
| TFF1 | SNV | Missense_Mutation | novel | c.104N>T | p.Pro35Leu | p.P35L | P04155 | protein_coding | deleterious(0.03) | probably_damaging(0.948) | TCGA-2W-A8YY-01 | Cervix | cervical & endocervical cancer | Female | <65 | I/II | Chemotherapy | cisplatin | CR |
| TFF1 | SNV | Missense_Mutation | c.117N>C | p.Gln39His | p.Q39H | P04155 | protein_coding | tolerated(0.12) | benign(0.382) | TCGA-ZJ-AAXT-01 | Cervix | cervical & endocervical cancer | Female | <65 | III/IV | Unknown | Unknown | SD | |
| TFF1 | SNV | Missense_Mutation | rs779422658 | c.223N>A | p.Asp75Asn | p.D75N | P04155 | protein_coding | tolerated(0.54) | benign(0.003) | TCGA-CA-6717-01 | Colorectum | colon adenocarcinoma | Male | <65 | I/II | Chemotherapy | oxaliplatin | CR |
| TFF1 | SNV | Missense_Mutation | rs765263040 | c.187N>T | p.Arg63Cys | p.R63C | P04155 | protein_coding | tolerated(0.05) | possibly_damaging(0.761) | TCGA-A5-A0G2-01 | Endometrium | uterine corpus endometrioid carcinoma | Female | <65 | III/IV | Unknown | Unknown | SD |
| TFF1 | SNV | Missense_Mutation | novel | c.83N>T | p.Thr28Ile | p.T28I | P04155 | protein_coding | tolerated(0.1) | benign(0.039) | TCGA-AX-A06F-01 | Endometrium | uterine corpus endometrioid carcinoma | Female | <65 | III/IV | Chemotherapy | carboplatin | SD |
| TFF1 | SNV | Missense_Mutation | novel | c.196C>A | p.Pro66Thr | p.P66T | P04155 | protein_coding | deleterious(0) | probably_damaging(1) | TCGA-DF-A2KU-01 | Endometrium | uterine corpus endometrioid carcinoma | Female | Unknown | I/II | Unknown | Unknown | SD |
| TFF1 | SNV | Missense_Mutation | novel | c.128T>G | p.Phe43Cys | p.F43C | P04155 | protein_coding | deleterious(0.02) | possibly_damaging(0.819) | TCGA-E6-A1LX-01 | Endometrium | uterine corpus endometrioid carcinoma | Female | <65 | I/II | Unknown | Unknown | SD |
| TFF1 | insertion | Frame_Shift_Ins | rs766192241 | c.106dupC | p.Arg36ProfsTer2 | p.R36Pfs*2 | P04155 | protein_coding | TCGA-91-6847-01 | Lung | lung adenocarcinoma | Female | <65 | I/II | Unknown | Unknown | PD | ||
| TFF1 | deletion | Frame_Shift_Del | novel | c.27delN | p.Cys10AlafsTer86 | p.C10Afs*86 | P04155 | protein_coding | TCGA-CD-A4MG-01 | Stomach | stomach adenocarcinoma | Male | >=65 | I/II | Unknown | Unknown | PD |
| Page: 1 |
Top |
Related drugs of malignant transformation related genes |
| Identification of chemicals and drugs interact with genes involved in malignant transfromation |
| (DGIdb 4.0) |
| Entrez ID | Symbol | Category | Interaction Types | Drug Claim Name | Drug Name | PMIDs |
| 7031 | TFF1 | GROWTH FACTOR, DRUGGABLE GENOME | AG-013 |
| Page: 1 |

Copyright 2023-Present -The University of Texas Health Science Center at Houston |