
|
|||||
|
 | |
| |
| |
| |
| |
| |
|
Gene: TFE3 |
Gene summary for TFE3 |
| Gene information | Species | Human | Gene symbol | TFE3 | Gene ID | 7030 |
| Gene name | transcription factor binding to IGHM enhancer 3 | |
| Gene Alias | RCCP2 | |
| Cytomap | Xp11.23 | |
| Gene Type | protein-coding | GO ID | GO:0001659 | UniProtAcc | B4DIA5 |
Top |
Malignant transformation analysis |
| Identification of the aberrant gene expression in precancerous and cancerous lesions by comparing the gene expression of stem-like cells in diseased tissues with normal stem cells |
| Entrez ID | Symbol | Replicates | Species | Organ | Tissue | Adj P-value | Log2FC | Malignancy |
| 7030 | TFE3 | LZE2T | Human | Esophagus | ESCC | 2.83e-02 | 3.45e-01 | 0.082 |
| 7030 | TFE3 | LZE4T | Human | Esophagus | ESCC | 1.32e-08 | 3.86e-01 | 0.0811 |
| 7030 | TFE3 | LZE7T | Human | Esophagus | ESCC | 1.97e-04 | 2.14e-01 | 0.0667 |
| 7030 | TFE3 | LZE8T | Human | Esophagus | ESCC | 4.09e-06 | 1.65e-01 | 0.067 |
| 7030 | TFE3 | LZE24T | Human | Esophagus | ESCC | 6.39e-08 | 1.90e-01 | 0.0596 |
| 7030 | TFE3 | P1T-E | Human | Esophagus | ESCC | 3.22e-08 | 2.94e-01 | 0.0875 |
| 7030 | TFE3 | P2T-E | Human | Esophagus | ESCC | 4.74e-28 | 4.92e-01 | 0.1177 |
| 7030 | TFE3 | P4T-E | Human | Esophagus | ESCC | 3.66e-09 | 2.37e-01 | 0.1323 |
| 7030 | TFE3 | P5T-E | Human | Esophagus | ESCC | 1.35e-09 | 6.39e-02 | 0.1327 |
| 7030 | TFE3 | P8T-E | Human | Esophagus | ESCC | 9.51e-21 | 3.13e-01 | 0.0889 |
| 7030 | TFE3 | P9T-E | Human | Esophagus | ESCC | 1.56e-10 | 2.00e-01 | 0.1131 |
| 7030 | TFE3 | P10T-E | Human | Esophagus | ESCC | 1.40e-26 | 2.52e-01 | 0.116 |
| 7030 | TFE3 | P11T-E | Human | Esophagus | ESCC | 4.24e-08 | 3.70e-01 | 0.1426 |
| 7030 | TFE3 | P12T-E | Human | Esophagus | ESCC | 8.74e-21 | 2.11e-01 | 0.1122 |
| 7030 | TFE3 | P15T-E | Human | Esophagus | ESCC | 3.24e-12 | 3.65e-01 | 0.1149 |
| 7030 | TFE3 | P16T-E | Human | Esophagus | ESCC | 4.86e-13 | 2.23e-01 | 0.1153 |
| 7030 | TFE3 | P19T-E | Human | Esophagus | ESCC | 2.35e-04 | 3.70e-01 | 0.1662 |
| 7030 | TFE3 | P20T-E | Human | Esophagus | ESCC | 2.32e-18 | 4.07e-01 | 0.1124 |
| 7030 | TFE3 | P21T-E | Human | Esophagus | ESCC | 3.82e-16 | 1.63e-01 | 0.1617 |
| 7030 | TFE3 | P22T-E | Human | Esophagus | ESCC | 2.69e-39 | 6.95e-01 | 0.1236 |
| Page: 1 2 3 4 5 |
| Tissue | Expression Dynamics | Abbreviation |
| Esophagus | 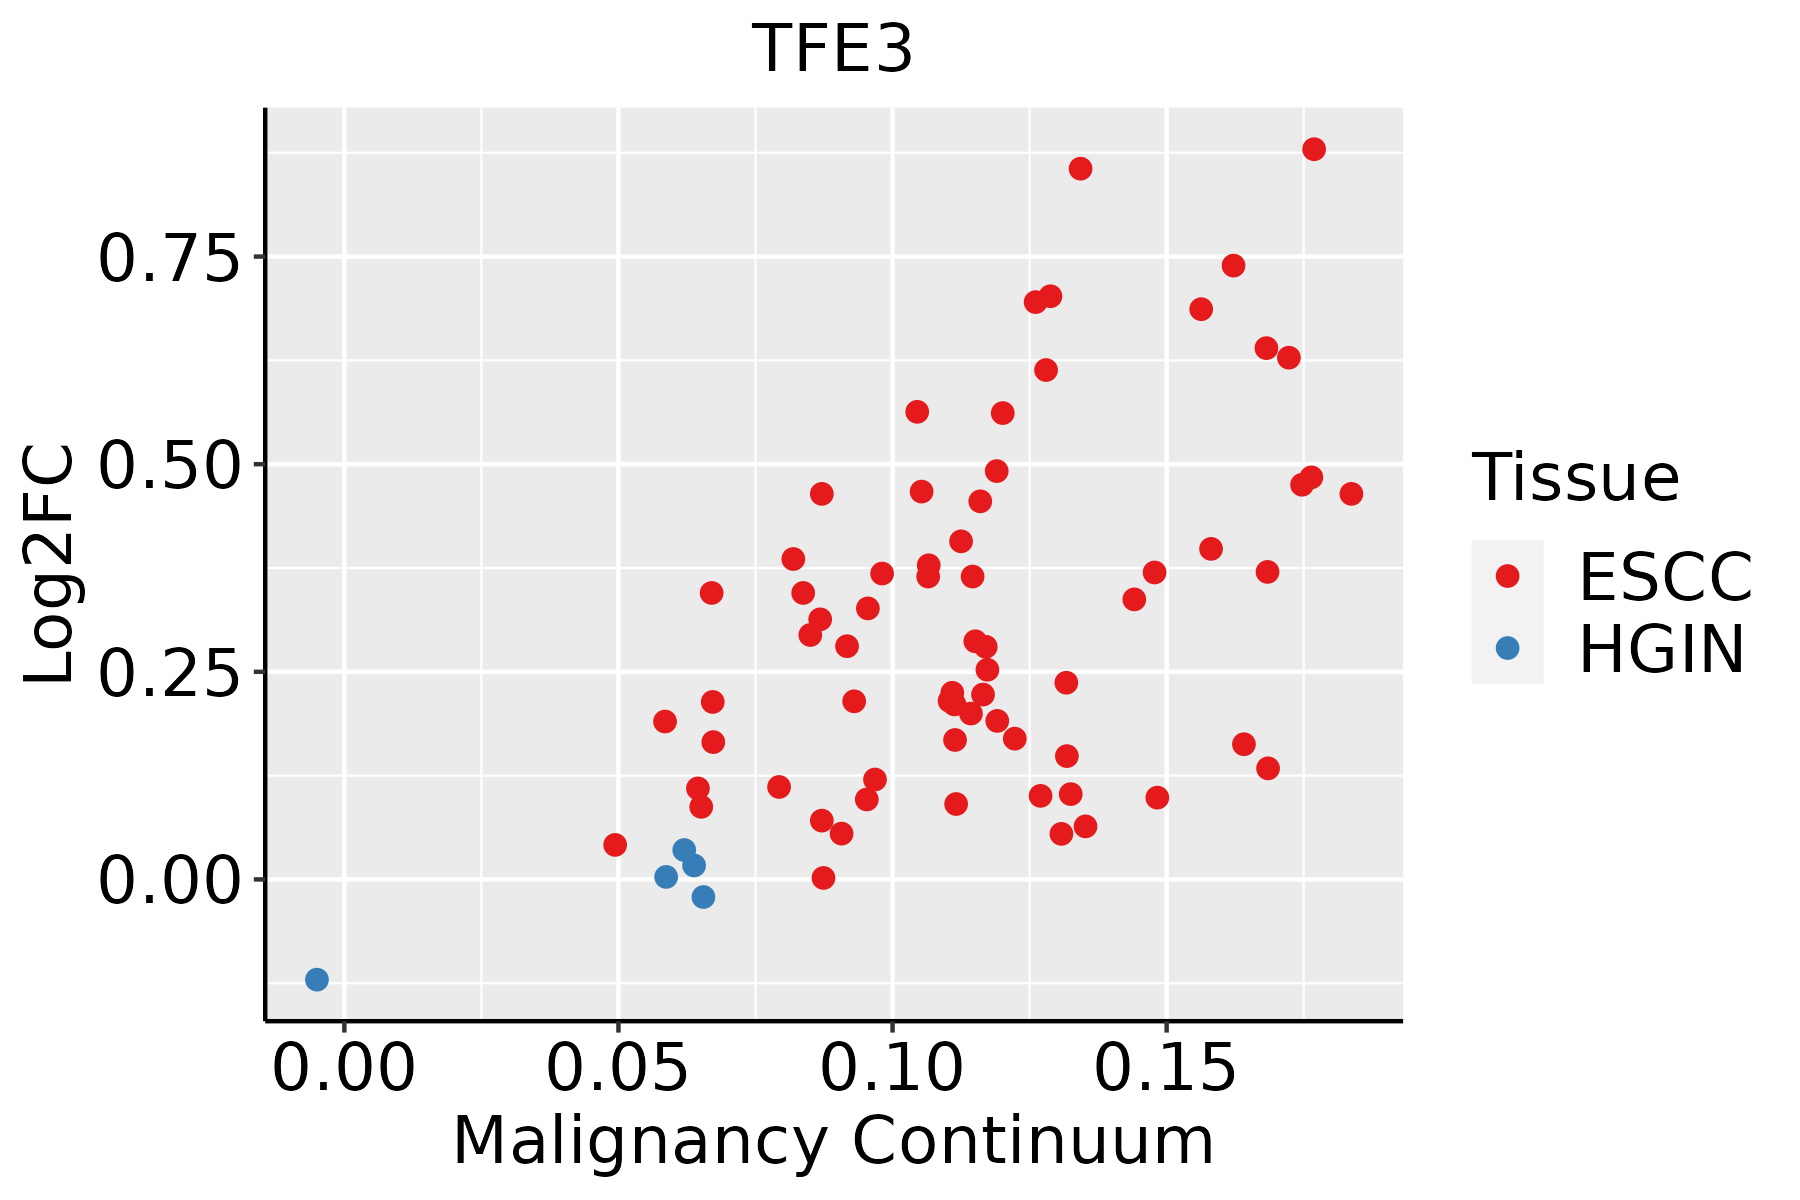 | ESCC: Esophageal squamous cell carcinoma |
| HGIN: High-grade intraepithelial neoplasias | ||
| LGIN: Low-grade intraepithelial neoplasias | ||
| Liver |  | HCC: Hepatocellular carcinoma |
| NAFLD: Non-alcoholic fatty liver disease | ||
| Oral Cavity | 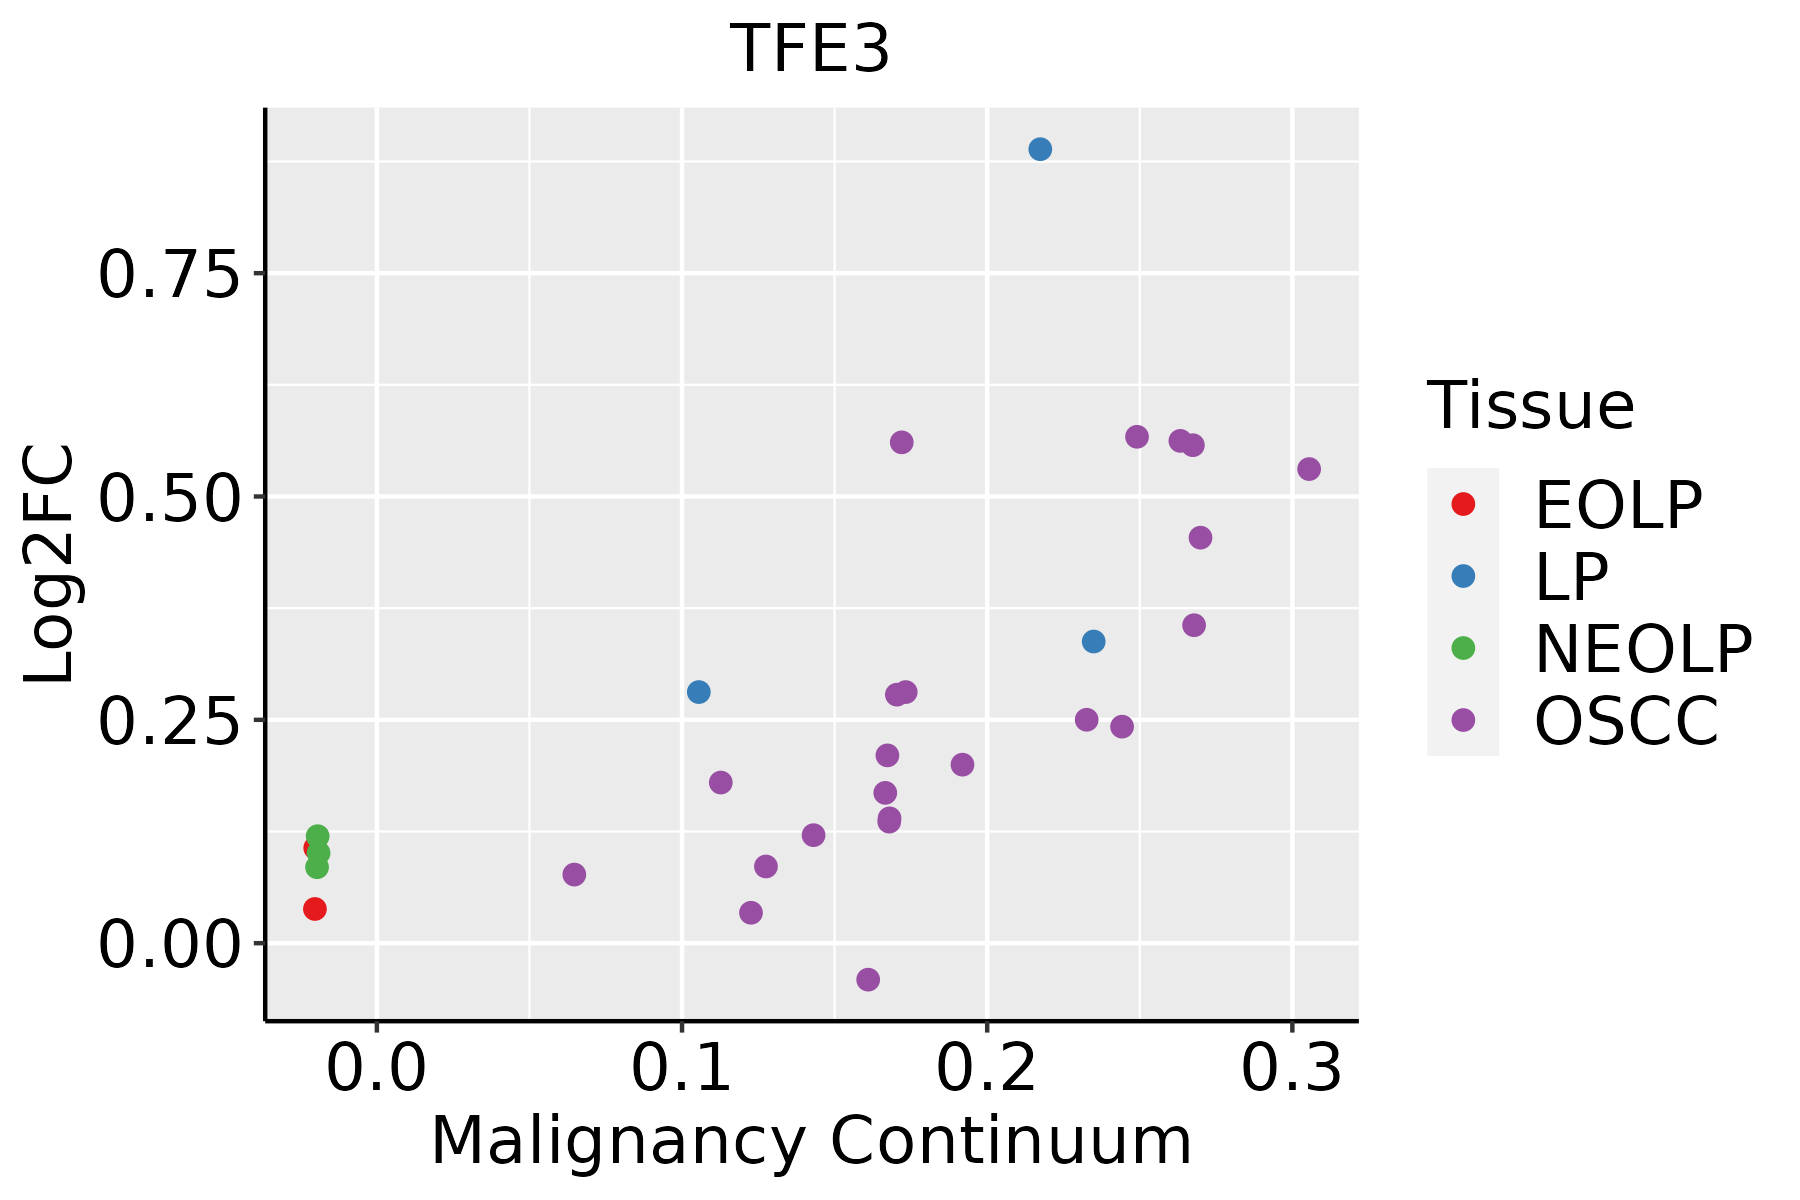 | EOLP: Erosive Oral lichen planus |
| LP: leukoplakia | ||
| NEOLP: Non-erosive oral lichen planus | ||
| OSCC: Oral squamous cell carcinoma |
| ∗log2FC in expression of this searched gene in stem-like cells from each diseased tissue sample relative to stem-like cells in normal samples in each tissue plotted against the malignancy continuum. Samples are colored based on if they are from different disease stage. |
Top |
Malignant transformation related pathway analysis |
| Find out the enriched GO biological processes and KEGG pathways involved in transition from healthy to precancer to cancer |
| Tissue | Disease Stage | Enriched GO biological Processes |
| Colorectum | AD |  |
| Colorectum | SER |  |
| Colorectum | MSS |  |
| Colorectum | MSI-H |  |
| Colorectum | FAP |  |
| ∗Top 15 enriched GO BP terms are showed in the bar plot of each disease state in each tissue. Each row represents a significant GO biological process which is colored according to the -log10(p.adjust). |
| Page: 1 2 3 4 5 6 7 8 9 |
| GO ID | Tissue | Disease Stage | Description | Gene Ratio | Bg Ratio | pvalue | p.adjust | Count |
| GO:0030099111 | Esophagus | ESCC | myeloid cell differentiation | 232/8552 | 381/18723 | 1.22e-09 | 2.90e-08 | 232 |
| GO:004578527 | Esophagus | ESCC | positive regulation of cell adhesion | 255/8552 | 437/18723 | 5.07e-08 | 9.11e-07 | 255 |
| GO:000257317 | Esophagus | ESCC | myeloid leukocyte differentiation | 128/8552 | 208/18723 | 2.75e-06 | 3.15e-05 | 128 |
| GO:00454449 | Esophagus | ESCC | fat cell differentiation | 135/8552 | 229/18723 | 3.38e-05 | 2.78e-04 | 135 |
| GO:00456007 | Esophagus | ESCC | positive regulation of fat cell differentiation | 46/8552 | 66/18723 | 6.72e-05 | 5.11e-04 | 46 |
| GO:1903706110 | Esophagus | ESCC | regulation of hemopoiesis | 201/8552 | 367/18723 | 2.60e-04 | 1.58e-03 | 201 |
| GO:0045637111 | Esophagus | ESCC | regulation of myeloid cell differentiation | 118/8552 | 210/18723 | 1.35e-03 | 6.43e-03 | 118 |
| GO:190210510 | Esophagus | ESCC | regulation of leukocyte differentiation | 152/8552 | 279/18723 | 1.82e-03 | 8.35e-03 | 152 |
| GO:00455984 | Esophagus | ESCC | regulation of fat cell differentiation | 79/8552 | 139/18723 | 5.23e-03 | 1.97e-02 | 79 |
| GO:000276115 | Esophagus | ESCC | regulation of myeloid leukocyte differentiation | 69/8552 | 120/18723 | 6.00e-03 | 2.21e-02 | 69 |
| GO:01061066 | Esophagus | ESCC | cold-induced thermogenesis | 80/8552 | 144/18723 | 1.07e-02 | 3.65e-02 | 80 |
| GO:01201616 | Esophagus | ESCC | regulation of cold-induced thermogenesis | 80/8552 | 144/18723 | 1.07e-02 | 3.65e-02 | 80 |
| GO:00303165 | Esophagus | ESCC | osteoclast differentiation | 54/8552 | 94/18723 | 1.43e-02 | 4.65e-02 | 54 |
| GO:003009922 | Liver | HCC | myeloid cell differentiation | 200/7958 | 381/18723 | 4.64e-05 | 4.49e-04 | 200 |
| GO:00454441 | Liver | HCC | fat cell differentiation | 120/7958 | 229/18723 | 1.52e-03 | 8.05e-03 | 120 |
| GO:004578512 | Liver | HCC | positive regulation of cell adhesion | 215/7958 | 437/18723 | 2.53e-03 | 1.22e-02 | 215 |
| GO:010610611 | Liver | HCC | cold-induced thermogenesis | 76/7958 | 144/18723 | 8.07e-03 | 3.18e-02 | 76 |
| GO:012016111 | Liver | HCC | regulation of cold-induced thermogenesis | 76/7958 | 144/18723 | 8.07e-03 | 3.18e-02 | 76 |
| GO:199084511 | Liver | HCC | adaptive thermogenesis | 81/7958 | 157/18723 | 1.32e-02 | 4.72e-02 | 81 |
| GO:003009920 | Oral cavity | OSCC | myeloid cell differentiation | 213/7305 | 381/18723 | 1.24e-11 | 4.42e-10 | 213 |
| Page: 1 2 3 |
| Pathway ID | Tissue | Disease Stage | Description | Gene Ratio | Bg Ratio | pvalue | p.adjust | qvalue | Count |
| hsa04137210 | Esophagus | ESCC | Mitophagy - animal | 54/4205 | 72/8465 | 9.33e-06 | 4.96e-05 | 2.54e-05 | 54 |
| hsa0521118 | Esophagus | ESCC | Renal cell carcinoma | 51/4205 | 69/8465 | 3.29e-05 | 1.53e-04 | 7.83e-05 | 51 |
| hsa052028 | Esophagus | ESCC | Transcriptional misregulation in cancer | 116/4205 | 193/8465 | 2.08e-03 | 5.95e-03 | 3.05e-03 | 116 |
| hsa0413738 | Esophagus | ESCC | Mitophagy - animal | 54/4205 | 72/8465 | 9.33e-06 | 4.96e-05 | 2.54e-05 | 54 |
| hsa0521119 | Esophagus | ESCC | Renal cell carcinoma | 51/4205 | 69/8465 | 3.29e-05 | 1.53e-04 | 7.83e-05 | 51 |
| hsa0520213 | Esophagus | ESCC | Transcriptional misregulation in cancer | 116/4205 | 193/8465 | 2.08e-03 | 5.95e-03 | 3.05e-03 | 116 |
| hsa0413741 | Liver | HCC | Mitophagy - animal | 53/4020 | 72/8465 | 5.49e-06 | 4.59e-05 | 2.56e-05 | 53 |
| hsa0521121 | Liver | HCC | Renal cell carcinoma | 51/4020 | 69/8465 | 6.76e-06 | 5.53e-05 | 3.07e-05 | 51 |
| hsa0413751 | Liver | HCC | Mitophagy - animal | 53/4020 | 72/8465 | 5.49e-06 | 4.59e-05 | 2.56e-05 | 53 |
| hsa0521131 | Liver | HCC | Renal cell carcinoma | 51/4020 | 69/8465 | 6.76e-06 | 5.53e-05 | 3.07e-05 | 51 |
| hsa0413728 | Oral cavity | OSCC | Mitophagy - animal | 58/3704 | 72/8465 | 1.48e-10 | 2.07e-09 | 1.05e-09 | 58 |
| hsa0521116 | Oral cavity | OSCC | Renal cell carcinoma | 51/3704 | 69/8465 | 3.30e-07 | 2.05e-06 | 1.04e-06 | 51 |
| hsa04137112 | Oral cavity | OSCC | Mitophagy - animal | 58/3704 | 72/8465 | 1.48e-10 | 2.07e-09 | 1.05e-09 | 58 |
| hsa0521117 | Oral cavity | OSCC | Renal cell carcinoma | 51/3704 | 69/8465 | 3.30e-07 | 2.05e-06 | 1.04e-06 | 51 |
| hsa0413729 | Oral cavity | LP | Mitophagy - animal | 38/2418 | 72/8465 | 1.24e-05 | 8.63e-05 | 5.57e-05 | 38 |
| hsa0521125 | Oral cavity | LP | Renal cell carcinoma | 30/2418 | 69/8465 | 5.60e-03 | 2.25e-02 | 1.45e-02 | 30 |
| hsa0413737 | Oral cavity | LP | Mitophagy - animal | 38/2418 | 72/8465 | 1.24e-05 | 8.63e-05 | 5.57e-05 | 38 |
| hsa0521135 | Oral cavity | LP | Renal cell carcinoma | 30/2418 | 69/8465 | 5.60e-03 | 2.25e-02 | 1.45e-02 | 30 |
| hsa0413762 | Oral cavity | NEOLP | Mitophagy - animal | 26/1112 | 72/8465 | 5.95e-07 | 7.88e-06 | 4.95e-06 | 26 |
| hsa0521161 | Oral cavity | NEOLP | Renal cell carcinoma | 21/1112 | 69/8465 | 1.32e-04 | 9.32e-04 | 5.86e-04 | 21 |
| Page: 1 2 |
Top |
Cell-cell communication analysis |
| Identification of potential cell-cell interactions between two cell types and their ligand-receptor pairs for different disease states |
| Ligand | Receptor | LRpair | Pathway | Tissue | Disease Stage |
| Page: 1 |
Top |
Single-cell gene regulatory network inference analysis |
| Find out the significant the regulons (TFs) and the target genes of each regulon across cell types for different disease states |
| TF | Cell Type | Tissue | Disease Stage | Target Gene | RSS | Regulon Activity |
| TFE3 | NEUT | Cervix | Healthy | PHLDB1,SAA2,AL445524.1, etc. | 4.75e-01 |  |
| TFE3 | INMON | Cervix | HSIL_HPV | PHLDB1,SAA2,AL445524.1, etc. | 2.31e-01 |  |
| TFE3 | M2MAC | Stomach | ADJ | CXCL1,ATRX,MRPS22, etc. | 9.53e-02 |  |
| TFE3 | M2MAC | Stomach | CAG | CXCL1,ATRX,MRPS22, etc. | 7.70e-02 |  |
| TFE3 | M2MAC | Stomach | CSG | CXCL1,ATRX,MRPS22, etc. | 7.32e-02 |  |
| TFE3 | M2MAC | Stomach | GC | CXCL1,ATRX,MRPS22, etc. | 2.02e-01 |  |
| TFE3 | M2MAC | Stomach | SIM | CXCL1,ATRX,MRPS22, etc. | 2.61e-01 |  |
| TFE3 | M2MAC | Stomach | WIM | CXCL1,ATRX,MRPS22, etc. | 2.39e-01 |  |
| ∗The dot plots of a searched regulon are shown for all cell subpopulations in each disease state of each tissue based on the regulon specific score inferred using pySCENIC and by calculating the average expression. |
| Page: 1 |
Top |
Somatic mutation of malignant transformation related genes |
| Annotation of somatic variants for genes involved in malignant transformation |
| Hugo Symbol | Variant Class | Variant Classification | dbSNP RS | HGVSc | HGVSp | HGVSp Short | SWISSPROT | BIOTYPE | SIFT | PolyPhen | Tumor Sample Barcode | Tissue | Histology | Sex | Age | Stage | Therapy Types | Drugs | Outcome |
| TFE3 | SNV | Missense_Mutation | c.1067N>A | p.Arg356His | p.R356H | P19532 | protein_coding | deleterious(0) | benign(0.039) | TCGA-A2-A0T1-01 | Breast | breast invasive carcinoma | Female | <65 | III/IV | Targeted Molecular therapy | herceptin | SD | |
| TFE3 | SNV | Missense_Mutation | c.613A>G | p.Thr205Ala | p.T205A | P19532 | protein_coding | deleterious(0.05) | benign(0.097) | TCGA-AO-A128-01 | Breast | breast invasive carcinoma | Female | <65 | I/II | Chemotherapy | doxorubicin | SD | |
| TFE3 | SNV | Missense_Mutation | c.1523N>T | p.Asp508Val | p.D508V | P19532 | protein_coding | deleterious(0.04) | possibly_damaging(0.679) | TCGA-AR-A1AR-01 | Breast | breast invasive carcinoma | Female | <65 | III/IV | Unspecific | Docetaxel | PD | |
| TFE3 | SNV | Missense_Mutation | novel | c.1249N>C | p.Glu417Gln | p.E417Q | P19532 | protein_coding | deleterious(0) | benign(0.438) | TCGA-C8-A8HP-01 | Breast | breast invasive carcinoma | Female | <65 | III/IV | Chemotherapy | 5-fluorouracil | CR |
| TFE3 | SNV | Missense_Mutation | c.1234N>T | p.Arg412Trp | p.R412W | P19532 | protein_coding | deleterious(0) | possibly_damaging(0.828) | TCGA-E2-A576-01 | Breast | breast invasive carcinoma | Female | >=65 | I/II | Chemotherapy | taxotere | SD | |
| TFE3 | SNV | Missense_Mutation | novel | c.1145N>A | p.Arg382His | p.R382H | P19532 | protein_coding | deleterious(0) | benign(0.071) | TCGA-2W-A8YY-01 | Cervix | cervical & endocervical cancer | Female | <65 | I/II | Chemotherapy | cisplatin | CR |
| TFE3 | SNV | Missense_Mutation | rs199894897 | c.853N>A | p.Gly285Arg | p.G285R | P19532 | protein_coding | tolerated(0.19) | possibly_damaging(0.461) | TCGA-2W-A8YY-01 | Cervix | cervical & endocervical cancer | Female | <65 | I/II | Chemotherapy | cisplatin | CR |
| TFE3 | SNV | Missense_Mutation | novel | c.865N>A | p.Gly289Arg | p.G289R | P19532 | protein_coding | deleterious(0.04) | possibly_damaging(0.539) | TCGA-EA-A3HU-01 | Cervix | cervical & endocervical cancer | Female | <65 | I/II | Unknown | Unknown | SD |
| TFE3 | SNV | Missense_Mutation | rs199894897 | c.853N>A | p.Gly285Arg | p.G285R | P19532 | protein_coding | tolerated(0.19) | possibly_damaging(0.461) | TCGA-FU-A57G-01 | Cervix | cervical & endocervical cancer | Female | <65 | I/II | Unknown | Unknown | SD |
| TFE3 | SNV | Missense_Mutation | c.1026N>C | p.Leu342Phe | p.L342F | P19532 | protein_coding | tolerated(0.13) | possibly_damaging(0.477) | TCGA-IR-A3LA-01 | Cervix | cervical & endocervical cancer | Female | <65 | I/II | Chemotherapy | cisplatin | CR |
| Page: 1 2 3 4 5 6 7 |
Top |
Related drugs of malignant transformation related genes |
| Identification of chemicals and drugs interact with genes involved in malignant transfromation |
| (DGIdb 4.0) |
| Entrez ID | Symbol | Category | Interaction Types | Drug Claim Name | Drug Name | PMIDs |
| Page: 1 |

Copyright 2023-Present -The University of Texas Health Science Center at Houston |