
|
|||||
|
 | |
| |
| |
| |
| |
| |
|
Gene: TFDP2 |
Gene summary for TFDP2 |
| Gene information | Species | Human | Gene symbol | TFDP2 | Gene ID | 7029 |
| Gene name | transcription factor Dp-2 | |
| Gene Alias | DP2 | |
| Cytomap | 3q23 | |
| Gene Type | protein-coding | GO ID | GO:0006139 | UniProtAcc | Q14188 |
Top |
Malignant transformation analysis |
| Identification of the aberrant gene expression in precancerous and cancerous lesions by comparing the gene expression of stem-like cells in diseased tissues with normal stem cells |
| Entrez ID | Symbol | Replicates | Species | Organ | Tissue | Adj P-value | Log2FC | Malignancy |
| 7029 | TFDP2 | CA_HPV_1 | Human | Cervix | CC | 4.96e-07 | -1.98e-01 | 0.0264 |
| 7029 | TFDP2 | CCI_1 | Human | Cervix | CC | 3.02e-07 | 8.94e-01 | 0.528 |
| 7029 | TFDP2 | CCI_2 | Human | Cervix | CC | 3.84e-05 | 1.51e+00 | 0.5249 |
| 7029 | TFDP2 | CCI_3 | Human | Cervix | CC | 1.14e-17 | 1.35e+00 | 0.516 |
| 7029 | TFDP2 | HTA11_347_2000001011 | Human | Colorectum | AD | 3.13e-06 | 5.40e-01 | -0.1954 |
| 7029 | TFDP2 | A015-C-203 | Human | Colorectum | FAP | 2.66e-20 | -2.69e-01 | -0.1294 |
| 7029 | TFDP2 | A015-C-204 | Human | Colorectum | FAP | 1.34e-03 | -2.38e-01 | -0.0228 |
| 7029 | TFDP2 | A014-C-040 | Human | Colorectum | FAP | 7.75e-03 | -3.09e-01 | -0.1184 |
| 7029 | TFDP2 | A002-C-201 | Human | Colorectum | FAP | 3.29e-09 | -2.26e-01 | 0.0324 |
| 7029 | TFDP2 | A001-C-119 | Human | Colorectum | FAP | 8.42e-03 | -1.35e-01 | -0.1557 |
| 7029 | TFDP2 | A001-C-108 | Human | Colorectum | FAP | 4.15e-08 | 4.55e-02 | -0.0272 |
| 7029 | TFDP2 | A002-C-205 | Human | Colorectum | FAP | 1.56e-17 | -2.59e-01 | -0.1236 |
| 7029 | TFDP2 | A015-C-006 | Human | Colorectum | FAP | 3.86e-13 | -4.01e-01 | -0.0994 |
| 7029 | TFDP2 | A015-C-106 | Human | Colorectum | FAP | 6.70e-04 | -8.11e-02 | -0.0511 |
| 7029 | TFDP2 | A002-C-114 | Human | Colorectum | FAP | 2.13e-15 | -3.99e-01 | -0.1561 |
| 7029 | TFDP2 | A015-C-104 | Human | Colorectum | FAP | 3.97e-22 | -3.48e-01 | -0.1899 |
| 7029 | TFDP2 | A001-C-014 | Human | Colorectum | FAP | 4.82e-05 | -1.78e-01 | 0.0135 |
| 7029 | TFDP2 | A002-C-016 | Human | Colorectum | FAP | 3.30e-15 | -2.66e-01 | 0.0521 |
| 7029 | TFDP2 | A015-C-002 | Human | Colorectum | FAP | 1.85e-10 | -3.67e-01 | -0.0763 |
| 7029 | TFDP2 | A001-C-203 | Human | Colorectum | FAP | 4.55e-06 | -3.45e-02 | -0.0481 |
| Page: 1 2 3 4 5 6 7 8 9 10 |
| Tissue | Expression Dynamics | Abbreviation |
| Cervix |  | CC: Cervix cancer |
| HSIL_HPV: HPV-infected high-grade squamous intraepithelial lesions | ||
| N_HPV: HPV-infected normal cervix | ||
| Colorectum (GSE201348) | 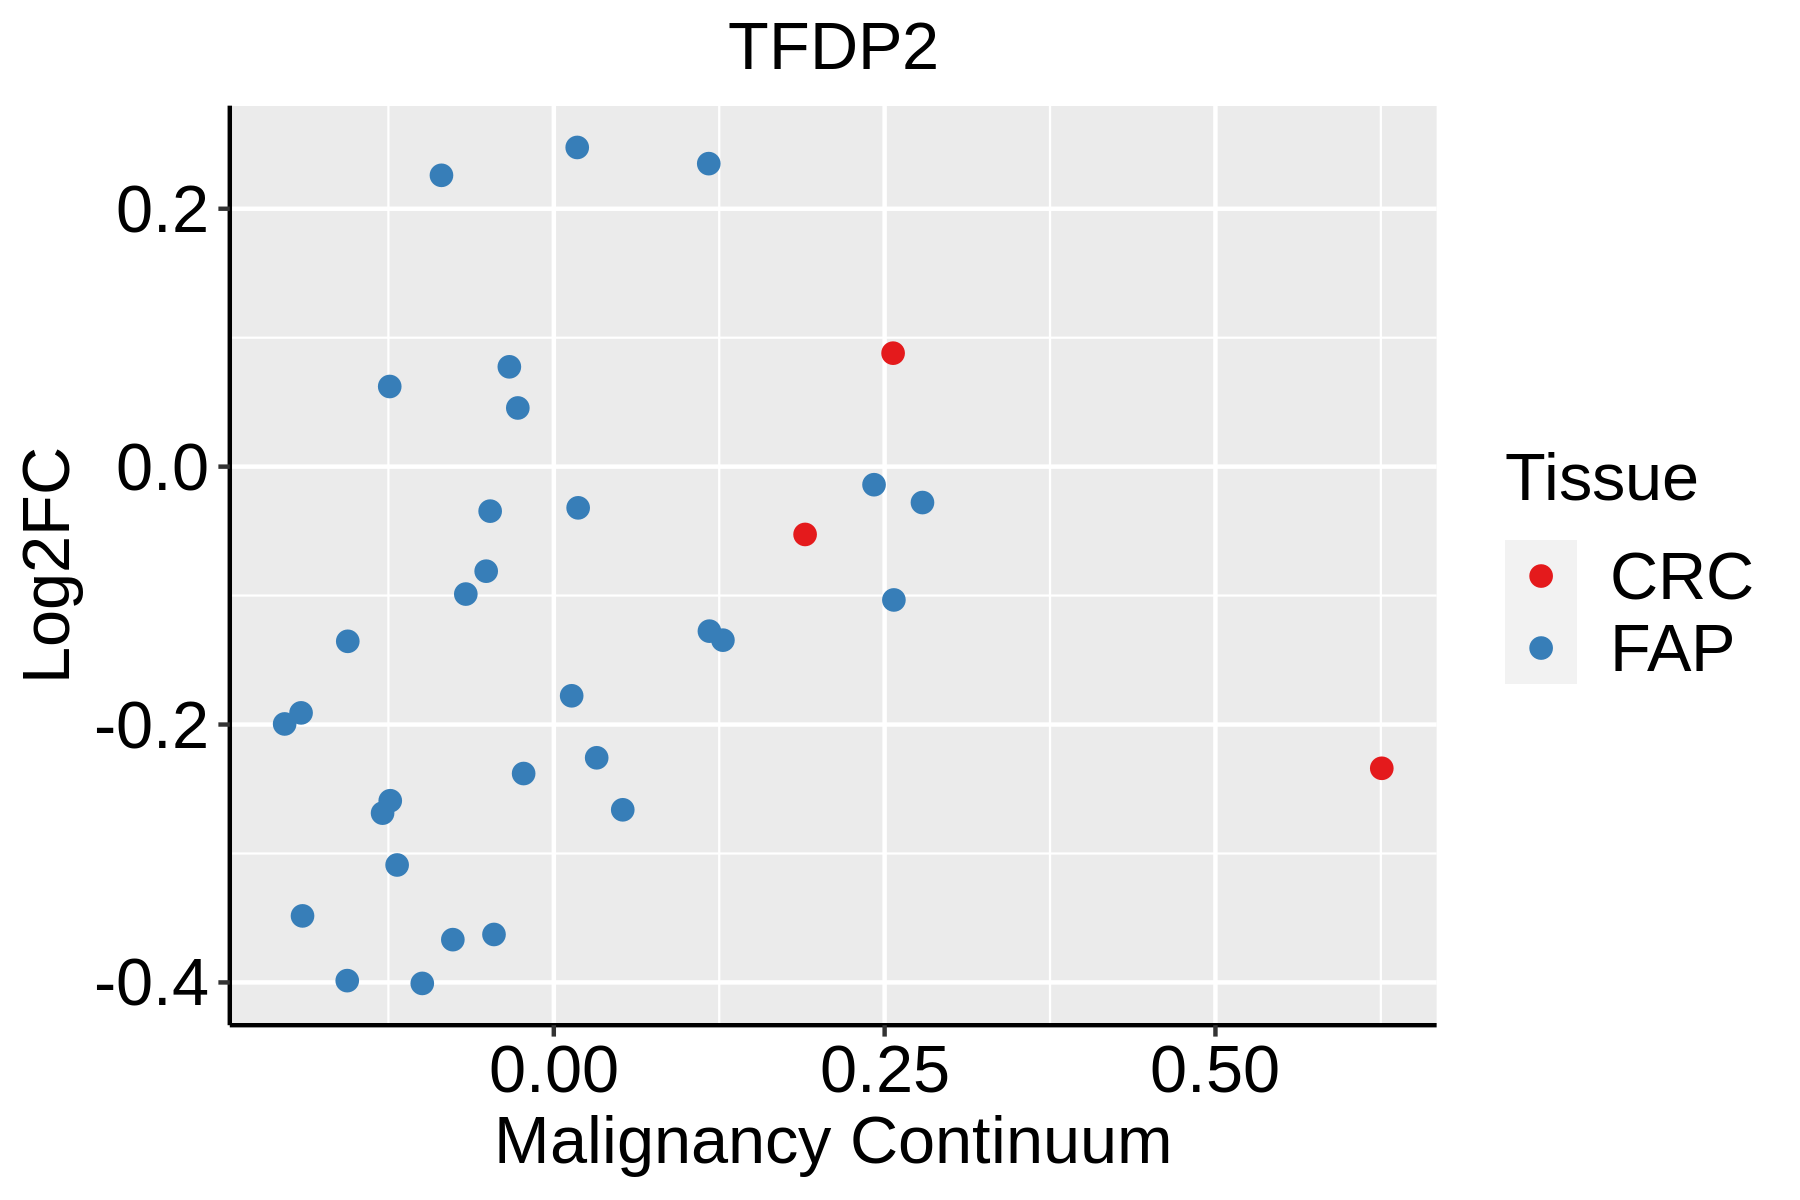 | FAP: Familial adenomatous polyposis |
| CRC: Colorectal cancer | ||
| Colorectum (HTA11) |  | AD: Adenomas |
| SER: Sessile serrated lesions | ||
| MSI-H: Microsatellite-high colorectal cancer | ||
| MSS: Microsatellite stable colorectal cancer | ||
| Esophagus | 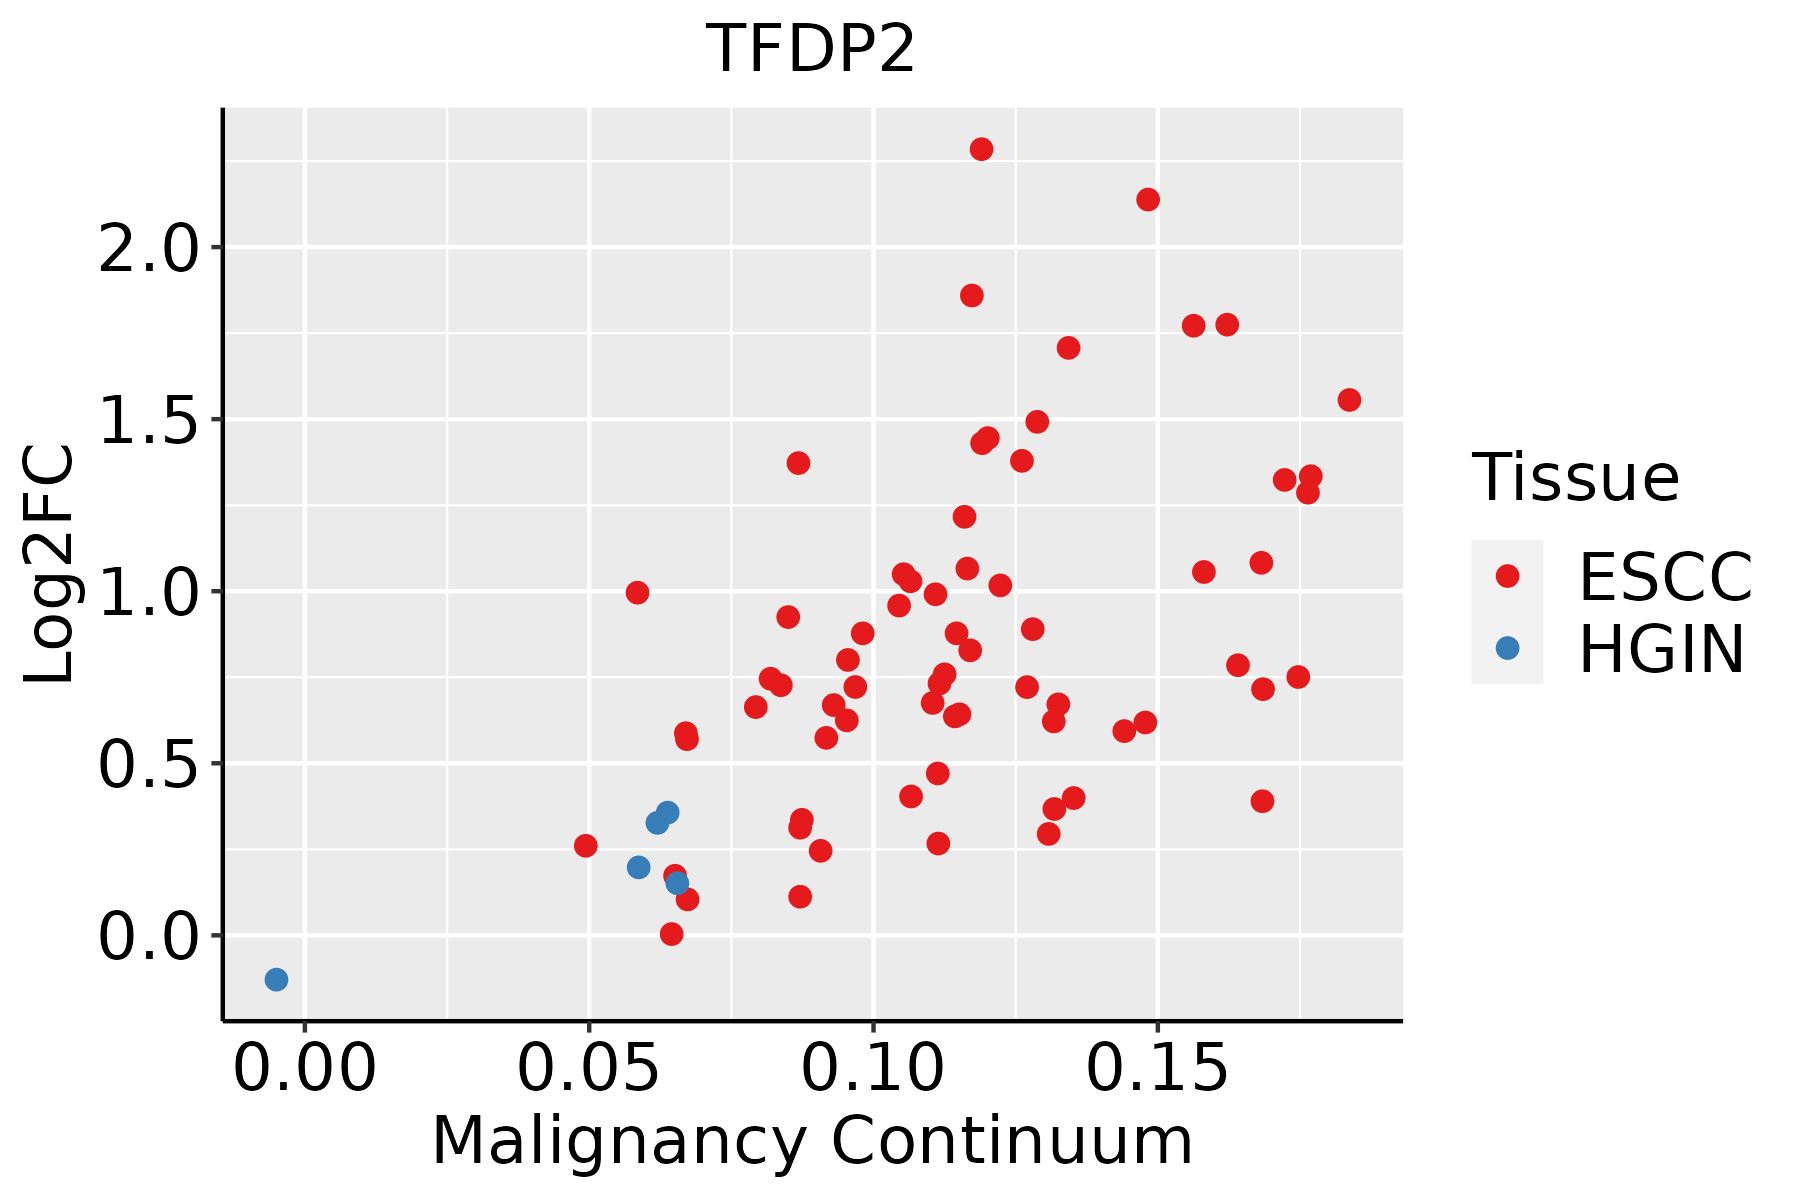 | ESCC: Esophageal squamous cell carcinoma |
| HGIN: High-grade intraepithelial neoplasias | ||
| LGIN: Low-grade intraepithelial neoplasias | ||
| Liver |  | HCC: Hepatocellular carcinoma |
| NAFLD: Non-alcoholic fatty liver disease | ||
| Lung | 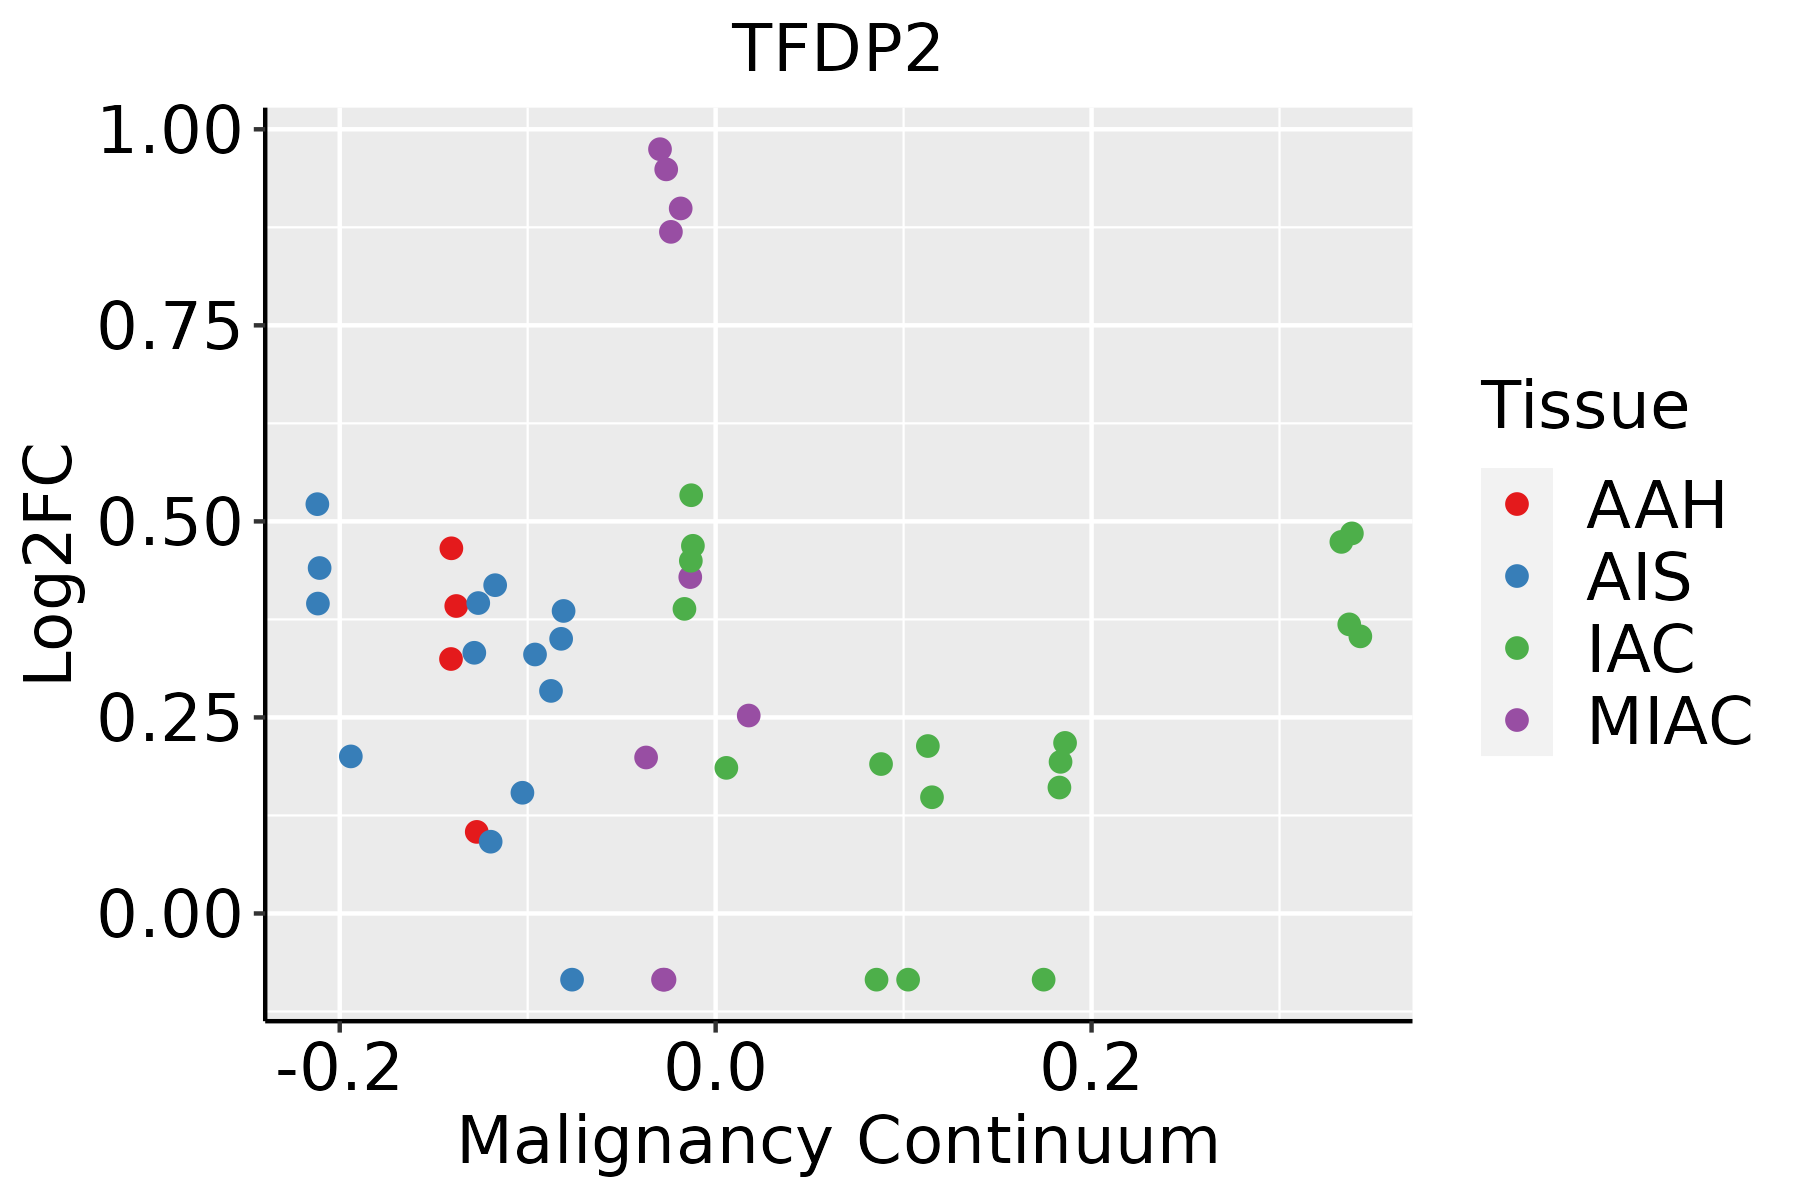 | AAH: Atypical adenomatous hyperplasia |
| AIS: Adenocarcinoma in situ | ||
| IAC: Invasive lung adenocarcinoma | ||
| MIA: Minimally invasive adenocarcinoma | ||
| Oral Cavity |  | EOLP: Erosive Oral lichen planus |
| LP: leukoplakia | ||
| NEOLP: Non-erosive oral lichen planus | ||
| OSCC: Oral squamous cell carcinoma | ||
| Prostate |  | BPH: Benign Prostatic Hyperplasia |
| Skin | 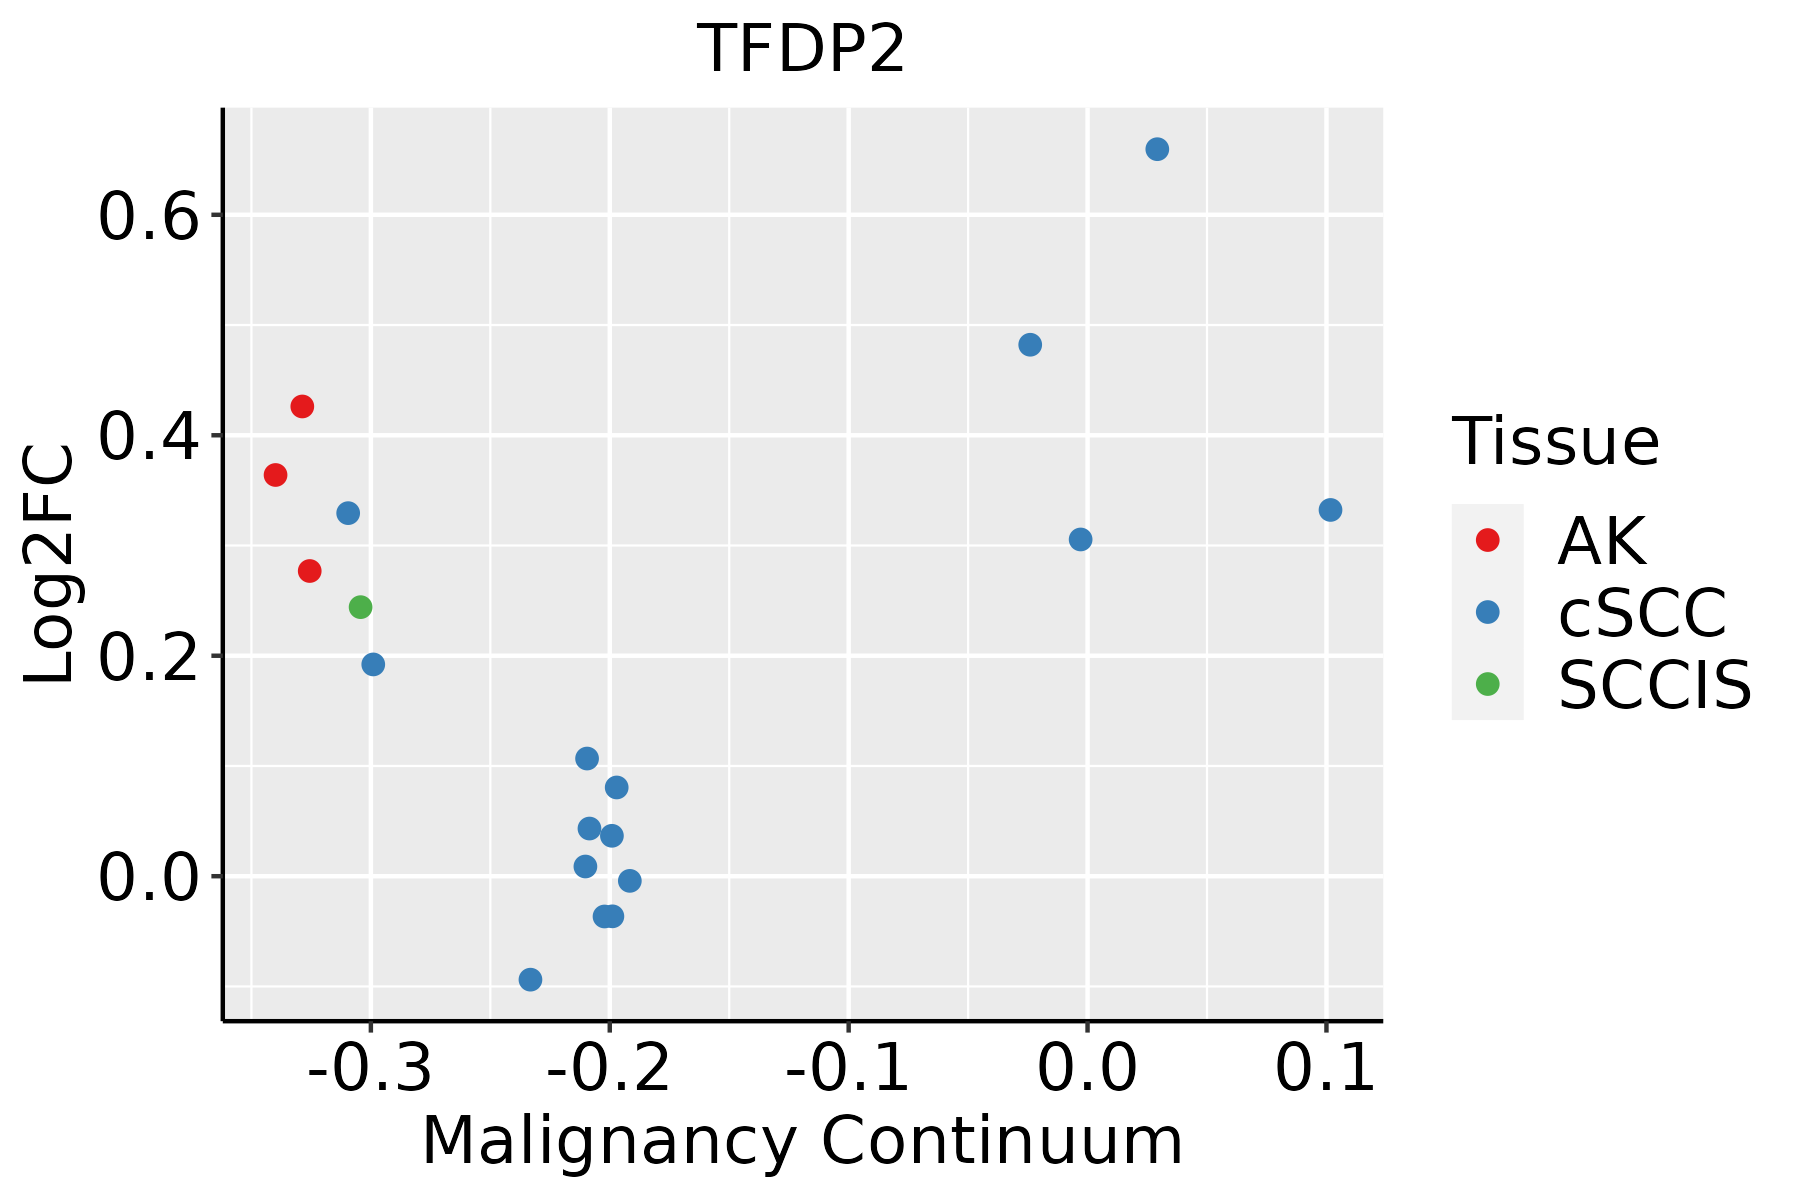 | AK: Actinic keratosis |
| cSCC: Cutaneous squamous cell carcinoma | ||
| SCCIS:squamous cell carcinoma in situ | ||
| Thyroid | 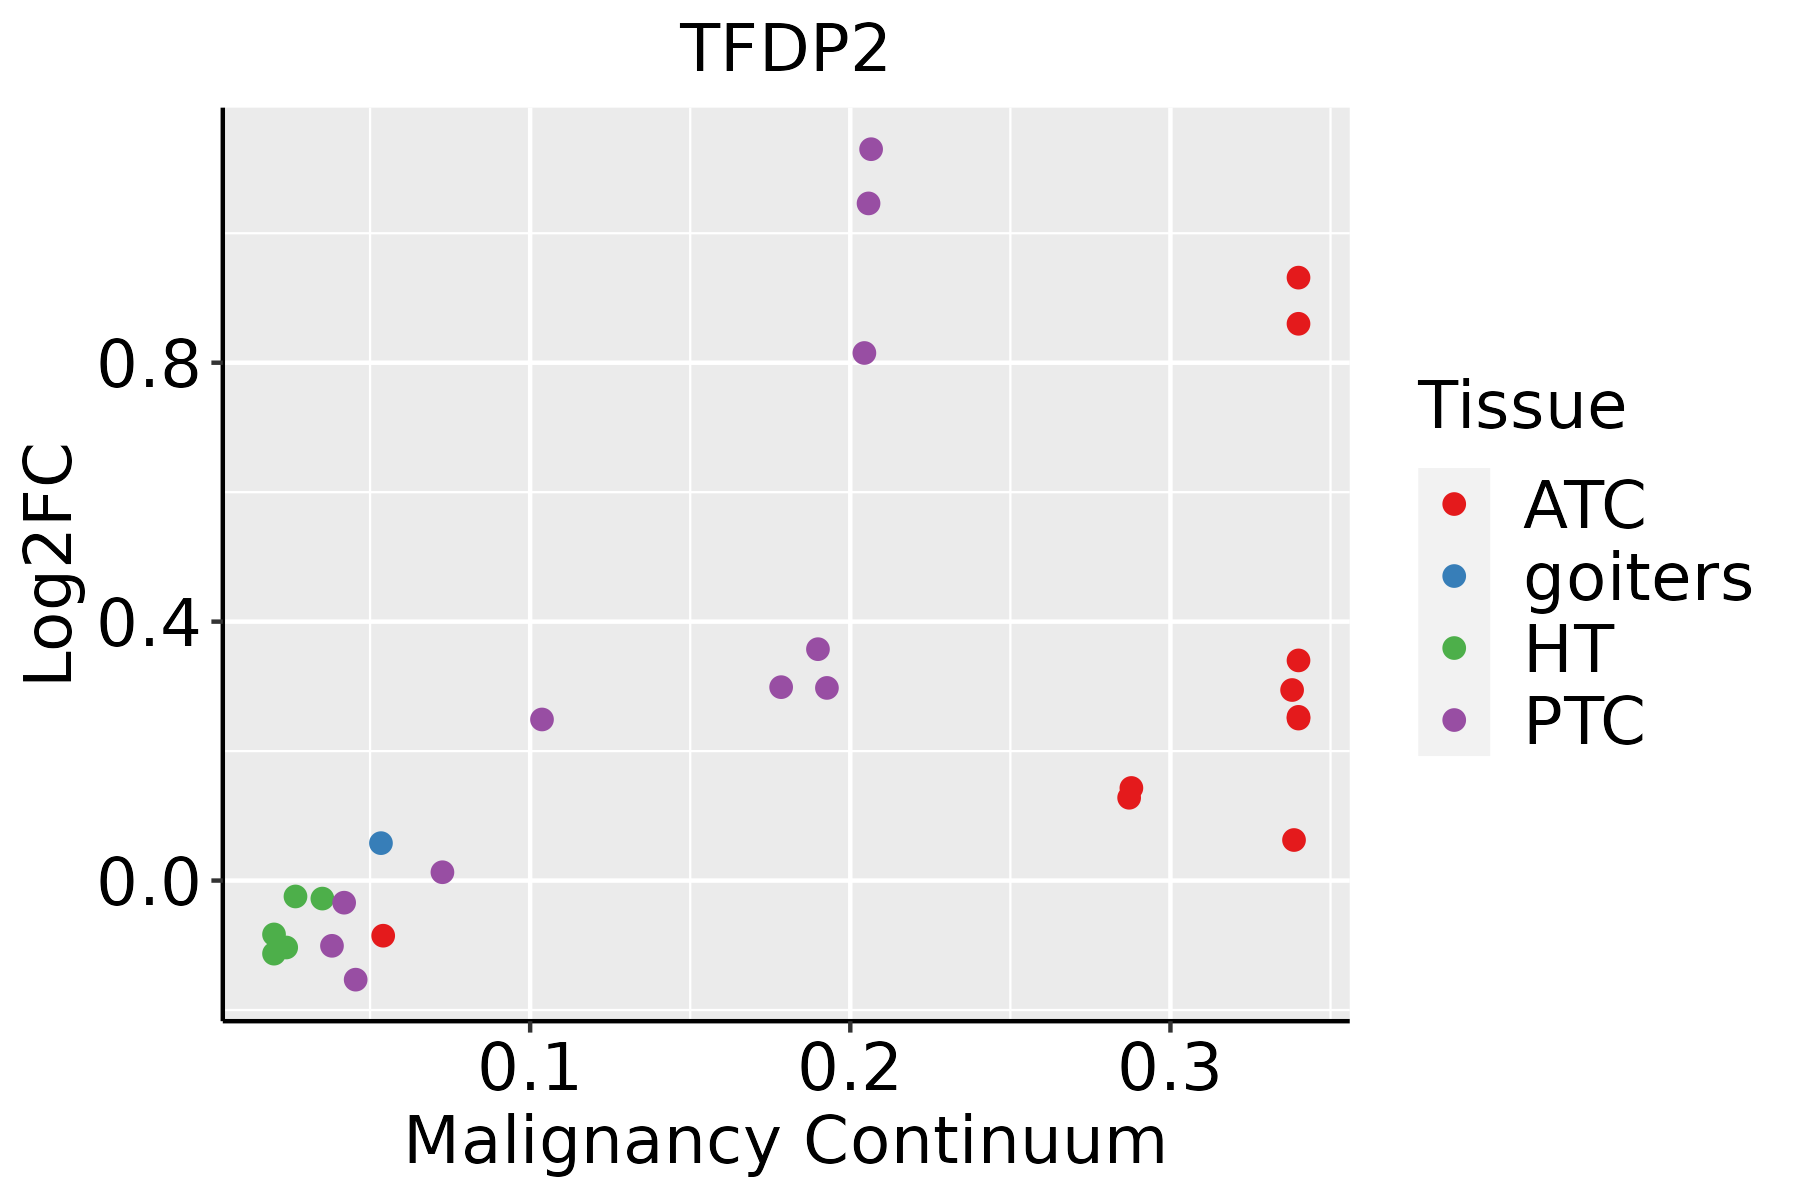 | ATC: Anaplastic thyroid cancer |
| HT: Hashimoto's thyroiditis | ||
| PTC: Papillary thyroid cancer |
| ∗log2FC in expression of this searched gene in stem-like cells from each diseased tissue sample relative to stem-like cells in normal samples in each tissue plotted against the malignancy continuum. Samples are colored based on if they are from different disease stage. |
Top |
Malignant transformation related pathway analysis |
| Find out the enriched GO biological processes and KEGG pathways involved in transition from healthy to precancer to cancer |
| Tissue | Disease Stage | Enriched GO biological Processes |
| Colorectum | AD |  |
| Colorectum | SER |  |
| Colorectum | MSS |  |
| Colorectum | MSI-H |  |
| Colorectum | FAP |  |
| ∗Top 15 enriched GO BP terms are showed in the bar plot of each disease state in each tissue. Each row represents a significant GO biological process which is colored according to the -log10(p.adjust). |
| Page: 1 2 3 4 5 6 7 8 9 |
| GO ID | Tissue | Disease Stage | Description | Gene Ratio | Bg Ratio | pvalue | p.adjust | Count |
| Page: 1 |
| Pathway ID | Tissue | Disease Stage | Description | Gene Ratio | Bg Ratio | pvalue | p.adjust | qvalue | Count |
| hsa041106 | Cervix | CC | Cell cycle | 36/1267 | 157/8465 | 4.94e-03 | 1.67e-02 | 9.86e-03 | 36 |
| hsa0411013 | Cervix | CC | Cell cycle | 36/1267 | 157/8465 | 4.94e-03 | 1.67e-02 | 9.86e-03 | 36 |
| hsa04110 | Colorectum | FAP | Cell cycle | 37/1404 | 157/8465 | 1.44e-02 | 4.77e-02 | 2.90e-02 | 37 |
| hsa041101 | Colorectum | FAP | Cell cycle | 37/1404 | 157/8465 | 1.44e-02 | 4.77e-02 | 2.90e-02 | 37 |
| hsa041109 | Esophagus | HGIN | Cell cycle | 38/1383 | 157/8465 | 6.70e-03 | 4.37e-02 | 3.47e-02 | 38 |
| hsa0411016 | Esophagus | HGIN | Cell cycle | 38/1383 | 157/8465 | 6.70e-03 | 4.37e-02 | 3.47e-02 | 38 |
| hsa0411023 | Esophagus | ESCC | Cell cycle | 126/4205 | 157/8465 | 1.34e-15 | 5.60e-14 | 2.87e-14 | 126 |
| hsa0411033 | Esophagus | ESCC | Cell cycle | 126/4205 | 157/8465 | 1.34e-15 | 5.60e-14 | 2.87e-14 | 126 |
| hsa041104 | Liver | Cirrhotic | Cell cycle | 61/2530 | 157/8465 | 9.53e-03 | 3.21e-02 | 1.98e-02 | 61 |
| hsa0411011 | Liver | Cirrhotic | Cell cycle | 61/2530 | 157/8465 | 9.53e-03 | 3.21e-02 | 1.98e-02 | 61 |
| hsa041102 | Liver | HCC | Cell cycle | 106/4020 | 157/8465 | 2.54e-07 | 3.04e-06 | 1.69e-06 | 106 |
| hsa041103 | Liver | HCC | Cell cycle | 106/4020 | 157/8465 | 2.54e-07 | 3.04e-06 | 1.69e-06 | 106 |
| hsa041105 | Lung | IAC | Cell cycle | 30/1053 | 157/8465 | 1.03e-02 | 3.83e-02 | 2.54e-02 | 30 |
| hsa0411012 | Lung | IAC | Cell cycle | 30/1053 | 157/8465 | 1.03e-02 | 3.83e-02 | 2.54e-02 | 30 |
| hsa041108 | Oral cavity | OSCC | Cell cycle | 118/3704 | 157/8465 | 7.15e-16 | 2.66e-14 | 1.35e-14 | 118 |
| hsa0411015 | Oral cavity | OSCC | Cell cycle | 118/3704 | 157/8465 | 7.15e-16 | 2.66e-14 | 1.35e-14 | 118 |
| hsa0411022 | Oral cavity | LP | Cell cycle | 70/2418 | 157/8465 | 1.17e-05 | 8.27e-05 | 5.33e-05 | 70 |
| hsa0411032 | Oral cavity | LP | Cell cycle | 70/2418 | 157/8465 | 1.17e-05 | 8.27e-05 | 5.33e-05 | 70 |
| hsa041107 | Prostate | BPH | Cell cycle | 49/1718 | 157/8465 | 7.39e-04 | 3.59e-03 | 2.22e-03 | 49 |
| hsa0411014 | Prostate | BPH | Cell cycle | 49/1718 | 157/8465 | 7.39e-04 | 3.59e-03 | 2.22e-03 | 49 |
| Page: 1 2 |
Top |
Cell-cell communication analysis |
| Identification of potential cell-cell interactions between two cell types and their ligand-receptor pairs for different disease states |
| Ligand | Receptor | LRpair | Pathway | Tissue | Disease Stage |
| Page: 1 |
Top |
Single-cell gene regulatory network inference analysis |
| Find out the significant the regulons (TFs) and the target genes of each regulon across cell types for different disease states |
| TF | Cell Type | Tissue | Disease Stage | Target Gene | RSS | Regulon Activity |
| TFDP2 | STM | Breast | Healthy | AL354733.3,CADM1,SOX4, etc. | 1.57e-01 |  |
| TFDP2 | MSC.ADIPO | Cervix | CC | HLTF,SLC25A36,ACAP2, etc. | 2.53e-01 |  |
| TFDP2 | MSC.MVA | Cervix | CC | HLTF,SLC25A36,ACAP2, etc. | 1.85e-01 | |
| TFDP2 | STM | Esophagus | ADJ | SLC25A36,U2SURP,ATP1B3, etc. | 4.54e-01 |  |
| TFDP2 | CD8TEXINT | Esophagus | ADJ | PPM1K,LRRFIP2,APOC1, etc. | 2.45e-01 | |
| TFDP2 | GDT | Oral cavity | EOLP | TGFBR3,IL18RAP,GALNT11, etc. | 1.31e-01 |  |
| TFDP2 | INMON | Oral cavity | Healthy | TGFBR3,IL18RAP,GALNT11, etc. | 4.54e-02 |  |
| TFDP2 | INMON | Oral cavity | LP | TGFBR3,IL18RAP,GALNT11, etc. | 9.49e-02 |  |
| TFDP2 | MYOFIB | Oral cavity | LP | CCDC138,RMDN2-AS1,ZFPM2, etc. | 7.38e-02 | |
| TFDP2 | MYOFIB | Oral cavity | OSCC | CCDC138,RMDN2-AS1,ZFPM2, etc. | 1.76e-01 |  |
| ∗The dot plots of a searched regulon are shown for all cell subpopulations in each disease state of each tissue based on the regulon specific score inferred using pySCENIC and by calculating the average expression. |
| Page: 1 2 |
Top |
Somatic mutation of malignant transformation related genes |
| Annotation of somatic variants for genes involved in malignant transformation |
| Hugo Symbol | Variant Class | Variant Classification | dbSNP RS | HGVSc | HGVSp | HGVSp Short | SWISSPROT | BIOTYPE | SIFT | PolyPhen | Tumor Sample Barcode | Tissue | Histology | Sex | Age | Stage | Therapy Types | Drugs | Outcome |
| TFDP2 | SNV | Missense_Mutation | novel | c.1334N>A | p.Pro445Gln | p.P445Q | Q14188 | protein_coding | deleterious_low_confidence(0) | probably_damaging(0.994) | TCGA-A7-A0DB-01 | Breast | breast invasive carcinoma | Female | <65 | I/II | Hormone Therapy | arimidex | SD |
| TFDP2 | SNV | Missense_Mutation | rs776411928 | c.1010N>T | p.Ala337Val | p.A337V | Q14188 | protein_coding | tolerated(0.08) | probably_damaging(0.997) | TCGA-AN-A0AK-01 | Breast | breast invasive carcinoma | Female | >=65 | I/II | Unknown | Unknown | SD |
| TFDP2 | SNV | Missense_Mutation | c.889N>C | p.Glu297Gln | p.E297Q | Q14188 | protein_coding | deleterious(0) | probably_damaging(0.996) | TCGA-D8-A1X9-01 | Breast | breast invasive carcinoma | Female | >=65 | I/II | Chemotherapy | adriamycin+cyclophosphamide | SD | |
| TFDP2 | insertion | Frame_Shift_Ins | novel | c.1274_1275insACTAATCCAATATTTAGTGTTTCACAGAAACACTAGAAAAC | p.Thr426LeufsTer59 | p.T426Lfs*59 | Q14188 | protein_coding | TCGA-A8-A07U-01 | Breast | breast invasive carcinoma | Female | >=65 | III/IV | Chemotherapy | 5-fluorouracil | SD | ||
| TFDP2 | deletion | Frame_Shift_Del | c.1203_1228delNNNNNNNNNNNNNNNNNNNNNNNNNN | p.Gly402ProfsTer22 | p.G402Pfs*22 | Q14188 | protein_coding | TCGA-AN-A041-01 | Breast | breast invasive carcinoma | Female | <65 | I/II | Unknown | Unknown | SD | |||
| TFDP2 | SNV | Missense_Mutation | novel | c.7G>A | p.Ala3Thr | p.A3T | Q14188 | protein_coding | deleterious(0.03) | benign(0) | TCGA-2W-A8YY-01 | Cervix | cervical & endocervical cancer | Female | <65 | I/II | Chemotherapy | cisplatin | CR |
| TFDP2 | SNV | Missense_Mutation | novel | c.514N>A | p.Asp172Asn | p.D172N | Q14188 | protein_coding | tolerated(0.09) | probably_damaging(0.955) | TCGA-MA-AA3Y-01 | Cervix | cervical & endocervical cancer | Female | <65 | I/II | Unknown | Unknown | SD |
| TFDP2 | SNV | Missense_Mutation | c.151N>G | p.Leu51Val | p.L51V | Q14188 | protein_coding | deleterious(0.05) | possibly_damaging(0.482) | TCGA-A6-3809-01 | Colorectum | colon adenocarcinoma | Female | >=65 | I/II | Unknown | Unknown | SD | |
| TFDP2 | SNV | Missense_Mutation | novel | c.878G>T | p.Ser293Ile | p.S293I | Q14188 | protein_coding | deleterious(0) | probably_damaging(0.999) | TCGA-AA-3950-01 | Colorectum | colon adenocarcinoma | Female | >=65 | I/II | Unknown | Unknown | SD |
| TFDP2 | SNV | Missense_Mutation | c.545G>A | p.Arg182Gln | p.R182Q | Q14188 | protein_coding | deleterious(0) | probably_damaging(0.998) | TCGA-AA-A010-01 | Colorectum | colon adenocarcinoma | Female | <65 | I/II | Chemotherapy | folinic | CR |
| Page: 1 2 3 4 5 6 |
Top |
Related drugs of malignant transformation related genes |
| Identification of chemicals and drugs interact with genes involved in malignant transfromation |
| (DGIdb 4.0) |
| Entrez ID | Symbol | Category | Interaction Types | Drug Claim Name | Drug Name | PMIDs |
| Page: 1 |

Copyright 2023-Present -The University of Texas Health Science Center at Houston |