| Tissue | Expression Dynamics | Abbreviation |
| Cervix | 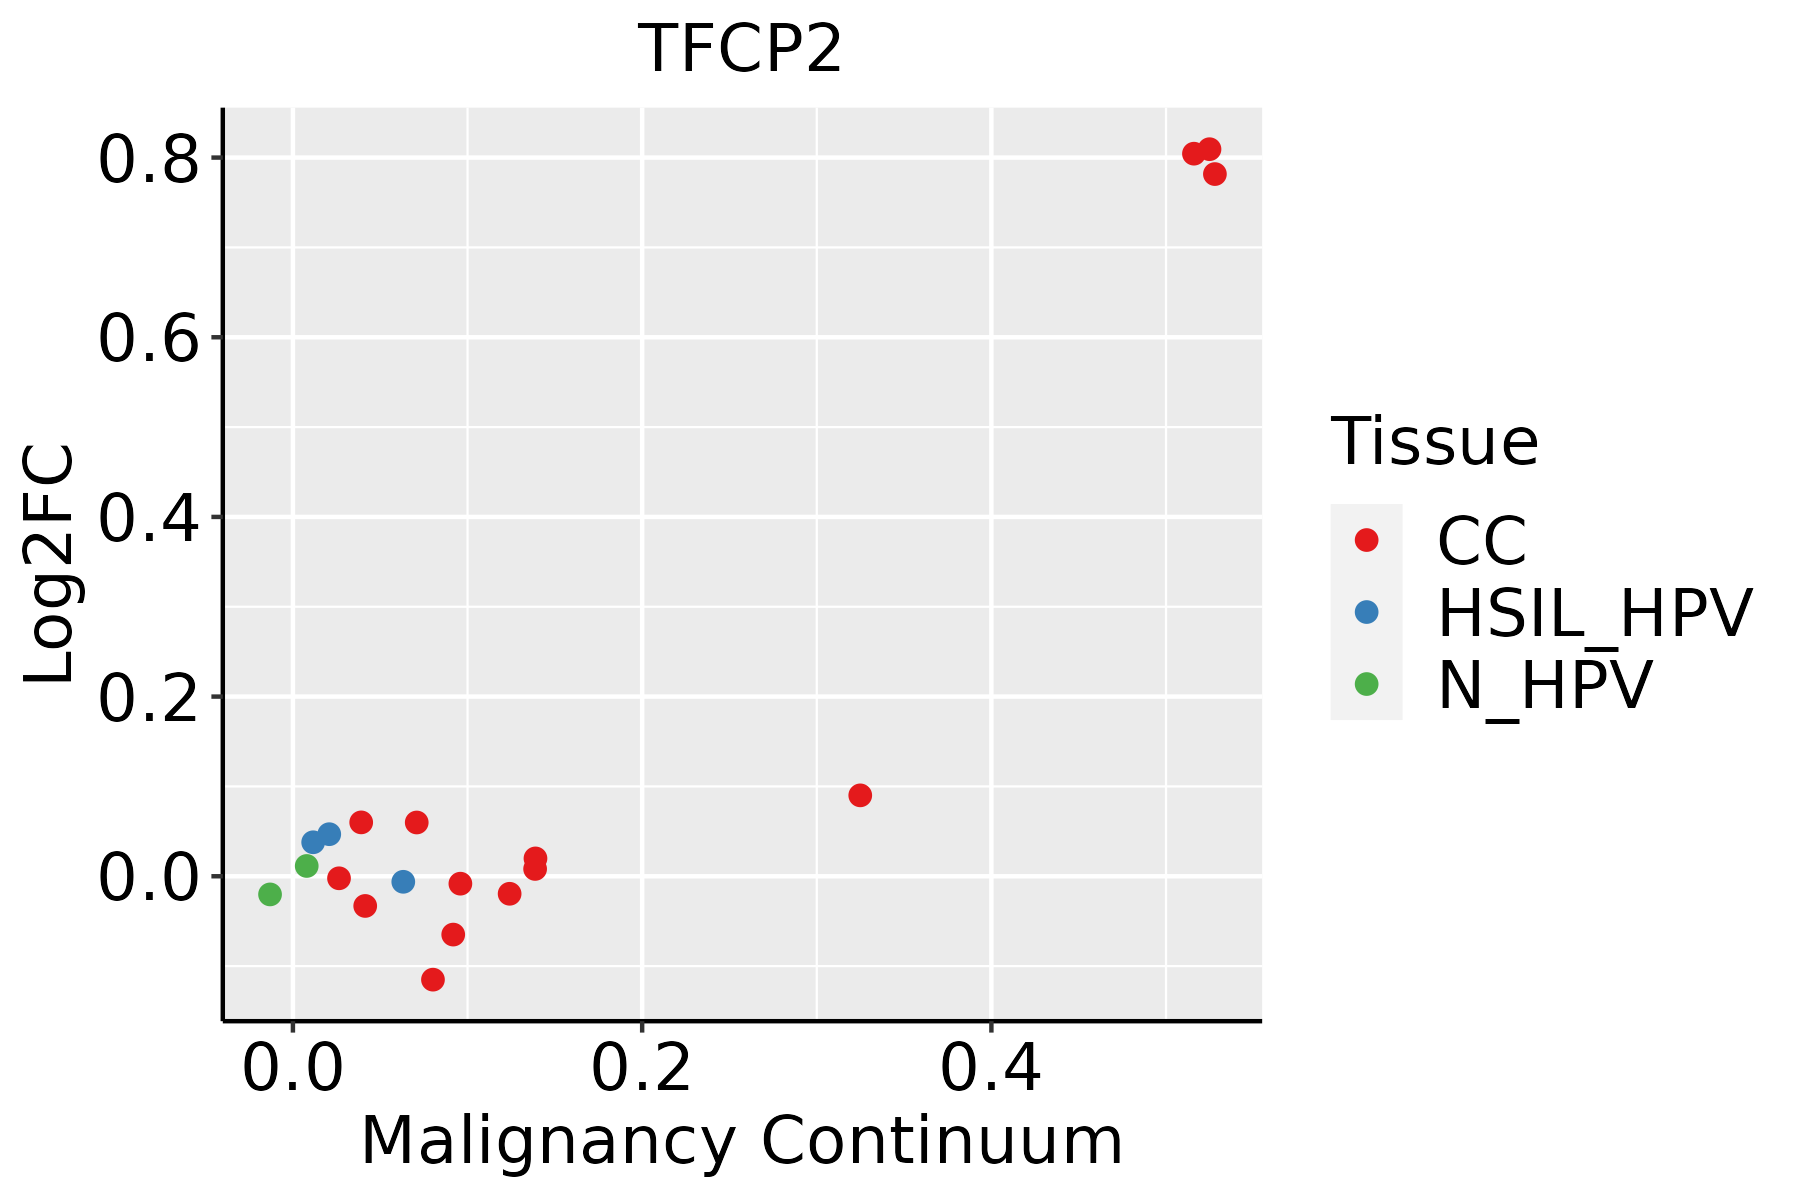 | CC: Cervix cancer |
| HSIL_HPV: HPV-infected high-grade squamous intraepithelial lesions |
| N_HPV: HPV-infected normal cervix |
| Colorectum (GSE201348) |  | FAP: Familial adenomatous polyposis |
| CRC: Colorectal cancer |
| Colorectum (HTA11) |  | AD: Adenomas |
| SER: Sessile serrated lesions |
| MSI-H: Microsatellite-high colorectal cancer |
| MSS: Microsatellite stable colorectal cancer |
| Endometrium | 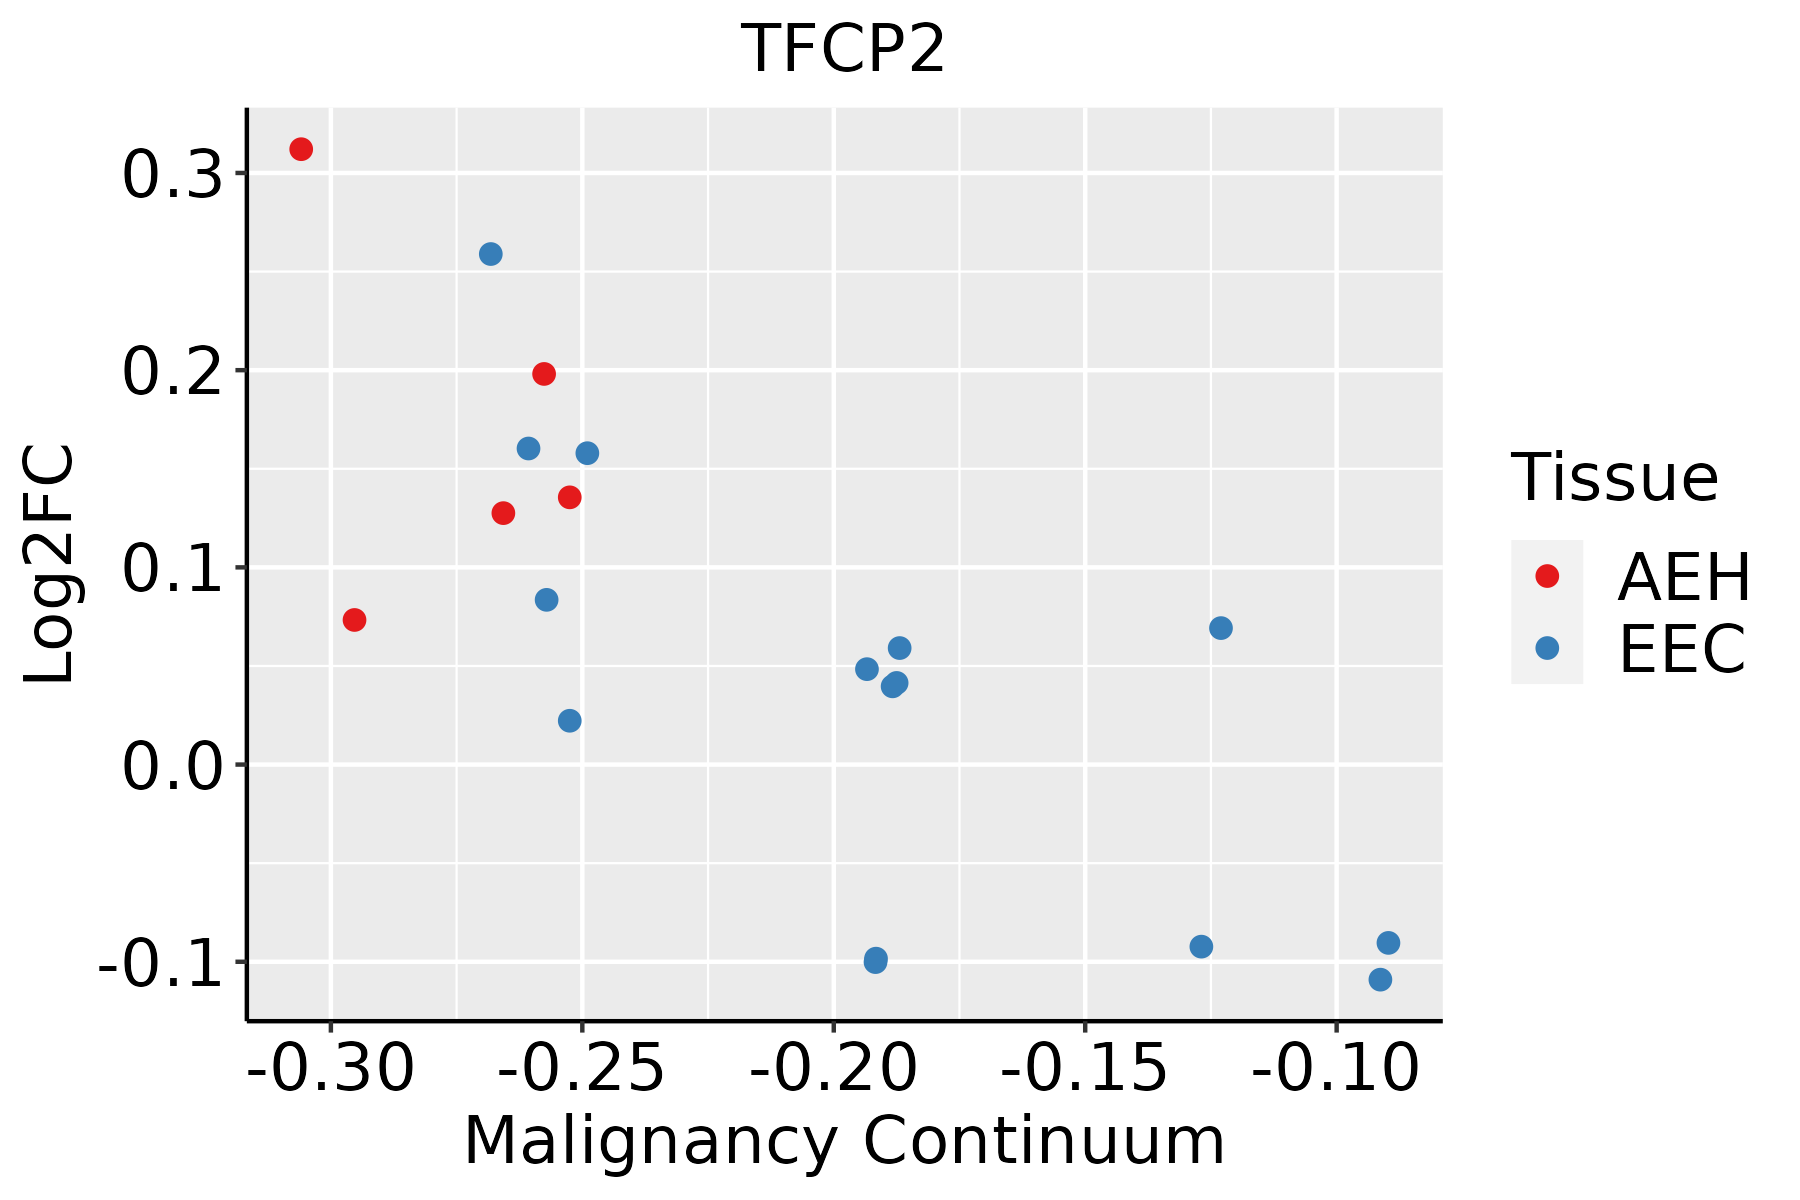 | AEH: Atypical endometrial hyperplasia |
| EEC: Endometrioid Cancer |
| Esophagus | 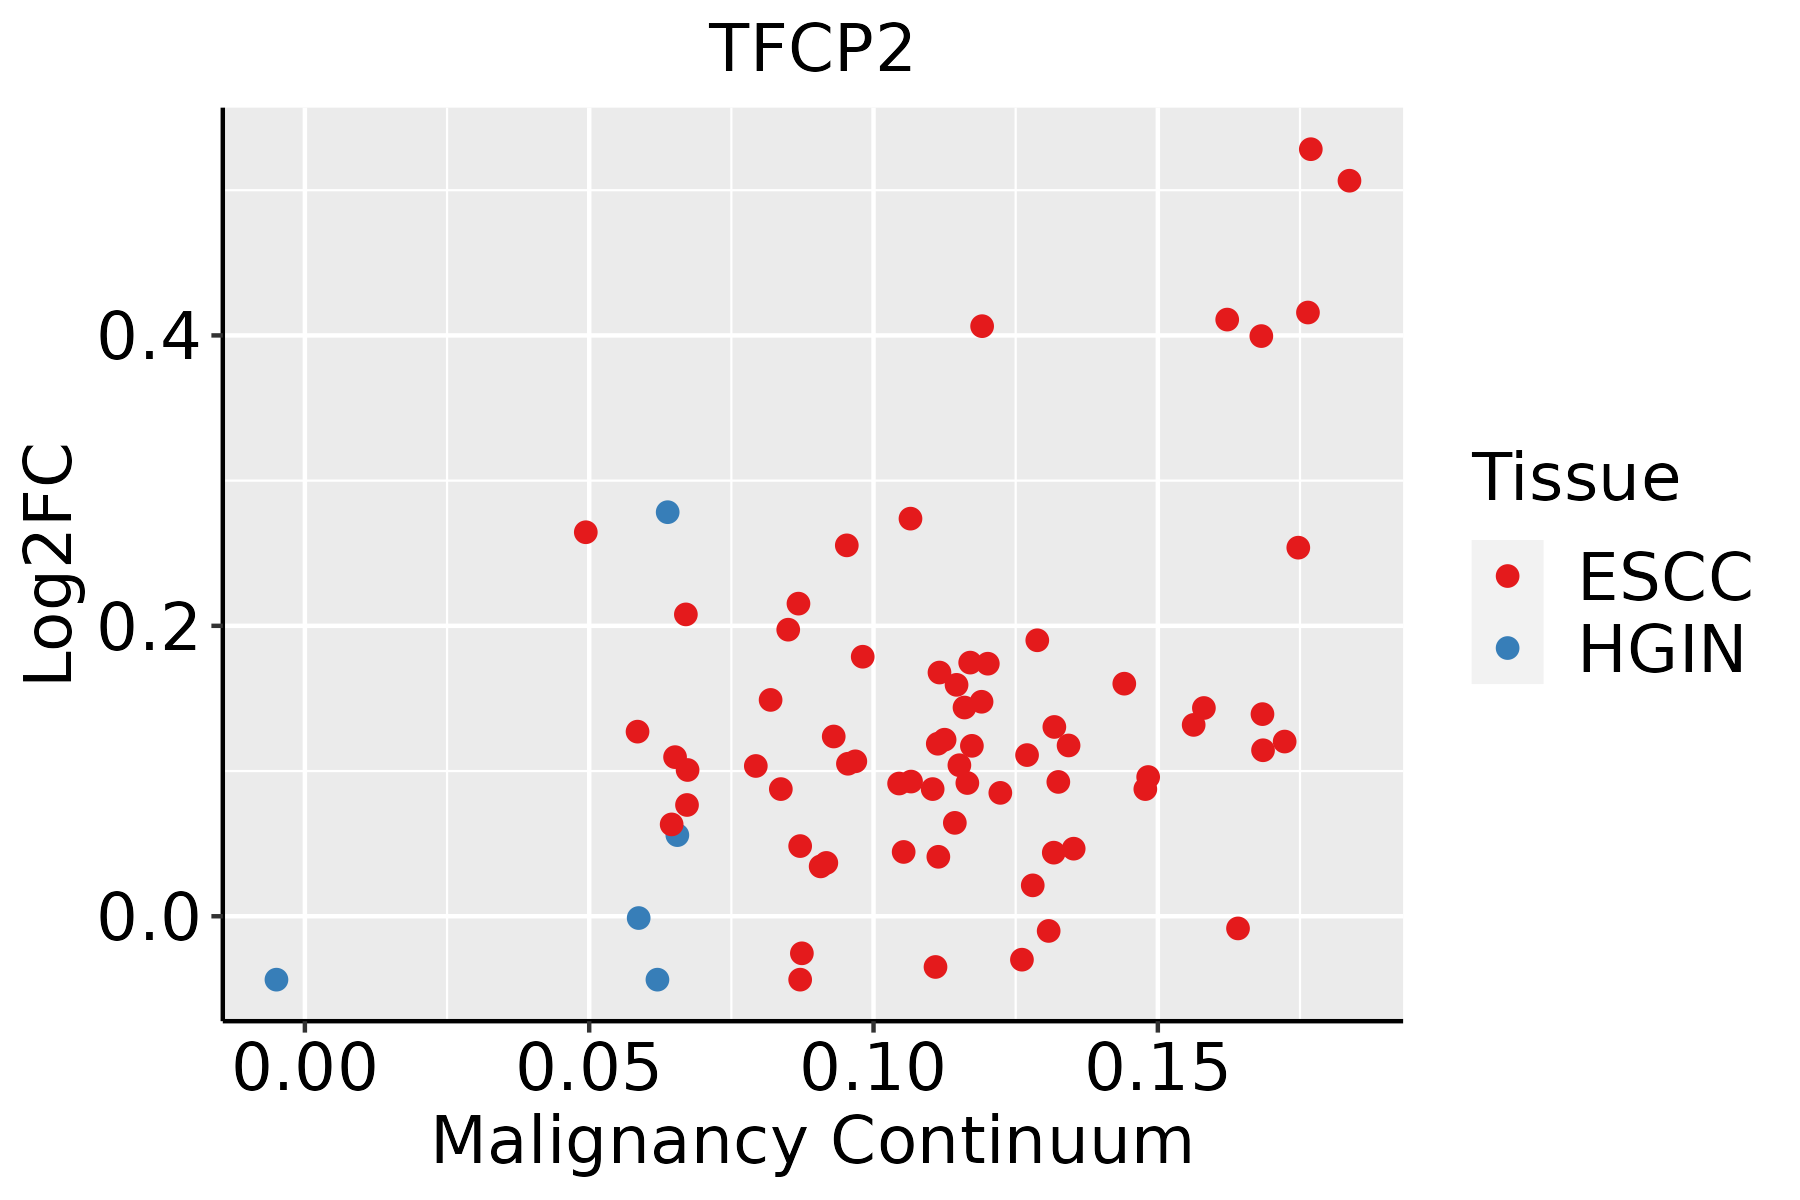 | ESCC: Esophageal squamous cell carcinoma |
| HGIN: High-grade intraepithelial neoplasias |
| LGIN: Low-grade intraepithelial neoplasias |
| Liver | 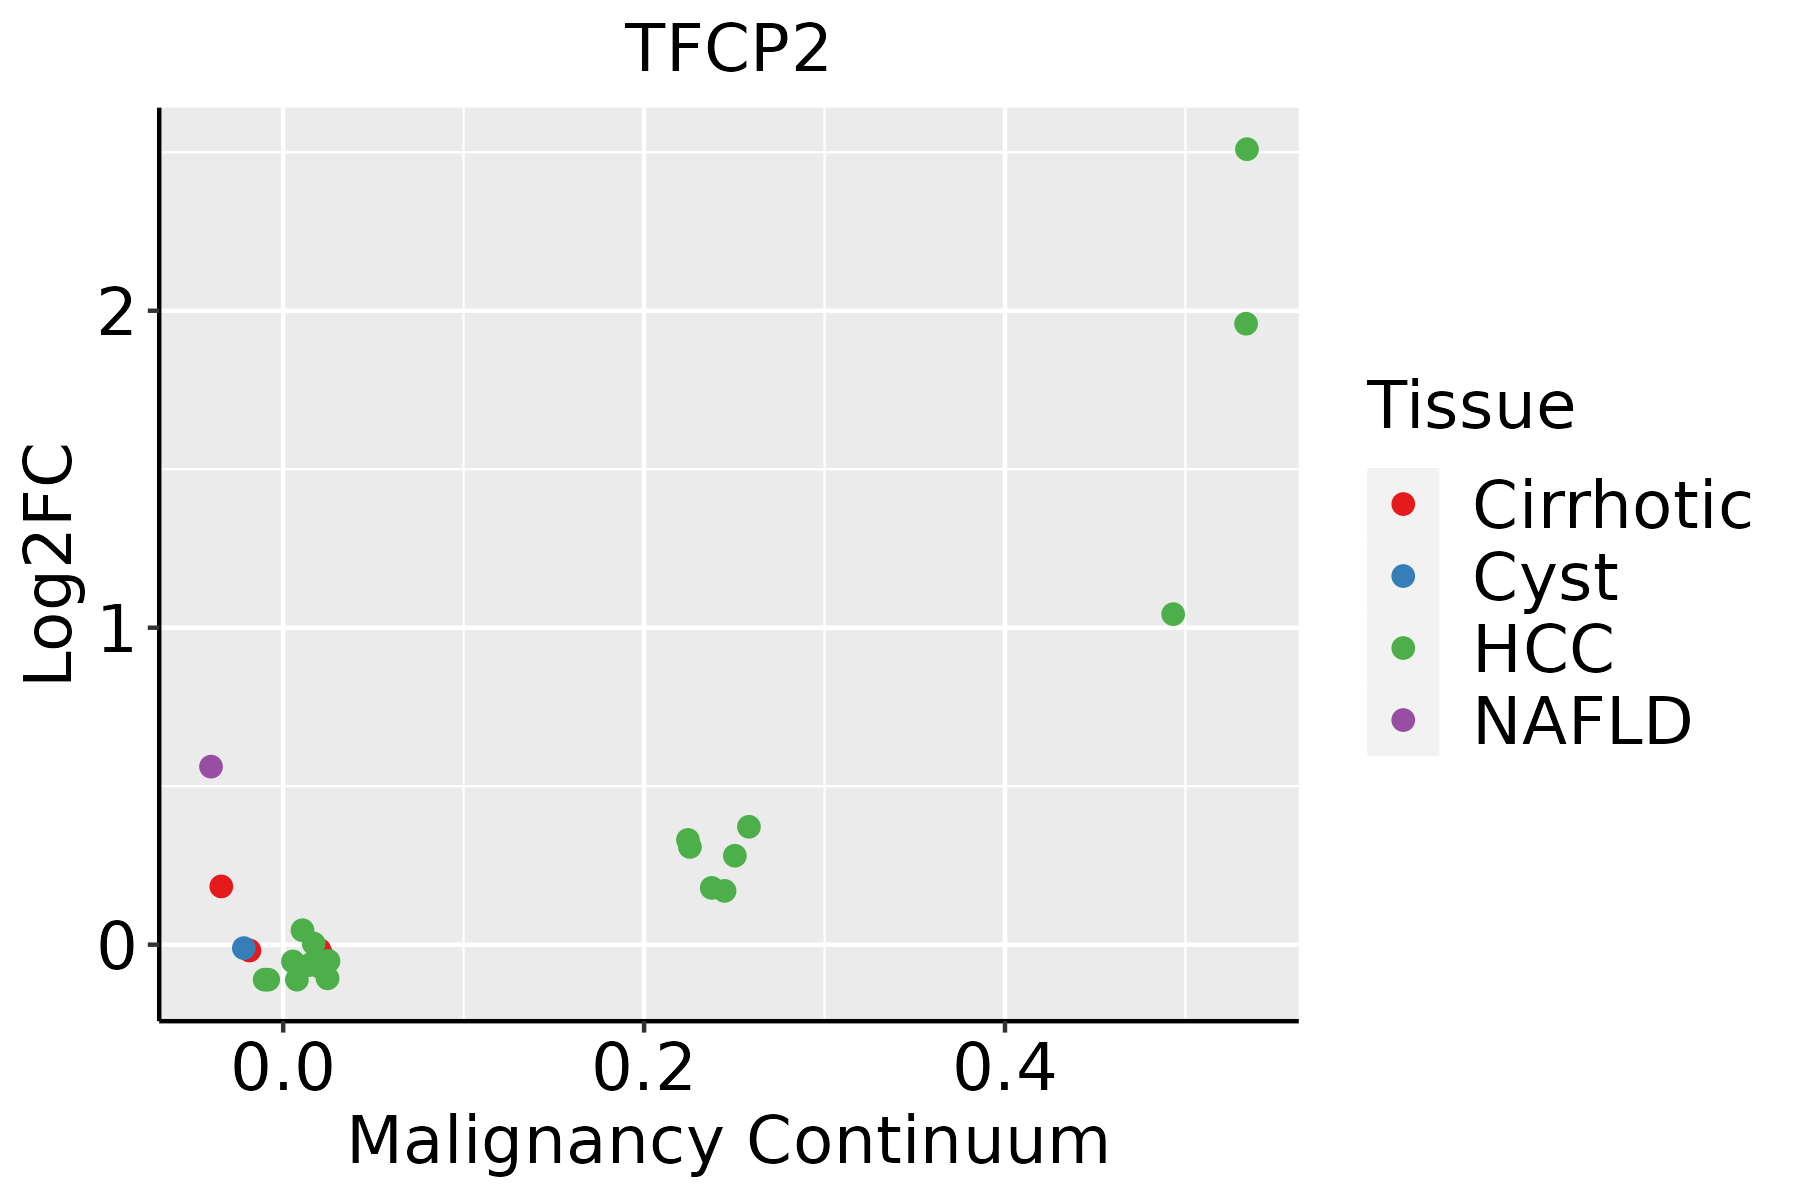 | HCC: Hepatocellular carcinoma |
| NAFLD: Non-alcoholic fatty liver disease |
| Lung |  | AAH: Atypical adenomatous hyperplasia |
| AIS: Adenocarcinoma in situ |
| IAC: Invasive lung adenocarcinoma |
| MIA: Minimally invasive adenocarcinoma |
| GO ID | Tissue | Disease Stage | Description | Gene Ratio | Bg Ratio | pvalue | p.adjust | Count |
| GO:0002064 | Colorectum | AD | epithelial cell development | 89/3918 | 220/18723 | 2.98e-11 | 3.52e-09 | 89 |
| GO:0048732 | Colorectum | AD | gland development | 149/3918 | 436/18723 | 6.07e-11 | 6.33e-09 | 149 |
| GO:0007568 | Colorectum | AD | aging | 98/3918 | 339/18723 | 2.77e-04 | 3.39e-03 | 98 |
| GO:0045927 | Colorectum | AD | positive regulation of growth | 77/3918 | 259/18723 | 4.82e-04 | 5.27e-03 | 77 |
| GO:00487321 | Colorectum | SER | gland development | 112/2897 | 436/18723 | 1.75e-08 | 1.28e-06 | 112 |
| GO:00020641 | Colorectum | SER | epithelial cell development | 64/2897 | 220/18723 | 1.96e-07 | 1.10e-05 | 64 |
| GO:00459271 | Colorectum | SER | positive regulation of growth | 56/2897 | 259/18723 | 5.10e-03 | 3.91e-02 | 56 |
| GO:00487322 | Colorectum | MSS | gland development | 143/3467 | 436/18723 | 3.85e-13 | 8.01e-11 | 143 |
| GO:00020642 | Colorectum | MSS | epithelial cell development | 81/3467 | 220/18723 | 1.02e-10 | 1.06e-08 | 81 |
| GO:00075681 | Colorectum | MSS | aging | 90/3467 | 339/18723 | 1.51e-04 | 2.19e-03 | 90 |
| GO:00459272 | Colorectum | MSS | positive regulation of growth | 68/3467 | 259/18723 | 1.24e-03 | 1.19e-02 | 68 |
| GO:00020644 | Colorectum | FAP | epithelial cell development | 62/2622 | 220/18723 | 2.74e-08 | 2.54e-06 | 62 |
| GO:00487324 | Colorectum | FAP | gland development | 103/2622 | 436/18723 | 3.61e-08 | 3.12e-06 | 103 |
| GO:00459273 | Colorectum | FAP | positive regulation of growth | 66/2622 | 259/18723 | 6.11e-07 | 3.05e-05 | 66 |
| GO:00075682 | Colorectum | FAP | aging | 69/2622 | 339/18723 | 7.66e-04 | 8.12e-03 | 69 |
| GO:0021700 | Colorectum | FAP | developmental maturation | 57/2622 | 280/18723 | 2.08e-03 | 1.72e-02 | 57 |
| GO:0007028 | Colorectum | FAP | cytoplasm organization | 5/2622 | 10/18723 | 7.32e-03 | 4.38e-02 | 5 |
| GO:00020645 | Colorectum | CRC | epithelial cell development | 55/2078 | 220/18723 | 4.63e-09 | 1.16e-06 | 55 |
| GO:00487325 | Colorectum | CRC | gland development | 88/2078 | 436/18723 | 1.62e-08 | 2.79e-06 | 88 |
| GO:00459274 | Colorectum | CRC | positive regulation of growth | 51/2078 | 259/18723 | 3.23e-05 | 8.27e-04 | 51 |
| TF | Cell Type | Tissue | Disease Stage | Target Gene | RSS | Regulon Activity |
| TFCP2 | MSC.ADIPO | Cervix | CC | E2F5,NSMCE3,ALYREF, etc. | 2.02e-01 |  |
| TFCP2 | DC | Colorectum | ADJ | KDM2B,PREX1,PDCD1LG2, etc. | 9.36e-02 |  |
| TFCP2 | DC | Colorectum | CRC | KDM2B,PREX1,PDCD1LG2, etc. | 8.80e-02 |  |
| TFCP2 | DC | Colorectum | FAP | KDM2B,PREX1,PDCD1LG2, etc. | 1.13e-01 |  |
| TFCP2 | DC | Colorectum | SER | KDM2B,PREX1,PDCD1LG2, etc. | 8.13e-02 |  |
| TFCP2 | LYMEND | Esophagus | ESCC | IRS2,TSLP,SLC5A3, etc. | 5.81e-02 |  |
| TFCP2 | SMC | Esophagus | Healthy | IRS2,TSLP,SLC5A3, etc. | 8.33e-02 |  |
| TFCP2 | CD8TEREX | Liver | Healthy | CD7,UHMK1,ETV5, etc. | 9.70e-03 |  |
| TFCP2 | MMC | Lung | Healthy | F13A1,ATM,ADCY3, etc. | 2.23e-03 |  |
| TFCP2 | cDC | Skin | AK | LRRK1,TMCC3,NCKAP5, etc. | 4.96e-02 |  |
| Hugo Symbol | Variant Class | Variant Classification | dbSNP RS | HGVSc | HGVSp | HGVSp Short | SWISSPROT | BIOTYPE | SIFT | PolyPhen | Tumor Sample Barcode | Tissue | Histology | Sex | Age | Stage | Therapy Types | Drugs | Outcome |
| TFCP2 | SNV | Missense_Mutation | novel | c.543N>T | p.Lys181Asn | p.K181N | Q12800 | protein_coding | deleterious(0.02) | possibly_damaging(0.735) | TCGA-AN-A046-01 | Breast | breast invasive carcinoma | Female | >=65 | I/II | Unknown | Unknown | SD |
| TFCP2 | SNV | Missense_Mutation | novel | c.1441N>A | p.Glu481Lys | p.E481K | Q12800 | protein_coding | deleterious(0.01) | benign(0.102) | TCGA-D8-A73U-01 | Breast | breast invasive carcinoma | Female | >=65 | I/II | Hormone Therapy | tamoxiphen | SD |
| TFCP2 | SNV | Missense_Mutation | | c.794N>T | p.Tyr265Phe | p.Y265F | Q12800 | protein_coding | tolerated(0.07) | benign(0.424) | TCGA-EW-A1OY-01 | Breast | breast invasive carcinoma | Female | <65 | I/II | Chemotherapy | doxorubicin | SD |
| TFCP2 | SNV | Missense_Mutation | novel | c.1129N>T | p.Leu377Phe | p.L377F | Q12800 | protein_coding | deleterious(0.02) | benign(0.32) | TCGA-2W-A8YY-01 | Cervix | cervical & endocervical cancer | Female | <65 | I/II | Chemotherapy | cisplatin | CR |
| TFCP2 | SNV | Missense_Mutation | | c.1365N>G | p.Ile455Met | p.I455M | Q12800 | protein_coding | deleterious(0) | probably_damaging(0.98) | TCGA-C5-A1BK-01 | Cervix | cervical & endocervical cancer | Female | <65 | I/II | Unknown | Unknown | SD |
| TFCP2 | SNV | Missense_Mutation | | c.200T>G | p.Phe67Cys | p.F67C | Q12800 | protein_coding | deleterious(0) | probably_damaging(0.967) | TCGA-FU-A3HZ-01 | Cervix | cervical & endocervical cancer | Female | <65 | I/II | Chemotherapy | cisplatin | CR |
| TFCP2 | SNV | Missense_Mutation | novel | c.551N>G | p.Ser184Cys | p.S184C | Q12800 | protein_coding | deleterious(0.01) | probably_damaging(0.95) | TCGA-IR-A3LA-01 | Cervix | cervical & endocervical cancer | Female | <65 | I/II | Chemotherapy | cisplatin | CR |
| TFCP2 | SNV | Missense_Mutation | | c.588N>A | p.Phe196Leu | p.F196L | Q12800 | protein_coding | deleterious(0.02) | probably_damaging(0.984) | TCGA-IR-A3LI-01 | Cervix | cervical & endocervical cancer | Female | <65 | I/II | Chemotherapy | cisplatin | CR |
| TFCP2 | SNV | Missense_Mutation | novel | c.1117N>C | p.Asp373His | p.D373H | Q12800 | protein_coding | deleterious(0) | probably_damaging(0.987) | TCGA-VS-A958-01 | Cervix | cervical & endocervical cancer | Female | <65 | I/II | Chemotherapy | cisplatin | CR |
| TFCP2 | SNV | Missense_Mutation | novel | c.286N>A | p.Glu96Lys | p.E96K | Q12800 | protein_coding | deleterious(0) | possibly_damaging(0.542) | TCGA-VS-A958-01 | Cervix | cervical & endocervical cancer | Female | <65 | I/II | Chemotherapy | cisplatin | CR |


